Estimated zip code population in 2022: 1,883 Zip code population in 2010: 2,164 Zip code population in 2000: 2,083
Houses and condos: 887 Renter-occupied apartments: 157
% of renters here:
18%
State:
33%
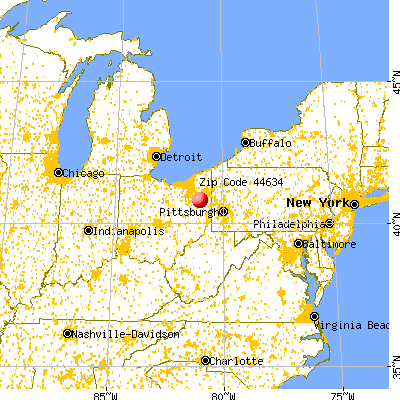
March 2022 cost of living index in zip code 44634: 82.4 (low, U.S. average is 100)
Land area: 19.0 sq. mi. Water area: 0.0 sq. mi.
Population density: 99 people per square mile
(very low).
OSM Map
General Map
Google Map
MSN Map
OSM Map
General Map
Google Map
MSN Map
OSM Map
General Map
Google Map
MSN Map
OSM Map
General Map
Google Map
MSN Map
Please wait while loading the map...
Real estate property taxes paid for housing units in 2022:
This zip code:
0.9% ($1,372)
Ohio:
1.3% ($2,639)
Median real estate property taxes paid for housing units with mortgages in 2022: $1,408 (0.9%) Median real estate property taxes paid for housing units with no mortgage in 2022: $1,346 (1.0%)
Business Search- 14 Million verified businesses
Males: 1,071
(56.9%)
Females: 812
(43.1%)
For population 25 years and over in 44634:
High school or higher: 91.4%
Bachelor's degree or higher: 8.6%
Graduate or professional degree: 3.3%
Unemployed: 4.1%
Mean travel time to work (commute): 25.3 minutes
For population 15 years and over in 44634:
Never married: 26.3%
Now married: 55.2%
Separated: 0.6%
Widowed: 6.7%
Divorced: 11.2%
Zip code 44634 compared to state average:
Black race population percentage significantly below state average.
Hispanic race population percentage significantly below state average.
Median age significantly above state average.
Foreign-born population percentage significantly below state average.
Renting percentage below state average.
Length of stay since moving in significantly above state average.
Percentage of population with a bachelor's degree or higher significantly below state average.
Estimated median house/condo value in 2022: $151,989
44634:
$151,989
Ohio:
$204,100
According to our research of Ohio and other state lists, there were 4 registered sex offenders living in 44634 zip code as of June 07, 2024. The ratio of all residents to sex offenders in zip code 44634 is 560 to 1. The ratio of registered sex offenders to all residents in this zip code is near the state average.
Median resident age:
This zip code:
53.9 years
Ohio median age:
39.9 years
Average household size:
This zip code:
2.1 people
Ohio:
2.4 people
Averages for the 2020 tax year for zip code 44634, filed in 2021:
Average Adjusted Gross Income (AGI) in 2020: $55,177 (Individual Income Tax Returns)
Here:
$55,177
State:
$67,288
Salary/wage: $49,906 (reported on 81.0% of returns)
Here:
$49,906
State:
$55,628
(% of AGI for various income ranges: 1347.9% for AGIs below $25k, 3553.2% for AGIs $25k-50k, 5980.8% for AGIs $50k-75k, 8983.8% for AGIs $75k-100k, 25140.0% for AGIs $100k-200k)
Taxable interest for individuals: $885 (reported on 26.0% of returns)
This zip code:
$885
Ohio:
$1,518
(% of AGI for various income ranges: 14.2% for AGIs below $25k, 18.2% for AGIs $25k-50k, 55.4% for AGIs $50k-75k, 32.5% for AGIs $75k-100k, 108.3% for AGIs $100k-200k)
Ordinary dividends: $2,772 (reported on 18.0% of returns)
Here:
$2,772
State:
$7,167
(% of AGI for various income ranges: 18.4% for AGIs below $25k, 57.3% for AGIs $25k-50k, 104.6% for AGIs $50k-75k, 75.0% for AGIs $75k-100k, 236.7% for AGIs $100k-200k)
Net capital gain/loss in AGI: +$5,163 (reported on 19.0% of returns)
Here:
+$5,163
State:
+$18,919
(% of AGI for various income ranges: 48.9% for AGIs below $25k, 49.5% for AGIs $25k-50k, 276.2% for AGIs $50k-75k, 358.8% for AGIs $75k-100k, 221.7% for AGIs $100k-200k)
Profit/loss from business: +$9,929 (reported on 17.0% of returns)
Here:
+$9,929
State:
+$13,744
(% of AGI for various income ranges: 126.8% for AGIs below $25k, 128.2% for AGIs $25k-50k, 396.2% for AGIs $50k-75k, 197.5% for AGIs $75k-100k, 820.0% for AGIs $100k-200k)
Taxable individual retirement arrangement distribution: $9,360 (reported on 10.0% of returns)
44634:
$9,360
Ohio:
$18,876
(% of AGI for various income ranges: 134.2% for AGIs below $25k, 183.6% for AGIs $25k-50k, 346.2% for AGIs $75k-100k)
Total itemized deductions: $21,533 (reported on 3.0% of returns)
Here:
$21,533
State:
$33,869
(% of AGI for various income ranges: 496.9% for AGIs $50k-75k)
Taxes paid: $6,133 (reported on 3.0% of returns)
44634:
$6,133
State:
$7,681
(% of AGI for various income ranges: 230.0% for AGIs $75k-100k)
Earned income credit: $2,200 (reported on 11.0% of returns)
Here:
$2,200
State:
$2,304
(% of AGI for various income ranges: 73.2% for AGIs below $25k, 46.8% for AGIs $25k-50k)
Percentage of individuals using paid preparers for their 2020 taxes: 94.0%
Here:
94%
State:
94%
(% for various income ranges: 93.3% for AGIs below $25k, 96.4% for AGIs $25k-50k, 94.4% for AGIs $50k-75k, 91.7% for AGIs $75k-100k, 91.7% for AGIs $100k-200k)
Averages for the 2012 tax year for zip code 44634, filed in 2013:
Average Adjusted Gross Income (AGI) in 2012: $53,685 (Individual Income Tax Returns)
Here:
$53,685
State:
$54,926
Salary/wage: $42,096 (reported on 85.7% of returns)
Here:
$42,096
State:
$45,869
(% of AGI for various income ranges: 73.3% for AGIs below $25k, 76.6% for AGIs $25k-50k, 75.6% for AGIs $50k-75k, 77.5% for AGIs $75k-100k, 52.0% for AGIs $100k-200k)
Taxable interest for individuals: $458 (reported on 34.3% of returns)
This zip code:
$458
Ohio:
$1,297
(% of AGI for various income ranges: 0.7% for AGIs below $25k, 0.3% for AGIs $25k-50k, 0.5% for AGIs $50k-75k, 0.2% for AGIs $75k-100k, 0.1% for AGIs $100k-200k)
Ordinary dividends: $3,665 (reported on 19.0% of returns)
Here:
$3,665
State:
$5,821
(% of AGI for various income ranges: 0.8% for AGIs below $25k, 1.2% for AGIs $25k-50k, 1.3% for AGIs $50k-75k, 0.6% for AGIs $75k-100k, 1.7% for AGIs $100k-200k)
Net capital gain/loss in AGI: +$4,133 (reported on 14.3% of returns)
Here:
+$4,133
State:
+$11,232
(% of AGI for various income ranges: 0.1% for AGIs below $25k, 1.2% for AGIs $50k-75k, 2.4% for AGIs $100k-200k)
Profit/loss from business: +$8,283 (reported on 17.1% of returns)
Here:
+$8,283
State:
+$12,773
(% of AGI for various income ranges: 6.9% for AGIs below $25k, 3.6% for AGIs $25k-50k, 2.2% for AGIs $50k-75k, 4.4% for AGIs $75k-100k, 0.7% for AGIs $100k-200k)
Taxable individual retirement arrangement distribution: $10,333 (reported on 11.4% of returns)
44634:
$10,333
Ohio:
$14,511
(% of AGI for various income ranges: 2.9% for AGIs below $25k, 3.0% for AGIs $25k-50k, 2.3% for AGIs $50k-75k, 5.9% for AGIs $75k-100k)
Total itemized deductions: $17,938 (16% of AGI, reported on 22.9% of returns)
Here:
$17,938
State:
$21,278
Here:
16.4% of AGI
State:
18.8% of AGI
(% of AGI for various income ranges: 7.7% for AGIs below $25k, 5.9% for AGIs $25k-50k, 7.6% for AGIs $50k-75k, 8.5% for AGIs $75k-100k, 8.2% for AGIs $100k-200k)
Charity contributions: $3,829 (reported on 16.2% of returns)
Here:
$3,829
State:
$3,943
(% of AGI for various income ranges: 0.6% for AGIs $25k-50k, 1.1% for AGIs $50k-75k, 1.4% for AGIs $75k-100k, 1.6% for AGIs $100k-200k)
Taxes paid: $7,239 (reported on 21.9% of returns)
44634:
$7,239
State:
$9,568
(% of AGI for various income ranges: 0.8% for AGIs below $25k, 1.2% for AGIs $25k-50k, 2.5% for AGIs $50k-75k, 3.3% for AGIs $75k-100k, 4.5% for AGIs $100k-200k)
Earned income credit: $2,136 (reported on 13.3% of returns)
Here:
$2,136
State:
$2,285
(% of AGI for various income ranges: 4.6% for AGIs below $25k, 0.8% for AGIs $25k-50k)
Percentage of individuals using paid preparers for their 2012 taxes: 62.9%
Here:
63%
State:
51%
(% for various income ranges: 56.8% for AGIs below $25k, 63.3% for AGIs $25k-50k, 66.7% for AGIs $50k-75k, 70.0% for AGIs $75k-100k, 70.0% for AGIs $100k-200k)
Averages for the 2004 tax year for zip code 44634, filed in 2005:
Average Adjusted Gross Income (AGI) in 2004: $38,947 (Individual Income Tax Returns)
Here:
$38,947
State:
$44,480
Salary/wage: $34,651 (reported on 86.5% of returns)
Here:
$34,651
State:
$39,198
(% of AGI for various income ranges: 138.2% for AGIs below $10k, 75.7% for AGIs $10k-25k, 79.7% for AGIs $25k-50k, 85.6% for AGIs $50k-75k, 79.6% for AGIs $75k-100k, 57.9% for AGIs over 100k)
Taxable interest for individuals: $729 (reported on 48.9% of returns)
This zip code:
$729
Ohio:
$1,532
(% of AGI for various income ranges: 8.7% for AGIs below $10k, 1.7% for AGIs $10k-25k, 0.8% for AGIs $25k-50k, 1.0% for AGIs $50k-75k, 0.2% for AGIs $75k-100k, 0.6% for AGIs over 100k)
Taxable dividends: $1,867 (reported on 25.9% of returns)
Here:
$1,867
State:
$3,496
(% of AGI for various income ranges: 5.5% for AGIs below $10k, 1.3% for AGIs $10k-25k, 1.8% for AGIs $25k-50k, 0.9% for AGIs $50k-75k, 0.6% for AGIs $75k-100k, 1.1% for AGIs over 100k)
Net capital gain/loss: +$7,392 (reported on 22.7% of returns)
Here:
+$7,392
State:
+$8,582
(% of AGI for various income ranges: -2.0% for AGIs below $10k, 0.9% for AGIs $10k-25k, 1.4% for AGIs $25k-50k, 1.7% for AGIs $50k-75k, 5.0% for AGIs $75k-100k, 13.2% for AGIs over 100k)
Profit/loss from business: +$7,355 (reported on 16.2% of returns)
Here:
+$7,355
State:
+$10,813
(% of AGI for various income ranges: 6.1% for AGIs below $10k, 2.9% for AGIs $10k-25k, 2.9% for AGIs $25k-50k, 1.9% for AGIs $50k-75k, 0.2% for AGIs $75k-100k, 6.7% for AGIs over 100k)
IRA payment deduction: $2,595 (reported on 4.0% of returns)
44634:
$2,595
Ohio:
$2,794
Total itemized deductions: $13,885 (19% of AGI, reported on 26.7% of returns)
Here:
$13,885
State:
$17,503
Here:
19.4% of AGI
State:
20.8% of AGI
(% of AGI for various income ranges: 6.7% for AGIs $10k-25k, 6.8% for AGIs $25k-50k, 10.0% for AGIs $50k-75k, 15.0% for AGIs $75k-100k, 10.9% for AGIs over 100k)
Charity contributions deductions: $2,660 (3% of AGI, reported on 20.6% of returns)
Here:
$2,660
State:
$3,087
Here:
3.4% of AGI
State:
3.4% of AGI
(% of AGI for various income ranges: 0.6% for AGIs $10k-25k, 0.8% for AGIs $25k-50k, 1.3% for AGIs $50k-75k, 2.0% for AGIs $75k-100k, 2.4% for AGIs over 100k)
Total tax: $4,743 (reported on 76.4% of returns)
44634:
$4,743
State:
$6,781
(% of AGI for various income ranges: 4.5% for AGIs below $10k, 4.5% for AGIs $10k-25k, 6.6% for AGIs $25k-50k, 8.3% for AGIs $50k-75k, 9.6% for AGIs $75k-100k, 17.0% for AGIs over 100k)
Earned income credit: $1,716 (reported on 10.5% of returns)
Here:
$1,716
State:
$1,696
Percentage of individuals using paid preparers for their 2004 taxes: 64.0%
Here:
64%
State:
55%
(% for various income ranges: 54.3% for AGIs below $10k, 63.7% for AGIs $10k-25k, 64.3% for AGIs $25k-50k, 67.7% for AGIs $50k-75k, 77.9% for AGIs $75k-100k, 67.3% for AGIs over 100k)
Household received Food Stamps/SNAP in the past 12 months: 28 Household did not receive Food Stamps/SNAP in the past 12 months: 852
Women who had a birth in the past 12 months: 13 (0 now married, 13 unmarried) Women who did not have a birth in the past 12 months: 320 (154 now married, 166 unmarried)
Housing units in zip code 44634 with a mortgage: 355 (29 second mortgage, 30 both second mortgage and home equity loan) Median monthly owner costs for units with a mortgage: $912 Median monthly owner costs for units without a mortgage: $383
Residents with income below the poverty level in 2022:
This zip code:
4.3%
Whole state:
13.4%
Residents with income below 50% of the poverty level in 2022:
This zip code:
0.6%
Whole state:
7.0%
Median number of rooms in houses and condos:
Here:
6.3
State:
6.7
Median number of rooms in apartments:
Here:
4.9
State:
4.4
Notable locations in this zip code not listed on our city pages
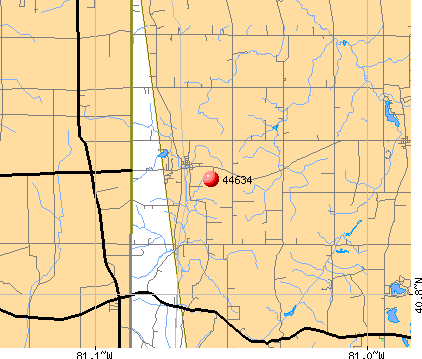
Notable locations in zip code 44634: Crist Dairy Farm (A), North Georgetown Volunteer Fire Department (B), Homeworth Volunteer Fire Department (C). Display/hide their locations on the map
In group quarters: 10 (-1 institutionalized population)
Size of family households: 377 2-persons, 55 3-persons, 44 4-persons, 34 5-persons, 8 6-persons, 7 7-or-more-persons
Size of nonfamily households: 307 1-person, 38 2-persons, 13 4-persons
148 married couples with children.
27 single-parent households (16 men, 11 women).
97.4% of residents of 44634 zip code speak English at home.
2.7% of residents speak other Indo-European language at home (100% not well).
Foreign born population: 0 (0.0%)
:
0.0%
Whole state:
5.0%
29%American
24%English
16%German
8%Austrian
6%Irish
5%Russian
3%Swiss
Housing units lacking complete plumbing facilities: 0.8% Housing units lacking complete kitchen facilities: 1.2%
60.4%Utility gas
23.0%Electricity
9.1%Bottled, tank, or LP gas
3.6%Other fuel
2.2%Fuel oil, kerosene, etc.
1.0%Wood
0.9%No fuel used
Population in 1990: 3,400.
Place of birth for U.S.-born residents:
This state: 1,737
Northeast: 35
Midwest: 27
South: 67
West: 12
78% of the 44634 zip code residents lived in the same house 5 years ago. Out of people who lived in different houses, 45% lived in this county. Out of people who lived in different counties, 50% lived in Ohio.
97% of the 44634 zip code residents lived in the same house 1 year ago. Out of people who lived in different houses, 73% moved from this county. Out of people who lived in different houses, 37% moved from different county within same state.
Private vs. public school enrollment:
Students in private schools in grades 1 to 8 (elementary and middle school):
Here:
0.0%
Ohio:
16.0%
Students in private schools in grades 9 to 12 (high school): 3
Here:
5.1%
Ohio:
13.1%
Students in private undergraduate colleges:
Here:
0.0%
Ohio:
22.3%
Occupation by median earnings in the past 12 months ($)
83,543Management occupations
72,908Architecture and engineering occupations
69,471Construction and extraction occupations
64,619Installation, maintenance, and repair occupations
51,650Production occupations
42,163Office and administrative support occupations
Top industries in this zip code by the number of employees in 2005:
Other Services (except Public Administration): Religious Organizations (5-9 employees: 2 establishments, 1-4 employees: 2 establishments)
Administrative and Support and Waste Management and Remediation Services: Janitorial Services (10-19: 1)
Wholesale Trade: Industrial Machinery and Equipment Merchant Wholesalers (10-19: 1)
Health Care and Social Assistance: Homes for the Elderly (5-9: 1)
People in group quarters in 2010:
10 people in group homes intended for adults
People in group quarters in 2000:
15 people in nursing homes
13 people in other noninstitutional group quarters
Fatal accident statistics in 2012:
Fatal accident count: 1
Vehicles involved in fatal accidents: 2
Fatal accidents caused by drunken drivers: 0
Fatalities: 1
Persons involved in fatal accidents: 2
Pedestrians involved in fatal accidents: 0
Home Mortgage Disclosure Act Aggregated Statistics For Year 2003 (Based on 2 partial tracts)
A) FHA, FSA/RHS & VA Home Purchase Loans
B) Conventional Home Purchase Loans
C) Refinancings
D) Home Improvement Loans
F) Non-occupant Loans on < 5 Family Dwellings (A B C & D)
Number
Average Value
Number
Average Value
Number
Average Value
Number
Average Value
Number
Average Value
LOANS ORIGINATED
3
$113,233
33
$99,660
134
$94,278
11
$36,380
4
$95,938
APPLICATIONS APPROVED, NOT ACCEPTED
0
$0
4
$54,688
31
$92,145
3
$26,630
0
$0
APPLICATIONS DENIED
0
$0
9
$85,527
57
$93,495
4
$41,062
2
$104,525
APPLICATIONS WITHDRAWN
0
$0
6
$94,818
39
$120,260
1
$43,300
1
$123,190
FILES CLOSED FOR INCOMPLETENESS
0
$0
1
$171,720
5
$104,076
1
$8,960
0
$0
Aggregated Statistics For Year 2002 (Based on 2 partial tracts)
A) FHA, FSA/RHS & VA Home Purchase Loans
B) Conventional Home Purchase Loans
C) Refinancings
D) Home Improvement Loans
F) Non-occupant Loans on < 5 Family Dwellings (A B C & D)
Number
Average Value
Number
Average Value
Number
Average Value
Number
Average Value
Number
Average Value
LOANS ORIGINATED
4
$113,858
27
$82,403
110
$92,687
7
$21,224
2
$73,915
APPLICATIONS APPROVED, NOT ACCEPTED
0
$0
2
$76,155
27
$102,063
1
$22,400
1
$229,950
APPLICATIONS DENIED
0
$0
6
$55,000
54
$93,712
6
$17,918
1
$126,920
APPLICATIONS WITHDRAWN
0
$0
4
$60,288
31
$109,389
1
$11,200
0
$0
FILES CLOSED FOR INCOMPLETENESS
0
$0
2
$82,125
7
$107,937
0
$0
0
$0
Aggregated Statistics For Year 2001 (Based on 2 partial tracts)
A) FHA, FSA/RHS & VA Home Purchase Loans
B) Conventional Home Purchase Loans
C) Refinancings
D) Home Improvement Loans
F) Non-occupant Loans on < 5 Family Dwellings (A B C & D)
Number
Average Value
Number
Average Value
Number
Average Value
Number
Average Value
Number
Average Value
LOANS ORIGINATED
9
$92,828
15
$80,583
90
$86,348
10
$17,545
4
$91,085
APPLICATIONS APPROVED, NOT ACCEPTED
0
$0
6
$99,672
22
$94,343
0
$0
0
$0
APPLICATIONS DENIED
0
$0
7
$94,499
50
$98,686
9
$11,116
1
$23,140
APPLICATIONS WITHDRAWN
0
$0
3
$122,940
40
$98,626
3
$25,883
0
$0
FILES CLOSED FOR INCOMPLETENESS
0
$0
0
$0
6
$124,060
0
$0
0
$0
Aggregated Statistics For Year 2000 (Based on 2 partial tracts)
A) FHA, FSA/RHS & VA Home Purchase Loans
B) Conventional Home Purchase Loans
C) Refinancings
D) Home Improvement Loans
F) Non-occupant Loans on < 5 Family Dwellings (A B C & D)
Number
Average Value
Number
Average Value
Number
Average Value
Number
Average Value
Number
Average Value
LOANS ORIGINATED
4
$88,472
25
$90,189
43
$75,337
14
$17,705
0
$0
APPLICATIONS APPROVED, NOT ACCEPTED
0
$0
7
$67,620
12
$61,407
4
$23,145
1
$101,540
APPLICATIONS DENIED
1
$42,560
8
$64,114
28
$77,833
3
$15,180
0
$0
APPLICATIONS WITHDRAWN
0
$0
0
$0
16
$72,700
0
$0
0
$0
FILES CLOSED FOR INCOMPLETENESS
0
$0
1
$89,590
1
$120,200
0
$0
0
$0
Aggregated Statistics For Year 1999 (Based on 1 partial tract)
A) FHA, FSA/RHS & VA Home Purchase Loans
B) Conventional Home Purchase Loans
C) Refinancings
D) Home Improvement Loans
F) Non-occupant Loans on < 5 Family Dwellings (A B C & D)
Detailed PMIC statistics for the following Tracts:9509.00
2002 - 2018 National Fire Incident Reporting System (NFIRS) incidents
According to the data from the years 2002 - 2018 the average number of fire incidents per year is 14. The highest number of reported fire incidents - 35 took place in 2008, and the least - 4 in 2004. The data has a rising trend.
When looking into fire subcategories, the most reports belonged to: Structure Fires (56.0%), and Outside Fires (33.7%).
Fire incident types reported to NFIRS in Zip Code 44634


 Nearest zip codes: 44672, 44625, 44609, 44657, 44669, 44601.


 According to the data from the years 2002 - 2018 the average number of fire incidents per year is 14. The highest number of reported fire incidents - 35 took place in 2008, and the least - 4 in 2004. The data has a rising trend.
 When looking into fire subcategories, the most reports belonged to: Structure Fires (56.0%), and Outside Fires (33.7%).