Estimated zip code population in 2022: 3,619 Zip code population in 2010: 3,739 Zip code population in 2000: 3,621
Houses and condos: 1,571 Renter-occupied apartments: 264
% of renters here:
18%
State:
33%
March 2022 cost of living index in zip code 44847: 83.4 (less than average, U.S. average is 100)
Land area: 70.1 sq. mi. Water area: 0.3 sq. mi.
Population density: 52 people per square mile
(very low).
OSM Map
General Map
Google Map
MSN Map
OSM Map
General Map
Google Map
MSN Map
OSM Map
General Map
Google Map
MSN Map
OSM Map
General Map
Google Map
MSN Map
Please wait while loading the map...
Real estate property taxes paid for housing units in 2022:
This zip code:
1.0% ($1,819)
Ohio:
1.3% ($2,639)
Median real estate property taxes paid for housing units with mortgages in 2022: $2,129 (1.2%) Median real estate property taxes paid for housing units with no mortgage in 2022: $1,574 (1.0%)
Business Search- 14 Million verified businesses
Males: 1,882
(52.0%)
Females: 1,736
(48.0%)
For population 25 years and over in 44847:
High school or higher: 95.7%
Bachelor's degree or higher: 14.3%
Graduate or professional degree: 3.7%
Unemployed: 1.9%
Mean travel time to work (commute): 20.9 minutes
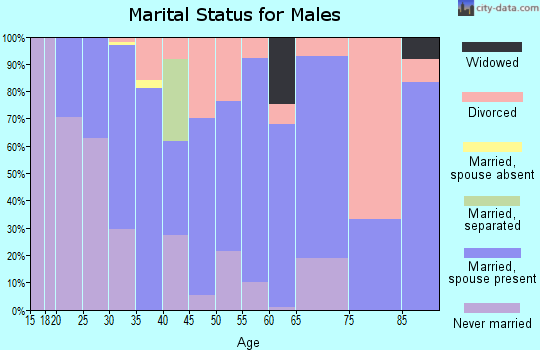
For population 15 years and over in 44847:
Never married: 24.1%
Now married: 61.3%
Separated: 1.7%
Widowed: 6.8%
Divorced: 6.1%
Zip code 44847 compared to state average:
Unemployed percentage below state average.
Black race population percentage significantly below state average.
Hispanic race population percentage significantly below state average.
Foreign-born population percentage significantly below state average.
Renting percentage below state average.
Length of stay since moving in significantly above state average.
House age above state average.
Percentage of population with a bachelor's degree or higher below state average.
Estimated median house/condo value in 2022: $173,591
44847:
$173,591
Ohio:
$204,100
According to our research of Ohio and other state lists, there were 6 registered sex offenders living in 44847 zip code as of May 28, 2024. The ratio of all residents to sex offenders in zip code 44847 is 645 to 1. The ratio of registered sex offenders to all residents in this zip code is near the state average.
Median resident age:
This zip code:
40.2 years
Ohio median age:
39.9 years
Average household size:
This zip code:
2.5 people
Ohio:
2.4 people
Averages for the 2020 tax year for zip code 44847, filed in 2021:
Average Adjusted Gross Income (AGI) in 2020: $56,260 (Individual Income Tax Returns)
Here:
$56,260
State:
$67,288
Salary/wage: $47,115 (reported on 81.8% of returns)
Here:
$47,115
State:
$55,628
(% of AGI for various income ranges: 1125.4% for AGIs below $25k, 3569.2% for AGIs $25k-50k, 6550.8% for AGIs $50k-75k, 9156.7% for AGIs $75k-100k, 16010.0% for AGIs $100k-200k)
Taxable interest for individuals: $775 (reported on 30.4% of returns)
This zip code:
$775
Ohio:
$1,518
(% of AGI for various income ranges: 16.3% for AGIs below $25k, 14.9% for AGIs $25k-50k, 33.8% for AGIs $50k-75k, 41.3% for AGIs $75k-100k, 59.3% for AGIs $100k-200k)
Ordinary dividends: $2,497 (reported on 20.4% of returns)
Here:
$2,497
State:
$7,167
(% of AGI for various income ranges: 29.7% for AGIs below $25k, 36.9% for AGIs $25k-50k, 54.6% for AGIs $50k-75k, 72.7% for AGIs $75k-100k, 311.4% for AGIs $100k-200k)
Net capital gain/loss in AGI: +$6,775 (reported on 17.7% of returns)
Here:
+$6,775
State:
+$18,919
(% of AGI for various income ranges: 18.6% for AGIs below $25k, 23.8% for AGIs $25k-50k, 69.6% for AGIs $50k-75k, 83.3% for AGIs $75k-100k, 1227.1% for AGIs $100k-200k)
Profit/loss from business: +$8,378 (reported on 9.9% of returns)
Here:
+$8,378
State:
+$13,744
(% of AGI for various income ranges: 41.1% for AGIs below $25k, 87.7% for AGIs $25k-50k, 94.6% for AGIs $50k-75k, 106.7% for AGIs $75k-100k, 453.6% for AGIs $100k-200k)
Taxable individual retirement arrangement distribution: $13,752 (reported on 11.6% of returns)
44847:
$13,752
Ohio:
$18,876
(% of AGI for various income ranges: 83.7% for AGIs below $25k, 156.7% for AGIs $25k-50k, 191.2% for AGIs $50k-75k, 261.3% for AGIs $75k-100k, 809.3% for AGIs $100k-200k)
Total itemized deductions: $24,400 (reported on 2.2% of returns)
Here:
$24,400
State:
$33,869
(% of AGI for various income ranges: 650.7% for AGIs $75k-100k)
Charity contributions: $4,200 (reported on 1.1% of returns)
Here:
$4,200
State:
$14,577
(% of AGI for various income ranges: 21.5% for AGIs $25k-50k)
Taxes paid: $5,525 (reported on 2.2% of returns)
44847:
$5,525
State:
$7,681
(% of AGI for various income ranges: 147.3% for AGIs $75k-100k)
Earned income credit: $1,890 (reported on 11.0% of returns)
Here:
$1,890
State:
$2,304
(% of AGI for various income ranges: 51.4% for AGIs below $25k, 50.8% for AGIs $25k-50k)
Percentage of individuals using paid preparers for their 2020 taxes: 94.5%
Here:
94%
State:
94%
(% for various income ranges: 92.0% for AGIs below $25k, 94.2% for AGIs $25k-50k, 97.1% for AGIs $50k-75k, 95.2% for AGIs $75k-100k, 95.5% for AGIs $100k-200k, 100.0% for AGIs over 200k)
Averages for the 2012 tax year for zip code 44847, filed in 2013:
Average Adjusted Gross Income (AGI) in 2012: $45,311 (Individual Income Tax Returns)
Here:
$45,311
State:
$54,926
Salary/wage: $38,783 (reported on 85.6% of returns)
Here:
$38,783
State:
$45,869
(% of AGI for various income ranges: 72.0% for AGIs below $25k, 79.7% for AGIs $25k-50k, 77.1% for AGIs $50k-75k, 77.4% for AGIs $75k-100k, 59.5% for AGIs $100k-200k)
Taxable interest for individuals: $618 (reported on 32.4% of returns)
This zip code:
$618
Ohio:
$1,297
(% of AGI for various income ranges: 1.4% for AGIs below $25k, 0.4% for AGIs $25k-50k, 0.2% for AGIs $50k-75k, 0.2% for AGIs $75k-100k, 0.6% for AGIs $100k-200k)
Ordinary dividends: $2,371 (reported on 20.2% of returns)
Here:
$2,371
State:
$5,821
(% of AGI for various income ranges: 1.3% for AGIs below $25k, 0.9% for AGIs $25k-50k, 0.4% for AGIs $50k-75k, 0.6% for AGIs $75k-100k, 2.2% for AGIs $100k-200k)
Net capital gain/loss in AGI: +$2,729 (reported on 12.8% of returns)
Here:
+$2,729
State:
+$11,232
(% of AGI for various income ranges: 0.2% for AGIs $25k-50k, 0.2% for AGIs $50k-75k, 0.7% for AGIs $75k-100k, 2.8% for AGIs $100k-200k)
Profit/loss from business: +$8,555 (reported on 10.6% of returns)
Here:
+$8,555
State:
+$12,773
(% of AGI for various income ranges: 4.3% for AGIs below $25k, 1.5% for AGIs $25k-50k, 3.6% for AGIs $50k-75k, 1.8% for AGIs $75k-100k)
Taxable individual retirement arrangement distribution: $8,232 (reported on 10.1% of returns)
44847:
$8,232
Ohio:
$14,511
(% of AGI for various income ranges: 3.0% for AGIs below $25k, 1.9% for AGIs $25k-50k, 1.6% for AGIs $50k-75k, 3.4% for AGIs $75k-100k)
Total itemized deductions: $15,809 (21% of AGI, reported on 22.9% of returns)
Here:
$15,809
State:
$21,278
Here:
21.2% of AGI
State:
18.8% of AGI
(% of AGI for various income ranges: 7.2% for AGIs below $25k, 5.4% for AGIs $25k-50k, 8.3% for AGIs $50k-75k, 8.1% for AGIs $75k-100k, 10.5% for AGIs $100k-200k)
Charity contributions: $2,487 (reported on 16.5% of returns)
Here:
$2,487
State:
$3,943
(% of AGI for various income ranges: 0.5% for AGIs below $25k, 0.6% for AGIs $25k-50k, 1.0% for AGIs $50k-75k, 0.7% for AGIs $75k-100k, 1.5% for AGIs $100k-200k)
Taxes paid: $5,819 (reported on 22.3% of returns)
44847:
$5,819
State:
$9,568
(% of AGI for various income ranges: 1.3% for AGIs below $25k, 1.5% for AGIs $25k-50k, 2.7% for AGIs $50k-75k, 3.2% for AGIs $75k-100k, 4.8% for AGIs $100k-200k)
Earned income credit: $2,068 (reported on 13.3% of returns)
Here:
$2,068
State:
$2,285
(% of AGI for various income ranges: 4.1% for AGIs below $25k, 0.8% for AGIs $25k-50k)
Percentage of individuals using paid preparers for their 2012 taxes: 63.3%
Here:
63%
State:
51%
(% for various income ranges: 53.5% for AGIs below $25k, 65.3% for AGIs $25k-50k, 69.7% for AGIs $50k-75k, 72.7% for AGIs $75k-100k, 76.9% for AGIs $100k-200k)
Averages for the 2004 tax year for zip code 44847, filed in 2005:
Average Adjusted Gross Income (AGI) in 2004: $36,356 (Individual Income Tax Returns)
Here:
$36,356
State:
$44,480
Salary/wage: $33,645 (reported on 89.8% of returns)
Here:
$33,645
State:
$39,198
(% of AGI for various income ranges: 140.8% for AGIs below $10k, 75.6% for AGIs $10k-25k, 86.1% for AGIs $25k-50k, 87.8% for AGIs $50k-75k, 91.3% for AGIs $75k-100k, 53.0% for AGIs over 100k)
Taxable interest for individuals: $964 (reported on 47.4% of returns)
This zip code:
$964
Ohio:
$1,532
(% of AGI for various income ranges: 5.4% for AGIs below $10k, 2.3% for AGIs $10k-25k, 0.9% for AGIs $25k-50k, 0.9% for AGIs $50k-75k, 0.4% for AGIs $75k-100k, 2.6% for AGIs over 100k)
Taxable dividends: $1,666 (reported on 24.5% of returns)
Here:
$1,666
State:
$3,496
(% of AGI for various income ranges: 2.3% for AGIs below $10k, 1.3% for AGIs $10k-25k, 0.6% for AGIs $25k-50k, 0.5% for AGIs $50k-75k, 0.1% for AGIs $75k-100k, 4.9% for AGIs over 100k)
Net capital gain/loss: +$2,643 (reported on 15.2% of returns)
Here:
+$2,643
State:
+$8,582
(% of AGI for various income ranges: -1.9% for AGIs below $10k, -0.1% for AGIs $10k-25k, 0.4% for AGIs $25k-50k, 1.2% for AGIs $50k-75k, 1.5% for AGIs $75k-100k, 3.6% for AGIs over 100k)
Profit/loss from business: +$6,130 (reported on 10.2% of returns)
Here:
+$6,130
State:
+$10,813
(% of AGI for various income ranges: -1.5% for AGIs below $10k, 1.9% for AGIs $10k-25k, 2.8% for AGIs $25k-50k, 2.0% for AGIs $50k-75k, 0.6% for AGIs $75k-100k)
Profit/loss from farming: +$2,107 (reported on 3.7% of returns)
Here:
+$2,107
State:
-$3,706
(% of AGI for various income ranges: -5.2% for AGIs below $10k, -1.1% for AGIs $10k-25k, 0.9% for AGIs $25k-50k, 0.5% for AGIs $50k-75k)
IRA payment deduction: $2,643 (reported on 2.1% of returns)
44847:
$2,643
Ohio:
$2,794
Total itemized deductions: $13,451 (22% of AGI, reported on 25.8% of returns)
Here:
$13,451
State:
$17,503
Here:
22.0% of AGI
State:
20.8% of AGI
(% of AGI for various income ranges: 6.7% for AGIs below $10k, 7.5% for AGIs $10k-25k, 7.2% for AGIs $25k-50k, 9.7% for AGIs $50k-75k, 11.5% for AGIs $75k-100k, 15.0% for AGIs over 100k)
Charity contributions deductions: $2,441 (4% of AGI, reported on 18.3% of returns)
Here:
$2,441
State:
$3,087
Here:
3.6% of AGI
State:
3.4% of AGI
(% of AGI for various income ranges: 0.8% for AGIs $10k-25k, 0.5% for AGIs $25k-50k, 0.9% for AGIs $50k-75k, 1.2% for AGIs $75k-100k, 4.4% for AGIs over 100k)
Total tax: $4,027 (reported on 78.9% of returns)
44847:
$4,027
State:
$6,781
(% of AGI for various income ranges: 4.4% for AGIs below $10k, 4.4% for AGIs $10k-25k, 7.4% for AGIs $25k-50k, 8.2% for AGIs $50k-75k, 10.1% for AGIs $75k-100k, 16.3% for AGIs over 100k)
Earned income credit: $1,526 (reported on 9.6% of returns)
Here:
$1,526
State:
$1,696
Percentage of individuals using paid preparers for their 2004 taxes: 61.2%
Here:
61%
State:
55%
(% for various income ranges: 41.2% for AGIs below $10k, 61.3% for AGIs $10k-25k, 70.0% for AGIs $25k-50k, 64.8% for AGIs $50k-75k, 63.2% for AGIs $75k-100k, 71.0% for AGIs over 100k)
Household received Food Stamps/SNAP in the past 12 months: 81 Household did not receive Food Stamps/SNAP in the past 12 months: 1,365
Women who had a birth in the past 12 months: 89 (87 now married, 3 unmarried) Women who did not have a birth in the past 12 months: 555 (246 now married, 309 unmarried)
Housing units in zip code 44847 with a mortgage: 580 (97 second mortgage, 15 home equity loan, 84 both second mortgage and home equity loan) Houses without a mortgage: 113
Median monthly owner costs for units with a mortgage: $1,158 Median monthly owner costs for units without a mortgage: $409
Residents with income below the poverty level in 2022:
This zip code:
4.7%
Whole state:
13.4%
Residents with income below 50% of the poverty level in 2022:
This zip code:
1.7%
Whole state:
7.0%
Median number of rooms in houses and condos:
Here:
7.3
State:
6.7
Median number of rooms in apartments:
Here:
5.7
State:
4.4
Notable locations in this zip code not listed on our city pages
Notable locations in zip code 44847: Star View Drive-In (A), Huron River Joint Fire District (B), Monroeville Public Library (C). Display/hide their locations on the map
Churches in zip code 44847 include: Saint Johns Church (A), Saint Peters Church (B), Zion Episcopal Church (C), Saint Josephs Catholic Church (D), Trinity Lutheran Church (E), Saint Johns Church (F). Display/hide their locations on the map
Cemeteries: Saint Joseph Cemetery (1), Pontiac Cemetery (2), Peru Center Cemetery (3), North Monroeville Cemetery (4), Heyman Cemetery (5), Lyme Cemetery (6), Riverside Cemetery (7). Display/hide their locations on the map
Streams, rivers, and creeks: Megginson Creek (A), Frink Run (B), Seymour Creek (C), Sandhill Creek (D), Slate Run (E). Display/hide their locations on the map
Size of family households: 552 2-persons, 195 3-persons, 217 4-persons, 93 5-persons, 11 6-persons
Size of nonfamily households: 337 1-person, 35 2-persons
459 married couples with children.
356 single-parent households (223 men, 133 women).
98.1% of residents of 44847 zip code speak English at home.
1.0% of residents speak Spanish at home (100% very well).
0.1% of residents speak other Indo-European language at home (100% very well).
0.6% of residents speak other language at home (100% very well).
Foreign born population: 16 (0.4%) (19.0% of them are naturalized citizens)
This zip code:
0.4%
Whole state:
5.0%
75%El Salvador
19%Argentina
51%German
17%English
17%American
3%European
2%Italian
2%Polish
1%Slovak
Year of entry for the foreign-born population
02010 or later
62000 to 2009
01990 to 1999
14Before 1990
Facilities with environmental interests located in this zip code:
ALLTEL - PROUT (9217 RANSON RD in MONROEVILLE, OH)
(Integrated Compliance Information System) - ICIS-HQ-2000-6004, FORMAL ENFORCEMENT ACTION
Housing units lacking complete plumbing facilities: 0.9% Housing units lacking complete kitchen facilities: 1.3%
45.3%Utility gas
19.8%Electricity
19.2%Bottled, tank, or LP gas
6.6%Other fuel
5.0%Wood
4.2%Fuel oil, kerosene, etc.
Population in 1990: 2,721. Population change in the 1990s: +900 (+33.1%).
Place of birth for U.S.-born residents:
This state: 3,162
Northeast: 85
Midwest: 169
South: 108
West: 66
71% of the 44847 zip code residents lived in the same house 5 years ago. Out of people who lived in different houses, 72% lived in this county. Out of people who lived in different counties, 50% lived in Ohio.
98% of the 44847 zip code residents lived in the same house 1 year ago. Out of people who lived in different houses, 66% moved from this county. Out of people who lived in different houses, 29% moved from different county within same state. Out of people who lived in different houses, 29% moved from different state.
Private vs. public school enrollment:
Students in private schools in grades 1 to 8 (elementary and middle school): 34
Here:
8.5%
Ohio:
16.0%
Students in private schools in grades 9 to 12 (high school): 2
Here:
1.4%
Ohio:
13.1%
Students in private undergraduate colleges: 14
Here:
9.3%
Ohio:
22.3%
Occupation by median earnings in the past 12 months ($)
131,710Health diagnosing and treating practitioners and other technical occupations
74,625Business and financial operations occupations
72,261Management occupations
64,437Production occupations
64,278Material moving occupations
60,785Installation, maintenance, and repair occupations
Companies with federal contracts located in this zip code:
BOHN IMPLEMENT CO (13 FORT MONROE PKWY in MONROEVILLE, OH; small business)
$39,450 with Army for Gardening Implements and Tools. Signed on 2005-09-29. Completion date: 2005-09-30.
Top industries in this zip code by the number of employees in 2005:
Construction: Commercial and Institutional Building Construction (100-249 employees: 1 establishment, 10-19 employees: 1 establishment)
Construction: Water and Sewer Line and Related Structures Construction (50-99: 1, 10-19: 1, 5-9: 1)
Accommodation and Food Services: Full-Service Restaurants (20-49: 1, 1-4: 1)
Wholesale Trade: Automobile and Other Motor Vehicle Merchant Wholesalers (20-49: 1)
People in group quarters in 2000:
5 people in religious group quarters
Fatal accident statistics in 2013:
Fatal accident count: 1
Vehicles involved in fatal accidents: 1
Fatal accidents caused by drunken drivers: 0
Fatalities: 1
Persons involved in fatal accidents: 1
Pedestrians involved in fatal accidents: 0
Fatal accident statistics in 2010:
Fatal accident count: 1
Vehicles involved in fatal accidents: 2
Fatal accidents caused by drunken drivers: 0
Fatalities: 3
Persons involved in fatal accidents: 5
Pedestrians involved in fatal accidents: 0
Home Mortgage Disclosure Act Aggregated Statistics For Year 2009 (Based on 2 partial tracts)
A) FHA, FSA/RHS & VA Home Purchase Loans
B) Conventional Home Purchase Loans
C) Refinancings
D) Home Improvement Loans
F) Non-occupant Loans on < 5 Family Dwellings (A B C & D)
G) Loans On Manufactured Home Dwelling (A B C & D)
Number
Average Value
Number
Average Value
Number
Average Value
Number
Average Value
Number
Average Value
Number
Average Value
LOANS ORIGINATED
4
$144,838
6
$178,283
41
$142,472
2
$67,015
0
$0
0
$0
APPLICATIONS APPROVED, NOT ACCEPTED
0
$0
1
$83,990
8
$140,726
1
$4,650
0
$0
0
$0
APPLICATIONS DENIED
0
$0
3
$89,827
15
$151,633
2
$51,110
1
$60,760
1
$96,500
APPLICATIONS WITHDRAWN
0
$0
0
$0
5
$187,706
0
$0
0
$0
0
$0
FILES CLOSED FOR INCOMPLETENESS
0
$0
0
$0
5
$140,244
0
$0
0
$0
0
$0
Aggregated Statistics For Year 2008 (Based on 2 partial tracts)
A) FHA, FSA/RHS & VA Home Purchase Loans
B) Conventional Home Purchase Loans
C) Refinancings
D) Home Improvement Loans
F) Non-occupant Loans on < 5 Family Dwellings (A B C & D)
G) Loans On Manufactured Home Dwelling (A B C & D)
Number
Average Value
Number
Average Value
Number
Average Value
Number
Average Value
Number
Average Value
Number
Average Value
LOANS ORIGINATED
4
$111,420
11
$145,137
20
$147,910
5
$31,880
1
$86,130
0
$0
APPLICATIONS APPROVED, NOT ACCEPTED
0
$0
3
$159,757
4
$171,462
1
$144,750
0
$0
0
$0
APPLICATIONS DENIED
2
$91,675
3
$126,163
19
$149,713
5
$69,050
2
$182,990
1
$129,020
APPLICATIONS WITHDRAWN
0
$0
3
$111,150
6
$132,773
1
$70,050
0
$0
0
$0
FILES CLOSED FOR INCOMPLETENESS
0
$0
0
$0
1
$217,660
0
$0
0
$0
0
$0
Aggregated Statistics For Year 2007 (Based on 2 partial tracts)
A) FHA, FSA/RHS & VA Home Purchase Loans
B) Conventional Home Purchase Loans
C) Refinancings
D) Home Improvement Loans
F) Non-occupant Loans on < 5 Family Dwellings (A B C & D)
G) Loans On Manufactured Home Dwelling (A B C & D)
Number
Average Value
Number
Average Value
Number
Average Value
Number
Average Value
Number
Average Value
Number
Average Value
LOANS ORIGINATED
2
$102,930
21
$120,222
28
$123,341
8
$26,581
1
$218,370
0
$0
APPLICATIONS APPROVED, NOT ACCEPTED
0
$0
4
$95,068
5
$136,598
1
$11,790
0
$0
1
$51,820
APPLICATIONS DENIED
1
$134,740
4
$107,578
25
$155,912
8
$68,800
3
$164,403
3
$94,710
APPLICATIONS WITHDRAWN
0
$0
1
$205,150
10
$128,950
1
$74,340
0
$0
0
$0
FILES CLOSED FOR INCOMPLETENESS
0
$0
0
$0
3
$162,140
0
$0
0
$0
0
$0
Aggregated Statistics For Year 2006 (Based on 2 partial tracts)
A) FHA, FSA/RHS & VA Home Purchase Loans
B) Conventional Home Purchase Loans
C) Refinancings
D) Home Improvement Loans
F) Non-occupant Loans on < 5 Family Dwellings (A B C & D)
G) Loans On Manufactured Home Dwelling (A B C & D)
Number
Average Value
Number
Average Value
Number
Average Value
Number
Average Value
Number
Average Value
Number
Average Value
LOANS ORIGINATED
2
$123,305
29
$122,847
34
$116,050
5
$30,308
3
$128,187
0
$0
APPLICATIONS APPROVED, NOT ACCEPTED
1
$135,810
3
$141,887
11
$129,216
1
$87,920
1
$153,680
1
$54,320
APPLICATIONS DENIED
0
$0
4
$77,468
25
$138,900
8
$52,315
2
$102,575
0
$0
APPLICATIONS WITHDRAWN
0
$0
2
$62,900
19
$150,541
1
$91,490
1
$149,390
0
$0
FILES CLOSED FOR INCOMPLETENESS
0
$0
0
$0
6
$110,198
0
$0
0
$0
0
$0
Aggregated Statistics For Year 2005 (Based on 2 partial tracts)
A) FHA, FSA/RHS & VA Home Purchase Loans
B) Conventional Home Purchase Loans
C) Refinancings
D) Home Improvement Loans
F) Non-occupant Loans on < 5 Family Dwellings (A B C & D)
G) Loans On Manufactured Home Dwelling (A B C & D)
Number
Average Value
Number
Average Value
Number
Average Value
Number
Average Value
Number
Average Value
Number
Average Value
LOANS ORIGINATED
1
$159,760
26
$138,644
39
$129,846
7
$54,631
4
$114,635
1
$65,050
APPLICATIONS APPROVED, NOT ACCEPTED
0
$0
1
$279,490
9
$149,353
1
$4,650
0
$0
0
$0
APPLICATIONS DENIED
0
$0
8
$107,220
30
$158,030
5
$50,608
3
$103,290
2
$96,500
APPLICATIONS WITHDRAWN
0
$0
5
$126,948
20
$147,946
3
$177,510
1
$67,910
0
$0
FILES CLOSED FOR INCOMPLETENESS
0
$0
1
$123,300
5
$138,886
1
$61,830
0
$0
0
$0
Aggregated Statistics For Year 2004 (Based on 2 partial tracts)
A) FHA, FSA/RHS & VA Home Purchase Loans
B) Conventional Home Purchase Loans
C) Refinancings
D) Home Improvement Loans
F) Non-occupant Loans on < 5 Family Dwellings (A B C & D)
G) Loans On Manufactured Home Dwelling (A B C & D)
Detailed PMIC statistics for the following Tracts:0418.00
2002 - 2018 National Fire Incident Reporting System (NFIRS) incidents
Based on the data from the years 2002 - 2018 the average number of fires per year is 12. The highest number of fires - 18 took place in 2009, and the least - 6 in 2015. The data has a growing trend.
When looking into fire subcategories, the most reports belonged to: Outside Fires (37.7%), and Structure Fires (36.3%).
Fire incident types reported to NFIRS in Zip Code 44847


+$2,107
-$3,706
(% of AGI for various income ranges: -5.2% for AGIs below $10k, -1.1% for AGIs $10k-25k, 0.9% for AGIs $25k-50k, 0.5% for AGIs $50k-75k) Nearest zip codes: 44811, 44857, 44846, 44890, 44828, 44855.


 Based on the data from the years 2002 - 2018 the average number of fires per year is 12. The highest number of fires - 18 took place in 2009, and the least - 6 in 2015. The data has a growing trend.
 When looking into fire subcategories, the most reports belonged to: Outside Fires (37.7%), and Structure Fires (36.3%).