Estimated zip code population in 2022: 2,227 Zip code population in 2010: 2,260 Zip code population in 2000: 2,248
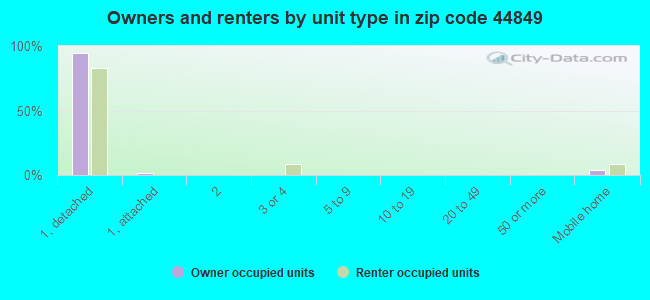
Houses and condos: 938 Renter-occupied apartments: 150
% of renters here:
17%
State:
33%
March 2022 cost of living index in zip code 44849: 82.9 (low, U.S. average is 100)
Land area: 48.7 sq. mi. Water area: 0.0 sq. mi.
Population density: 46 people per square mile
(very low).
OSM Map
General Map
Google Map
MSN Map
OSM Map
General Map
Google Map
MSN Map
OSM Map
General Map
Google Map
MSN Map
OSM Map
General Map
Google Map
MSN Map
Please wait while loading the map...
Real estate property taxes paid for housing units in 2022:
This zip code:
1.0% ($1,326)
Ohio:
1.3% ($2,639)
Median real estate property taxes paid for housing units with mortgages in 2022: $1,414 (1.0%) Median real estate property taxes paid for housing units with no mortgage in 2022: $1,253 (1.0%)
Business Search- 14 Million verified businesses
Males: 1,072
(48.1%)
Females: 1,155
(51.9%)
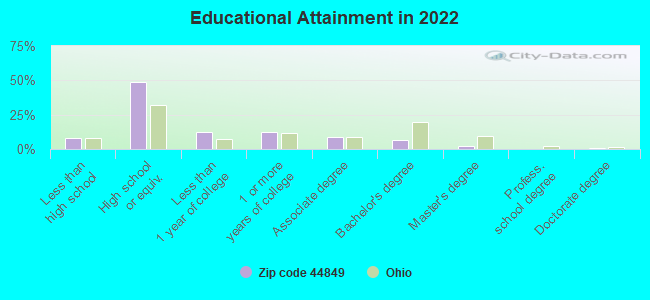
For population 25 years and over in 44849:
High school or higher: 90.4%
Bachelor's degree or higher: 9.5%
Graduate or professional degree: 3.0%
Unemployed: 0.7%
Mean travel time to work (commute): 22.6 minutes
For population 15 years and over in 44849:
Never married: 20.5%
Now married: 61.5%
Separated: 0.7%
Widowed: 6.6%
Divorced: 10.7%
Zip code 44849 compared to state average:
Unemployed percentage significantly below state average.
Black race population percentage significantly below state average.
Hispanic race population percentage below state average.
Foreign-born population percentage significantly below state average.
Renting percentage below state average.
Length of stay since moving in below state average.
Number of college students below state average.
Percentage of population with a bachelor's degree or higher significantly below state average.
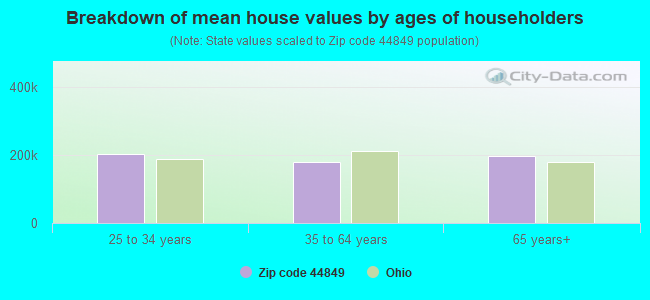
Estimated median house/condo value in 2022: $137,960
44849:
$137,960
Ohio:
$204,100
According to our research of Ohio and other state lists, there were 2 registered sex offenders living in 44849 zip code as of May 28, 2024. The ratio of all residents to sex offenders in zip code 44849 is 1,200 to 1. The ratio of registered sex offenders to all residents in this zip code is lower than the state average.
Median resident age:
This zip code:
43.4 years
Ohio median age:
39.9 years
Average household size:
This zip code:
2.6 people
Ohio:
2.4 people
Averages for the 2020 tax year for zip code 44849, filed in 2021:
Average Adjusted Gross Income (AGI) in 2020: $53,481 (Individual Income Tax Returns)
Here:
$53,481
State:
$67,288
Salary/wage: $46,074 (reported on 81.7% of returns)
Here:
$46,074
State:
$55,628
(% of AGI for various income ranges: 1145.2% for AGIs below $25k, 3770.8% for AGIs $25k-50k, 5945.8% for AGIs $50k-75k, 10011.2% for AGIs $75k-100k, 16780.0% for AGIs $100k-200k)
Taxable interest for individuals: $1,268 (reported on 25.7% of returns)
This zip code:
$1,268
Ohio:
$1,518
(% of AGI for various income ranges: 12.2% for AGIs below $25k, 22.7% for AGIs $25k-50k, 13.3% for AGIs $50k-75k, 190.0% for AGIs $75k-100k, 125.0% for AGIs $100k-200k)
Ordinary dividends: $2,950 (reported on 14.7% of returns)
Here:
$2,950
State:
$7,167
(% of AGI for various income ranges: 8.7% for AGIs below $25k, 23.8% for AGIs $25k-50k, 86.7% for AGIs $50k-75k, 176.2% for AGIs $75k-100k, 181.2% for AGIs $100k-200k)
Net capital gain/loss in AGI: +$4,793 (reported on 12.8% of returns)
Here:
+$4,793
State:
+$18,919
(% of AGI for various income ranges: 3.1% for AGIs $25k-50k, 80.8% for AGIs $50k-75k, 163.8% for AGIs $75k-100k, 543.8% for AGIs $100k-200k)
Profit/loss from business: +$9,043 (reported on 12.8% of returns)
Here:
+$9,043
State:
+$13,744
(% of AGI for various income ranges: 98.7% for AGIs below $25k, 94.6% for AGIs $25k-50k, 424.2% for AGIs $50k-75k, 355.0% for AGIs $100k-200k)
Taxable individual retirement arrangement distribution: $10,573 (reported on 10.1% of returns)
44849:
$10,573
Ohio:
$18,876
(% of AGI for various income ranges: 71.7% for AGIs below $25k, 82.3% for AGIs $25k-50k, 377.5% for AGIs $50k-75k, 413.8% for AGIs $100k-200k)
Earned income credit: $2,307 (reported on 13.8% of returns)
Here:
$2,307
State:
$2,304
(% of AGI for various income ranges: 87.0% for AGIs below $25k, 56.2% for AGIs $25k-50k)
Percentage of individuals using paid preparers for their 2020 taxes: 92.7%
Here:
93%
State:
94%
(% for various income ranges: 90.6% for AGIs below $25k, 94.1% for AGIs $25k-50k, 93.8% for AGIs $50k-75k, 92.3% for AGIs $75k-100k, 92.9% for AGIs $100k-200k)
Averages for the 2012 tax year for zip code 44849, filed in 2013:
Average Adjusted Gross Income (AGI) in 2012: $43,740 (Individual Income Tax Returns)
Here:
$43,740
State:
$54,926
Salary/wage: $36,401 (reported on 85.3% of returns)
Here:
$36,401
State:
$45,869
(% of AGI for various income ranges: 71.8% for AGIs below $25k, 78.5% for AGIs $25k-50k, 82.4% for AGIs $50k-75k, 77.8% for AGIs $75k-100k, 45.2% for AGIs $100k-200k)
Taxable interest for individuals: $828 (reported on 29.4% of returns)
This zip code:
$828
Ohio:
$1,297
(% of AGI for various income ranges: 0.8% for AGIs below $25k, 0.7% for AGIs $25k-50k, 0.6% for AGIs $50k-75k, 0.5% for AGIs $75k-100k, 0.2% for AGIs $100k-200k)
Ordinary dividends: $1,488 (reported on 15.6% of returns)
Here:
$1,488
State:
$5,821
(% of AGI for various income ranges: 0.5% for AGIs below $25k, 0.7% for AGIs $25k-50k, 0.1% for AGIs $50k-75k, 0.6% for AGIs $75k-100k, 0.7% for AGIs $100k-200k)
Net capital gain/loss in AGI: +$3,582 (reported on 10.1% of returns)
Here:
+$3,582
State:
+$11,232
(% of AGI for various income ranges: 0.2% for AGIs $25k-50k, 5.1% for AGIs $75k-100k)
Profit/loss from business: +$5,743 (reported on 12.8% of returns)
Here:
+$5,743
State:
+$12,773
(% of AGI for various income ranges: 4.2% for AGIs below $25k, 2.7% for AGIs $25k-50k, 1.9% for AGIs $50k-75k)
Taxable individual retirement arrangement distribution: $6,718 (reported on 10.1% of returns)
44849:
$6,718
Ohio:
$14,511
(% of AGI for various income ranges: 3.8% for AGIs below $25k, 2.3% for AGIs $25k-50k, 3.2% for AGIs $75k-100k)
Total itemized deductions: $13,653 (16% of AGI, reported on 17.4% of returns)
Here:
$13,653
State:
$21,278
Here:
16.0% of AGI
State:
18.8% of AGI
(% of AGI for various income ranges: 4.7% for AGIs $25k-50k, 5.6% for AGIs $50k-75k, 6.6% for AGIs $75k-100k, 8.1% for AGIs $100k-200k)
Charity contributions: $3,218 (reported on 10.1% of returns)
Here:
$3,218
State:
$3,943
(% of AGI for various income ranges: 0.7% for AGIs $25k-50k, 1.1% for AGIs $50k-75k, 1.3% for AGIs $100k-200k)
Taxes paid: $4,816 (reported on 17.4% of returns)
44849:
$4,816
State:
$9,568
(% of AGI for various income ranges: 1.0% for AGIs $25k-50k, 1.7% for AGIs $50k-75k, 2.4% for AGIs $75k-100k, 4.0% for AGIs $100k-200k)
Earned income credit: $2,076 (reported on 15.6% of returns)
Here:
$2,076
State:
$2,285
(% of AGI for various income ranges: 4.6% for AGIs below $25k, 0.8% for AGIs $25k-50k)
Percentage of individuals using paid preparers for their 2012 taxes: 58.7%
Here:
59%
State:
51%
(% for various income ranges: 50.0% for AGIs below $25k, 64.9% for AGIs $25k-50k, 61.1% for AGIs $50k-75k, 62.5% for AGIs $75k-100k, 66.7% for AGIs $100k-200k)
Averages for the 2004 tax year for zip code 44849, filed in 2005:
Average Adjusted Gross Income (AGI) in 2004: $34,201 (Individual Income Tax Returns)
Here:
$34,201
State:
$44,480
Salary/wage: $31,096 (reported on 88.0% of returns)
Here:
$31,096
State:
$39,198
(% of AGI for various income ranges: 91.9% for AGIs below $10k, 75.5% for AGIs $10k-25k, 86.8% for AGIs $25k-50k, 83.9% for AGIs $50k-75k, 75.0% for AGIs $75k-100k, 49.5% for AGIs over 100k)
Taxable interest for individuals: $1,253 (reported on 41.2% of returns)
This zip code:
$1,253
Ohio:
$1,532
(% of AGI for various income ranges: 3.2% for AGIs below $10k, 2.4% for AGIs $10k-25k, 1.3% for AGIs $25k-50k, 1.7% for AGIs $50k-75k, 0.6% for AGIs $75k-100k, 1.6% for AGIs over 100k)
Taxable dividends: $804 (reported on 19.5% of returns)
Here:
$804
State:
$3,496
(% of AGI for various income ranges: 0.7% for AGIs below $10k, 0.7% for AGIs $10k-25k, 0.4% for AGIs $25k-50k, 0.4% for AGIs $50k-75k, 0.4% for AGIs $75k-100k, 0.5% for AGIs over 100k)
Net capital gain/loss: +$3,804 (reported on 12.7% of returns)
Here:
+$3,804
State:
+$8,582
(% of AGI for various income ranges: 1.3% for AGIs $10k-25k, 0.4% for AGIs $25k-50k, 2.9% for AGIs $50k-75k, 1.8% for AGIs $75k-100k, 1.7% for AGIs over 100k)
Profit/loss from business: +$6,095 (reported on 13.1% of returns)
Here:
+$6,095
State:
+$10,813
(% of AGI for various income ranges: 2.9% for AGIs below $10k, 2.9% for AGIs $10k-25k, 1.3% for AGIs $25k-50k, 2.7% for AGIs $50k-75k, 5.1% for AGIs $75k-100k)
IRA payment deduction: $2,348 (reported on 2.0% of returns)
44849:
$2,348
Ohio:
$2,794
Total itemized deductions: $12,071 (22% of AGI, reported on 17.6% of returns)
Here:
$12,071
State:
$17,503
Here:
21.8% of AGI
State:
20.8% of AGI
(% of AGI for various income ranges: 4.2% for AGIs $10k-25k, 5.4% for AGIs $25k-50k, 7.4% for AGIs $50k-75k, 6.4% for AGIs $75k-100k, 11.1% for AGIs over 100k)
Charity contributions deductions: $2,240 (4% of AGI, reported on 11.5% of returns)
Here:
$2,240
State:
$3,087
Here:
3.7% of AGI
State:
3.4% of AGI
(% of AGI for various income ranges: 0.7% for AGIs $10k-25k, 0.6% for AGIs $25k-50k, 0.8% for AGIs $50k-75k, 0.8% for AGIs $75k-100k, 1.7% for AGIs over 100k)
Total tax: $3,570 (reported on 78.4% of returns)
44849:
$3,570
State:
$6,781
(% of AGI for various income ranges: 2.4% for AGIs below $10k, 4.4% for AGIs $10k-25k, 7.0% for AGIs $25k-50k, 8.3% for AGIs $50k-75k, 11.1% for AGIs $75k-100k, 16.6% for AGIs over 100k)
Earned income credit: $1,604 (reported on 13.3% of returns)
Here:
$1,604
State:
$1,696
Percentage of individuals using paid preparers for their 2004 taxes: 59.4%
Here:
59%
State:
55%
(% for various income ranges: 44.6% for AGIs below $10k, 60.8% for AGIs $10k-25k, 62.7% for AGIs $25k-50k, 59.5% for AGIs $50k-75k, 66.7% for AGIs $75k-100k, 77.3% for AGIs over 100k)
Household received Food Stamps/SNAP in the past 12 months: 51 Household did not receive Food Stamps/SNAP in the past 12 months: 807
Women who had a birth in the past 12 months: 12 (11 now married, 1 unmarried) Women who did not have a birth in the past 12 months: 472 (250 now married, 221 unmarried)
Housing units in zip code 44849 with a mortgage: 314 (40 second mortgage, 32 both second mortgage and home equity loan) Median monthly owner costs for units with a mortgage: $1,239 Median monthly owner costs for units without a mortgage: $415
Residents with income below the poverty level in 2022:
This zip code:
8.3%
Whole state:
13.4%
Residents with income below 50% of the poverty level in 2022:
This zip code:
2.5%
Whole state:
7.0%
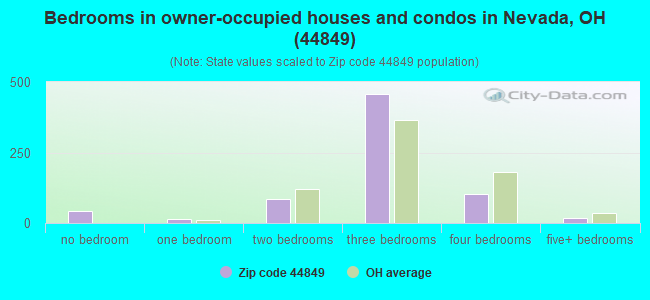
Median number of rooms in houses and condos:
Here:
6.5
State:
6.7
Median number of rooms in apartments:
Here:
5.8
State:
4.4
Notable locations in this zip code not listed on our city pages
Notable locations in zip code 44849: Ackley Farms (A), KJM Farms (B), Richmond Farms (C), Wyandot East Fire and Emergency Medical Services District (D). Display/hide their locations on the map
Churches in zip code 44849 include: Oceola United Methodist Church (A), Nevada United Methodist Church (B), Nevada Lutheran Church (C). Display/hide their locations on the map
Size of family households: 292 2-persons, 91 3-persons, 95 4-persons, 79 5-persons, 27 6-persons
Size of nonfamily households: 216 1-person, 46 2-persons, 8 3-persons
402 married couples with children.
16 single-parent households (15 men, 1 women).
98.3% of residents of 44849 zip code speak English at home.
0.7% of residents speak Spanish at home (100% very well).
0.7% of residents speak other Indo-European language at home (7% very well, 93% not well).
Foreign born population: 6 (0.3%) (0.0% of them are naturalized citizens)
:
0.3%
Whole state:
5.0%
100%Honduras
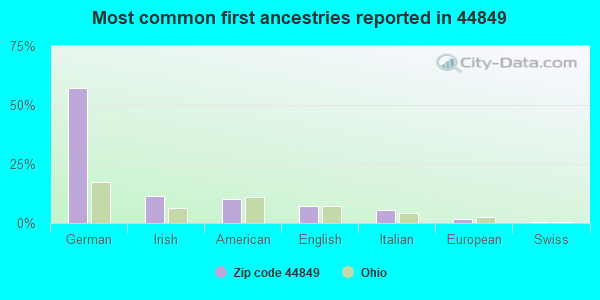
57%German
12%Irish
10%American
7%English
5%Italian
2%European
1%Swiss
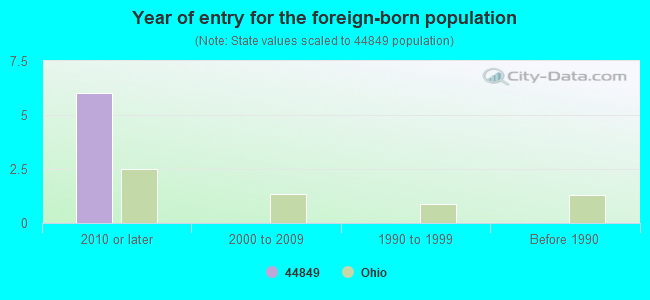
Year of entry for the foreign-born population
62010 or later
02000 to 2009
01990 to 1999
0Before 1990
Housing units lacking complete plumbing facilities: 7.9% Housing units lacking complete kitchen facilities: 3.5%
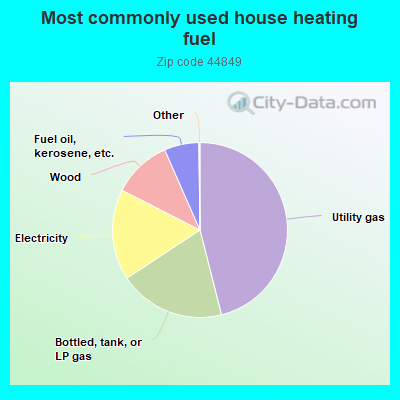
46.1%Utility gas
19.7%Bottled, tank, or LP gas
16.8%Electricity
10.9%Wood
6.4%Fuel oil, kerosene, etc.
Population in 1990: 2,464.
Place of birth for U.S.-born residents:
This state: 1,897
Northeast: 57
Midwest: 89
South: 163
West: 7
68% of the 44849 zip code residents lived in the same house 5 years ago. Out of people who lived in different houses, 51% lived in this county. Out of people who lived in different counties, 50% lived in Ohio.
95% of the 44849 zip code residents lived in the same house 1 year ago. Out of people who lived in different houses, 67% moved from this county. Out of people who lived in different houses, 33% moved from different county within same state. Out of people who lived in different houses, 2% moved from different state.
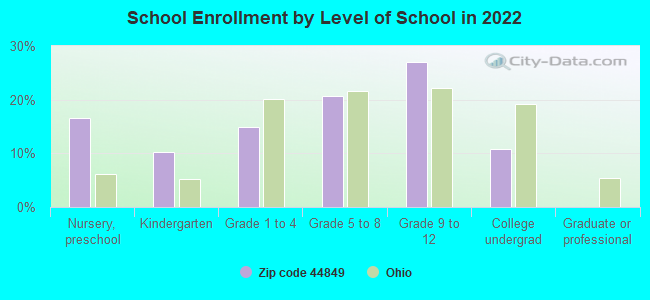
Private vs. public school enrollment:
Students in private schools in grades 1 to 8 (elementary and middle school): 29
Here:
15.8%
Ohio:
16.0%
Students in private schools in grades 9 to 12 (high school):
Here:
0.0%
Ohio:
13.1%
Students in private undergraduate colleges: 29
Here:
51.6%
Ohio:
22.3%
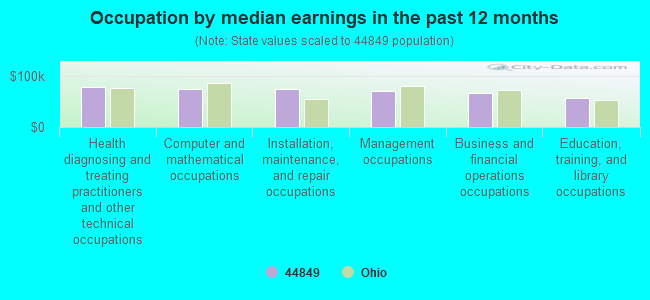
Occupation by median earnings in the past 12 months ($)
78,928Health diagnosing and treating practitioners and other technical occupations
75,248Computer and mathematical occupations
74,544Installation, maintenance, and repair occupations
69,865Management occupations
67,051Business and financial operations occupations
56,486Education, training, and library occupations
Top industries in this zip code by the number of employees in 2005:
Accommodation and Food Services: Full-Service Restaurants (5-9: 1)
Wholesale Trade: Grain and Field Bean Merchant Wholesalers (5-9: 1)
Other Services (except Public Administration): Automotive Body, Paint, and Interior Repair and Maintenance (5-9: 1)
Finance and Insurance: Commercial Banking (5-9: 1)
Construction: All Other Specialty Trade Contractors (1-4: 3)
Other Services (except Public Administration): Religious Organizations (1-4: 2)
Construction: Power and Communication Line and Related Structures Construction (1-4: 2)
Other Services (except Public Administration): Business Associations (1-4: 1)
Fatal accident statistics in 2014:
Fatal accident count: 1
Vehicles involved in fatal accidents: 1
Fatal accidents caused by drunken drivers: 1
Fatalities: 2
Persons involved in fatal accidents: 4
Pedestrians involved in fatal accidents: 0
2002 - 2018 National Fire Incident Reporting System (NFIRS) incidents
According to the data from the years 2002 - 2018 the average number of fires per year is 8. The highest number of fire incidents - 19 took place in 2017, and the least - 1 in 2002. The data has a growing trend.
When looking into fire subcategories, the most incidents belonged to: Structure Fires (42.6%), and Outside Fires (29.4%).
Fire incident types reported to NFIRS in Zip Code 44849

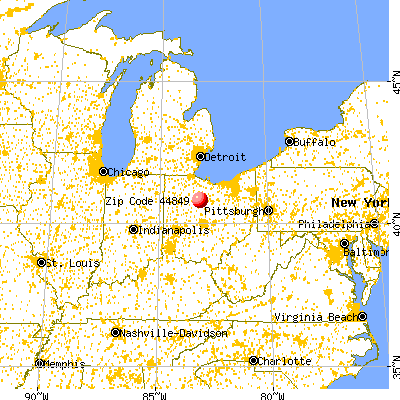


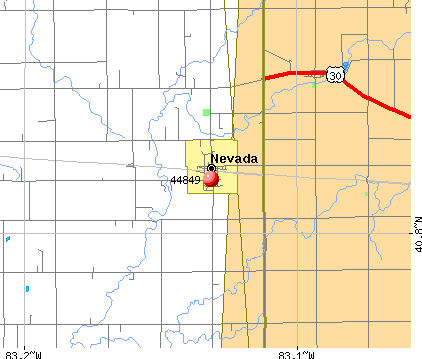 Nearest zip codes: 44882, 43323, 44820, 43351, 43337, 43302.


 According to the data from the years 2002 - 2018 the average number of fires per year is 8. The highest number of fire incidents - 19 took place in 2017, and the least - 1 in 2002. The data has a growing trend.
 When looking into fire subcategories, the most incidents belonged to: Structure Fires (42.6%), and Outside Fires (29.4%).