Estimated zip code population in 2022: 5,049 Zip code population in 2010: 5,308 Zip code population in 2000: 5,261
Houses and condos: 2,253 Renter-occupied apartments: 466
% of renters here:
23%
State:
33%
March 2022 cost of living index in zip code 44851: 83.2 (low, U.S. average is 100)
Land area: 74.2 sq. mi. Water area: 0.7 sq. mi.
Population density: 68 people per square mile
(very low).
OSM Map
General Map
Google Map
MSN Map
OSM Map
General Map
Google Map
MSN Map
OSM Map
General Map
Google Map
MSN Map
OSM Map
General Map
Google Map
MSN Map
Please wait while loading the map...
Real estate property taxes paid for housing units in 2022:
This zip code:
1.0% ($1,640)
Ohio:
1.3% ($2,639)
Median real estate property taxes paid for housing units with mortgages in 2022: $1,709 (1.1%) Median real estate property taxes paid for housing units with no mortgage in 2022: $1,509 (0.9%)
Estimated median house/condo value in 2022: $165,128
44851:
$165,128
Ohio:
$204,100
According to our research of Ohio and other state lists, there were 7 registered sex offenders living in 44851 zip code as of May 28, 2024. The ratio of all residents to sex offenders in zip code 44851 is 681 to 1. The ratio of registered sex offenders to all residents in this zip code is near the state average.
Median resident age:
This zip code:
43.2 years
Ohio median age:
39.9 years
Average household size:
This zip code:
2.4 people
Ohio:
2.4 people
Averages for the 2020 tax year for zip code 44851, filed in 2021:
Average Adjusted Gross Income (AGI) in 2020: $49,991 (Individual Income Tax Returns)
Here:
$49,991
State:
$67,288
Salary/wage: $44,778 (reported on 83.3% of returns)
Here:
$44,778
State:
$55,628
(% of AGI for various income ranges: 1047.8% for AGIs below $25k, 3580.3% for AGIs $25k-50k, 6458.8% for AGIs $50k-75k, 10596.2% for AGIs $75k-100k, 14877.6% for AGIs $100k-200k)
Taxable interest for individuals: $676 (reported on 26.5% of returns)
This zip code:
$676
Ohio:
$1,518
(% of AGI for various income ranges: 13.7% for AGIs below $25k, 6.7% for AGIs $25k-50k, 25.0% for AGIs $50k-75k, 30.0% for AGIs $75k-100k, 108.2% for AGIs $100k-200k)
Ordinary dividends: $2,716 (reported on 12.1% of returns)
Here:
$2,716
State:
$7,167
(% of AGI for various income ranges: 23.8% for AGIs below $25k, 9.8% for AGIs $25k-50k, 61.9% for AGIs $50k-75k, 52.5% for AGIs $75k-100k, 207.6% for AGIs $100k-200k)
Net capital gain/loss in AGI: +$7,996 (reported on 10.5% of returns)
Here:
+$7,996
State:
+$18,919
(% of AGI for various income ranges: 12.2% for AGIs below $25k, 17.2% for AGIs $25k-50k, 27.2% for AGIs $50k-75k, 81.2% for AGIs $75k-100k, 243.5% for AGIs $100k-200k)
Profit/loss from business: +$7,250 (reported on 10.9% of returns)
Here:
+$7,250
State:
+$13,744
(% of AGI for various income ranges: 59.5% for AGIs below $25k, 102.1% for AGIs $25k-50k, 83.8% for AGIs $50k-75k, 206.9% for AGIs $75k-100k, 272.9% for AGIs $100k-200k)
Taxable individual retirement arrangement distribution: $14,105 (reported on 8.2% of returns)
44851:
$14,105
Ohio:
$18,876
(% of AGI for various income ranges: 65.2% for AGIs below $25k, 83.4% for AGIs $25k-50k, 308.1% for AGIs $50k-75k, 635.9% for AGIs $100k-200k)
Total itemized deductions: $27,480 (reported on 1.9% of returns)
Here:
$27,480
State:
$33,869
(% of AGI for various income ranges: 99.7% for AGIs below $25k, 466.2% for AGIs $75k-100k)
Charity contributions: $7,733 (reported on 1.2% of returns)
Here:
$7,733
State:
$14,577
(% of AGI for various income ranges: 72.5% for AGIs $50k-75k)
Taxes paid: $6,060 (reported on 1.9% of returns)
44851:
$6,060
State:
$7,681
(% of AGI for various income ranges: 14.9% for AGIs below $25k, 130.6% for AGIs $75k-100k)
Earned income credit: $2,316 (reported on 14.8% of returns)
Here:
$2,316
State:
$2,304
(% of AGI for various income ranges: 94.0% for AGIs below $25k, 49.7% for AGIs $25k-50k)
Percentage of individuals using paid preparers for their 2020 taxes: 95.3%
Here:
95%
State:
94%
(% for various income ranges: 94.2% for AGIs below $25k, 95.9% for AGIs $25k-50k, 95.5% for AGIs $50k-75k, 95.8% for AGIs $75k-100k, 96.2% for AGIs $100k-200k, 100.0% for AGIs over 200k)
Averages for the 2012 tax year for zip code 44851, filed in 2013:
Average Adjusted Gross Income (AGI) in 2012: $42,398 (Individual Income Tax Returns)
Here:
$42,398
State:
$54,926
Salary/wage: $36,853 (reported on 87.0% of returns)
Here:
$36,853
State:
$45,869
(% of AGI for various income ranges: 74.0% for AGIs below $25k, 81.5% for AGIs $25k-50k, 80.2% for AGIs $50k-75k, 78.5% for AGIs $75k-100k, 63.8% for AGIs $100k-200k)
Taxable interest for individuals: $600 (reported on 28.0% of returns)
This zip code:
$600
Ohio:
$1,297
(% of AGI for various income ranges: 0.6% for AGIs below $25k, 0.5% for AGIs $25k-50k, 0.4% for AGIs $50k-75k, 0.2% for AGIs $75k-100k, 0.3% for AGIs $100k-200k)
Ordinary dividends: $2,219 (reported on 14.6% of returns)
Here:
$2,219
State:
$5,821
(% of AGI for various income ranges: 0.9% for AGIs below $25k, 0.7% for AGIs $25k-50k, 0.6% for AGIs $50k-75k, 0.5% for AGIs $75k-100k, 1.1% for AGIs $100k-200k)
Net capital gain/loss in AGI: +$2,627 (reported on 10.6% of returns)
Here:
+$2,627
State:
+$11,232
(% of AGI for various income ranges: 0.1% for AGIs below $25k, 0.9% for AGIs $75k-100k, 2.0% for AGIs $100k-200k)
Profit/loss from business: +$5,300 (reported on 11.4% of returns)
Here:
+$5,300
State:
+$12,773
(% of AGI for various income ranges: 6.3% for AGIs below $25k, 0.7% for AGIs $25k-50k, 0.8% for AGIs $50k-75k, 1.1% for AGIs $75k-100k, 0.7% for AGIs $100k-200k)
Taxable individual retirement arrangement distribution: $10,725 (reported on 8.1% of returns)
44851:
$10,725
Ohio:
$14,511
(% of AGI for various income ranges: 1.8% for AGIs below $25k, 2.0% for AGIs $25k-50k, 1.7% for AGIs $50k-75k, 2.9% for AGIs $75k-100k, 1.9% for AGIs $100k-200k)
Total itemized deductions: $16,927 (21% of AGI, reported on 22.8% of returns)
Here:
$16,927
State:
$21,278
Here:
21.2% of AGI
State:
18.8% of AGI
(% of AGI for various income ranges: 5.3% for AGIs below $25k, 7.2% for AGIs $25k-50k, 9.3% for AGIs $50k-75k, 10.3% for AGIs $75k-100k, 11.8% for AGIs $100k-200k)
Charity contributions: $2,450 (reported on 15.4% of returns)
Here:
$2,450
State:
$3,943
(% of AGI for various income ranges: 0.4% for AGIs below $25k, 0.4% for AGIs $25k-50k, 0.9% for AGIs $50k-75k, 0.9% for AGIs $75k-100k, 1.6% for AGIs $100k-200k)
Taxes paid: $5,979 (reported on 22.8% of returns)
44851:
$5,979
State:
$9,568
(% of AGI for various income ranges: 0.7% for AGIs below $25k, 1.9% for AGIs $25k-50k, 3.0% for AGIs $50k-75k, 3.5% for AGIs $75k-100k, 5.8% for AGIs $100k-200k)
Earned income credit: $2,233 (reported on 18.7% of returns)
Here:
$2,233
State:
$2,285
(% of AGI for various income ranges: 6.4% for AGIs below $25k, 1.0% for AGIs $25k-50k)
Percentage of individuals using paid preparers for their 2012 taxes: 61.0%
Here:
61%
State:
51%
(% for various income ranges: 56.1% for AGIs below $25k, 62.5% for AGIs $25k-50k, 64.1% for AGIs $50k-75k, 65.0% for AGIs $75k-100k, 70.6% for AGIs $100k-200k)
Averages for the 2004 tax year for zip code 44851, filed in 2005:
Average Adjusted Gross Income (AGI) in 2004: $34,005 (Individual Income Tax Returns)
Here:
$34,005
State:
$44,480
Salary/wage: $32,324 (reported on 88.6% of returns)
Here:
$32,324
State:
$39,198
(% of AGI for various income ranges: 99.3% for AGIs below $10k, 77.2% for AGIs $10k-25k, 87.5% for AGIs $25k-50k, 85.2% for AGIs $50k-75k, 85.1% for AGIs $75k-100k, 77.2% for AGIs over 100k)
Taxable interest for individuals: $740 (reported on 36.7% of returns)
This zip code:
$740
Ohio:
$1,532
(% of AGI for various income ranges: 3.3% for AGIs below $10k, 1.6% for AGIs $10k-25k, 0.6% for AGIs $25k-50k, 0.7% for AGIs $50k-75k, 0.3% for AGIs $75k-100k, 0.7% for AGIs over 100k)
Taxable dividends: $1,562 (reported on 15.5% of returns)
Here:
$1,562
State:
$3,496
(% of AGI for various income ranges: 1.4% for AGIs below $10k, 0.8% for AGIs $10k-25k, 0.4% for AGIs $25k-50k, 1.1% for AGIs $50k-75k, 0.5% for AGIs $75k-100k, 0.7% for AGIs over 100k)
Net capital gain/loss: +$2,312 (reported on 11.6% of returns)
Here:
+$2,312
State:
+$8,582
(% of AGI for various income ranges: -1.3% for AGIs below $10k, 0.4% for AGIs $10k-25k, 0.4% for AGIs $25k-50k, 0.2% for AGIs $50k-75k, 1.2% for AGIs $75k-100k, 3.4% for AGIs over 100k)
Profit/loss from business: +$4,929 (reported on 11.8% of returns)
Here:
+$4,929
State:
+$10,813
(% of AGI for various income ranges: 7.1% for AGIs below $10k, 4.3% for AGIs $10k-25k, 1.6% for AGIs $25k-50k, 1.4% for AGIs $50k-75k, 0.8% for AGIs $75k-100k)
IRA payment deduction: $3,045 (reported on 1.7% of returns)
44851:
$3,045
Ohio:
$2,794
Total itemized deductions: $13,437 (23% of AGI, reported on 28.0% of returns)
Here:
$13,437
State:
$17,503
Here:
22.7% of AGI
State:
20.8% of AGI
(% of AGI for various income ranges: 5.2% for AGIs below $10k, 7.4% for AGIs $10k-25k, 9.8% for AGIs $25k-50k, 11.6% for AGIs $50k-75k, 14.9% for AGIs $75k-100k, 13.6% for AGIs over 100k)
Charity contributions deductions: $1,996 (3% of AGI, reported on 19.1% of returns)
Here:
$1,996
State:
$3,087
Here:
3.1% of AGI
State:
3.4% of AGI
(% of AGI for various income ranges: 0.6% for AGIs $10k-25k, 0.8% for AGIs $25k-50k, 1.2% for AGIs $50k-75k, 1.5% for AGIs $75k-100k, 2.1% for AGIs over 100k)
Total tax: $3,810 (reported on 73.7% of returns)
44851:
$3,810
State:
$6,781
(% of AGI for various income ranges: 2.4% for AGIs below $10k, 4.0% for AGIs $10k-25k, 6.9% for AGIs $25k-50k, 8.4% for AGIs $50k-75k, 9.8% for AGIs $75k-100k, 15.2% for AGIs over 100k)
Earned income credit: $1,671 (reported on 15.3% of returns)
Here:
$1,671
State:
$1,696
Percentage of individuals using paid preparers for their 2004 taxes: 58.1%
Here:
58%
State:
55%
(% for various income ranges: 45.2% for AGIs below $10k, 58.7% for AGIs $10k-25k, 63.6% for AGIs $25k-50k, 58.2% for AGIs $50k-75k, 72.3% for AGIs $75k-100k, 60.2% for AGIs over 100k)
Household received Food Stamps/SNAP in the past 12 months: 291 Household did not receive Food Stamps/SNAP in the past 12 months: 1,760
Women who had a birth in the past 12 months: 58 (59 now married, 0 unmarried) Women who did not have a birth in the past 12 months: 949 (456 now married, 493 unmarried)
Housing units in zip code 44851 with a mortgage: 933 (145 second mortgage, 84 both second mortgage and home equity loan) Houses without a mortgage: 13
Median monthly owner costs for units with a mortgage: $1,160 Median monthly owner costs for units without a mortgage: $576
Residents with income below the poverty level in 2022:
This zip code:
10.1%
Whole state:
13.4%
Residents with income below 50% of the poverty level in 2022:
This zip code:
5.2%
Whole state:
7.0%
Median number of rooms in houses and condos:
Here:
6.9
State:
6.7
Median number of rooms in apartments:
Here:
4.8
State:
4.4
Notable locations in this zip code not listed on our city pages
Notable locations in zip code 44851: Millstone Hills Golf Course (A), New London Emergency Medical Services (B), Firelands Ambulance Service (C), New London Fire Department (D). Display/hide their locations on the map
Churches in zip code 44851 include: First Baptist Church (A), New London United Methodist Church (B), Our Lady of Lourdes Church (C), Second Baptist Church (D). Display/hide their locations on the map
Cemeteries: Fitchville Cemetery (1), Holy Cross Catholic Cemetery (2), Grove Street Cemetery (3), Golding Cemetery (4), Fayette Cemetery (5), East Creek Cemetery (6), Day Cemetery (7). Display/hide their locations on the map
Housing units lacking complete plumbing facilities: 2.4% Housing units lacking complete kitchen facilities: 1.0%
44.1%Utility gas
20.6%Bottled, tank, or LP gas
19.4%Electricity
11.7%Wood
3.2%Fuel oil, kerosene, etc.
1.1%Other fuel
Population in 1990: 4,243. Population change in the 1990s: +1,018 (+24.0%).
Place of birth for U.S.-born residents:
This state: 4,571
Northeast: 62
Midwest: 59
South: 276
West: 50
59% of the 44851 zip code residents lived in the same house 5 years ago. Out of people who lived in different houses, 57% lived in this county. Out of people who lived in different counties, 50% lived in Ohio.
91% of the 44851 zip code residents lived in the same house 1 year ago. Out of people who lived in different houses, 63% moved from this county. Out of people who lived in different houses, 26% moved from different county within same state. Out of people who lived in different houses, 5% moved from different state. Out of people who lived in different houses, 6% moved from abroad.
Private vs. public school enrollment:
Students in private schools in grades 1 to 8 (elementary and middle school): 24
Here:
6.6%
Ohio:
16.0%
Students in private schools in grades 9 to 12 (high school): 8
Here:
3.9%
Ohio:
13.1%
Students in private undergraduate colleges: 17
Here:
10.8%
Ohio:
22.3%
Occupation by median earnings in the past 12 months ($)
66,990Construction and extraction occupations
65,531Health diagnosing and treating practitioners and other technical occupations
62,397Transportation occupations
57,942Architecture and engineering occupations
50,526Education, training, and library occupations
47,864Business and financial operations occupations
Companies with federal contracts located in this zip code:
INDUSTRIAL PRODUCTS DISTRIBUTI (4051 STATE ROUTE 162 E in NEW LONDON, OH; small business)
$91,200 with Air Force for Converters, Electrical, Nonrotating. Signed on 2002-08-19. Completion date: 2003-01-17.
ROTH MANUFACTURING CORP (81 EAST WASHBURN ST in NEW LONDON, OH; small business)
$77,900 with U.S. Army Corps of Engineers - civil program financing only for Bars and Rods. Signed on 2000-12-20. Completion date: 2001-03-27.
ARCHER MACHINE TOOL (52103 BURSLEY RD in NEW LONDON, OH; small business)
$5,522 with Defense Logistics Agency for Hardware, Commercial. Signed on 2005-03-28. Completion date: 2005-04-01.
Top industries in this zip code by the number of employees in 2005:
Health Care and Social Assistance: Nursing Care Facilities (50-99 employees: 1 establishment, 20-49 employees: 1 establishment)
Accommodation and Food Services: Limited-Service Restaurants (20-49: 1, 10-19: 1)
Accommodation and Food Services: Full-Service Restaurants (10-19: 3)
Utilities: Electric Power Distribution (20-49: 1)
People in group quarters in 2010:
47 people in nursing facilities/skilled-nursing facilities
People in group quarters in 2000:
44 people in nursing homes
Fatal accident statistics in 2014:
Fatal accident count: 1
Vehicles involved in fatal accidents: 2
Fatal accidents caused by drunken drivers: 0
Fatalities: 1
Persons involved in fatal accidents: 2
Pedestrians involved in fatal accidents: 0
Fatal accident statistics in 2013:
Fatal accident count: 1
Vehicles involved in fatal accidents: 2
Fatal accidents caused by drunken drivers: 0
Fatalities: 2
Persons involved in fatal accidents: 4
Pedestrians involved in fatal accidents: 0
Home Mortgage Disclosure Act Aggregated Statistics For Year 2009 (Based on 2 partial tracts)
A) FHA, FSA/RHS & VA Home Purchase Loans
B) Conventional Home Purchase Loans
C) Refinancings
D) Home Improvement Loans
F) Non-occupant Loans on < 5 Family Dwellings (A B C & D)
Number
Average Value
Number
Average Value
Number
Average Value
Number
Average Value
Number
Average Value
LOANS ORIGINATED
3
$126,707
3
$103,887
16
$135,981
1
$82,530
1
$73,770
APPLICATIONS APPROVED, NOT ACCEPTED
0
$0
0
$0
0
$0
0
$0
0
$0
APPLICATIONS DENIED
1
$108,780
1
$128,790
12
$169,742
1
$5,000
0
$0
APPLICATIONS WITHDRAWN
0
$0
0
$0
3
$150,153
1
$37,820
0
$0
FILES CLOSED FOR INCOMPLETENESS
0
$0
0
$0
1
$237,580
0
$0
0
$0
Aggregated Statistics For Year 2008 (Based on 2 partial tracts)
A) FHA, FSA/RHS & VA Home Purchase Loans
B) Conventional Home Purchase Loans
C) Refinancings
D) Home Improvement Loans
Number
Average Value
Number
Average Value
Number
Average Value
Number
Average Value
LOANS ORIGINATED
2
$107,065
3
$184,537
11
$136,009
3
$26,153
APPLICATIONS APPROVED, NOT ACCEPTED
0
$0
0
$0
1
$213,190
0
$0
APPLICATIONS DENIED
0
$0
0
$0
10
$120,414
3
$58,977
APPLICATIONS WITHDRAWN
0
$0
0
$0
2
$123,320
0
$0
FILES CLOSED FOR INCOMPLETENESS
0
$0
0
$0
0
$0
0
$0
Aggregated Statistics For Year 2007 (Based on 2 partial tracts)
A) FHA, FSA/RHS & VA Home Purchase Loans
B) Conventional Home Purchase Loans
C) Refinancings
D) Home Improvement Loans
F) Non-occupant Loans on < 5 Family Dwellings (A B C & D)
Number
Average Value
Number
Average Value
Number
Average Value
Number
Average Value
Number
Average Value
LOANS ORIGINATED
1
$138,790
8
$153,526
14
$117,449
5
$38,574
1
$26,260
APPLICATIONS APPROVED, NOT ACCEPTED
0
$0
1
$89,720
2
$136,295
0
$0
0
$0
APPLICATIONS DENIED
0
$0
1
$203,820
13
$133,913
2
$20,475
0
$0
APPLICATIONS WITHDRAWN
0
$0
1
$351,990
3
$189,540
1
$15,320
0
$0
FILES CLOSED FOR INCOMPLETENESS
0
$0
0
$0
3
$159,633
0
$0
0
$0
Aggregated Statistics For Year 2006 (Based on 2 partial tracts)
B) Conventional Home Purchase Loans
C) Refinancings
D) Home Improvement Loans
F) Non-occupant Loans on < 5 Family Dwellings (A B C & D)
G) Loans On Manufactured Home Dwelling (A B C & D)
Number
Average Value
Number
Average Value
Number
Average Value
Number
Average Value
Number
Average Value
LOANS ORIGINATED
8
$149,345
21
$117,240
5
$49,204
1
$93,470
1
$76,900
APPLICATIONS APPROVED, NOT ACCEPTED
3
$103,053
5
$105,972
1
$10,320
0
$0
1
$64,080
APPLICATIONS DENIED
3
$94,407
19
$130,617
5
$91,780
1
$61,270
1
$87,220
APPLICATIONS WITHDRAWN
0
$0
9
$149,214
1
$71,900
0
$0
0
$0
FILES CLOSED FOR INCOMPLETENESS
0
$0
3
$142,650
0
$0
0
$0
0
$0
Aggregated Statistics For Year 2005 (Based on 2 partial tracts)
A) FHA, FSA/RHS & VA Home Purchase Loans
B) Conventional Home Purchase Loans
C) Refinancings
D) Home Improvement Loans
F) Non-occupant Loans on < 5 Family Dwellings (A B C & D)
G) Loans On Manufactured Home Dwelling (A B C & D)
Number
Average Value
Number
Average Value
Number
Average Value
Number
Average Value
Number
Average Value
Number
Average Value
LOANS ORIGINATED
1
$102,220
13
$127,468
28
$127,184
5
$67,960
3
$72,313
0
$0
APPLICATIONS APPROVED, NOT ACCEPTED
0
$0
2
$89,090
8
$128,518
0
$0
0
$0
0
$0
APPLICATIONS DENIED
0
$0
5
$132,792
21
$127,080
3
$47,620
1
$58,140
1
$45,950
APPLICATIONS WITHDRAWN
0
$0
2
$85,810
10
$156,112
3
$74,400
0
$0
0
$0
FILES CLOSED FOR INCOMPLETENESS
0
$0
1
$114,410
2
$160,050
0
$0
0
$0
0
$0
Aggregated Statistics For Year 2004 (Based on 2 partial tracts)
A) FHA, FSA/RHS & VA Home Purchase Loans
B) Conventional Home Purchase Loans
C) Refinancings
D) Home Improvement Loans
F) Non-occupant Loans on < 5 Family Dwellings (A B C & D)
Number
Average Value
Number
Average Value
Number
Average Value
Number
Average Value
Number
Average Value
LOANS ORIGINATED
1
$137,860
15
$143,233
28
$138,817
2
$47,985
1
$40,950
APPLICATIONS APPROVED, NOT ACCEPTED
0
$0
2
$176,305
5
$133,042
1
$50,020
0
$0
APPLICATIONS DENIED
1
$75,020
3
$87,737
18
$133,376
2
$8,910
0
$0
APPLICATIONS WITHDRAWN
0
$0
2
$81,430
10
$128,135
1
$25,010
0
$0
FILES CLOSED FOR INCOMPLETENESS
0
$0
1
$144,420
1
$80,960
0
$0
0
$0
Aggregated Statistics For Year 2003 (Based on 2 partial tracts)
A) FHA, FSA/RHS & VA Home Purchase Loans
B) Conventional Home Purchase Loans
C) Refinancings
D) Home Improvement Loans
F) Non-occupant Loans on < 5 Family Dwellings (A B C & D)
Number
Average Value
Number
Average Value
Number
Average Value
Number
Average Value
Number
Average Value
LOANS ORIGINATED
3
$166,093
15
$132,751
50
$121,283
3
$23,133
1
$36,260
APPLICATIONS APPROVED, NOT ACCEPTED
0
$0
0
$0
4
$140,982
0
$0
0
$0
APPLICATIONS DENIED
0
$0
1
$130,040
17
$114,209
2
$10,005
0
$0
APPLICATIONS WITHDRAWN
0
$0
2
$91,905
8
$117,030
0
$0
0
$0
FILES CLOSED FOR INCOMPLETENESS
0
$0
0
$0
3
$110,243
0
$0
0
$0
Aggregated Statistics For Year 2002 (Based on 2 partial tracts)
A) FHA, FSA/RHS & VA Home Purchase Loans
B) Conventional Home Purchase Loans
C) Refinancings
D) Home Improvement Loans
Number
Average Value
Number
Average Value
Number
Average Value
Number
Average Value
LOANS ORIGINATED
1
$168,180
12
$121,185
31
$131,867
3
$17,507
APPLICATIONS APPROVED, NOT ACCEPTED
0
$0
0
$0
6
$127,123
0
$0
APPLICATIONS DENIED
0
$0
3
$97,843
16
$120,879
3
$15,420
APPLICATIONS WITHDRAWN
0
$0
1
$97,530
11
$106,625
0
$0
FILES CLOSED FOR INCOMPLETENESS
0
$0
0
$0
4
$111,130
0
$0
Aggregated Statistics For Year 2001 (Based on 2 partial tracts)
A) FHA, FSA/RHS & VA Home Purchase Loans
B) Conventional Home Purchase Loans
C) Refinancings
D) Home Improvement Loans
Number
Average Value
Number
Average Value
Number
Average Value
Number
Average Value
LOANS ORIGINATED
2
$164,115
15
$134,481
30
$116,193
3
$26,677
APPLICATIONS APPROVED, NOT ACCEPTED
0
$0
1
$53,140
7
$102,756
1
$11,880
APPLICATIONS DENIED
0
$0
1
$148,480
17
$113,584
2
$14,380
APPLICATIONS WITHDRAWN
0
$0
1
$70,960
10
$107,066
1
$44,700
FILES CLOSED FOR INCOMPLETENESS
0
$0
1
$35,010
4
$104,878
0
$0
Aggregated Statistics For Year 2000 (Based on 2 partial tracts)
A) FHA, FSA/RHS & VA Home Purchase Loans
B) Conventional Home Purchase Loans
C) Refinancings
D) Home Improvement Loans
F) Non-occupant Loans on < 5 Family Dwellings (A B C & D)
Number
Average Value
Number
Average Value
Number
Average Value
Number
Average Value
Number
Average Value
LOANS ORIGINATED
2
$101,440
13
$114,724
9
$96,767
7
$21,659
0
$0
APPLICATIONS APPROVED, NOT ACCEPTED
0
$0
2
$74,240
2
$87,995
2
$8,285
0
$0
APPLICATIONS DENIED
1
$70,020
1
$141,610
21
$98,960
3
$12,190
0
$0
APPLICATIONS WITHDRAWN
0
$0
2
$63,300
6
$100,188
0
$0
1
$34,070
FILES CLOSED FOR INCOMPLETENESS
0
$0
1
$97,220
2
$101,280
0
$0
0
$0
Aggregated Statistics For Year 1999 (Based on 1 partial tract)
Detailed PMIC statistics for the following Tracts:0971.00
2002 - 2018 National Fire Incident Reporting System (NFIRS) incidents
Based on the data from the years 2002 - 2018 the average number of fires per year is 23. The highest number of fires - 35 took place in 2018, and the least - 10 in 2013. The data has a growing trend.
When looking into fire subcategories, the most reports belonged to: Structure Fires (58.2%), and Outside Fires (23.2%).
Fire incident types reported to NFIRS in Zip Code 44851

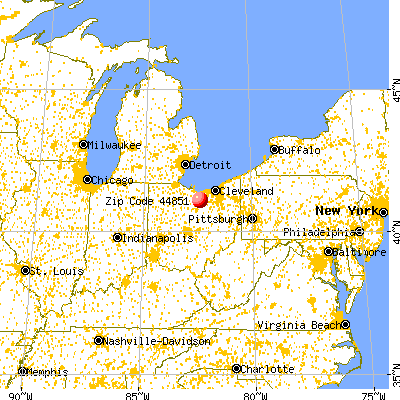


 Nearest zip codes: 44859, 44837, 44889, 44874, 44826, 44090.


 Based on the data from the years 2002 - 2018 the average number of fires per year is 23. The highest number of fires - 35 took place in 2018, and the least - 10 in 2013. The data has a growing trend.
 When looking into fire subcategories, the most reports belonged to: Structure Fires (58.2%), and Outside Fires (23.2%).