Estimated zip code population in 2022: 618 Zip code population in 2010: 699 Zip code population in 2000: 824
Houses and condos: 354 Renter-occupied apartments: 220
% of renters here:
71%
State:
33%
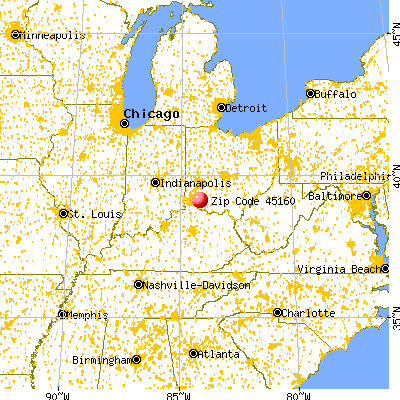
March 2022 cost of living index in zip code 45160: 86.6 (less than average, U.S. average is 100)
Land area: 0.3 sq. mi. Water area: 0.0 sq. mi.
Population density: 1,781 people per square mile
(low).
OSM Map
General Map
Google Map
MSN Map
OSM Map
General Map
Google Map
MSN Map
OSM Map
General Map
Google Map
MSN Map
OSM Map
General Map
Google Map
MSN Map
Please wait while loading the map...
Real estate property taxes paid for housing units in 2022:
This zip code:
1.0% ($1,694)
Ohio:
1.3% ($2,639)
Median real estate property taxes paid for housing units with mortgages in 2022: $1,597 (0.9%) Median real estate property taxes paid for housing units with no mortgage in 2022: $1,797 (1.2%)
Business Search- 14 Million verified businesses
Males: 210
(34.1%)
Females: 407
(65.9%)
For population 25 years and over in 45160:
High school or higher: 68.2%
Bachelor's degree or higher: 12.4%
Graduate or professional degree: 0.5%
Mean travel time to work (commute): 30.0 minutes
For population 15 years and over in 45160:
Never married: 20.7%
Now married: 36.6%
Separated: 2.3%
Widowed: 21.8%
Divorced: 18.5%
Zip code 45160 compared to state average:
Median household income significantly below state average.
Unemployed percentage significantly below state average.
Black race population percentage significantly below state average.
Hispanic race population percentage significantly below state average.
Median age significantly above state average.
Foreign-born population percentage significantly below state average.
Renting percentage above state average.
Length of stay since moving in significantly above state average.
Number of college students below state average.
Percentage of population with a bachelor's degree or higher significantly below state average.
Estimated median house/condo value in 2022: $168,803
45160:
$168,803
Ohio:
$204,100
Median resident age:
This zip code:
52.4 years
Ohio median age:
39.9 years
Average household size:
This zip code:
2.0 people
Ohio:
2.4 people
Averages for the 2020 tax year for zip code 45160, filed in 2021:
Average Adjusted Gross Income (AGI) in 2020: $45,741 (Individual Income Tax Returns)
Here:
$45,741
State:
$67,288
Salary/wage: $37,000 (reported on 78.1% of returns)
Here:
$37,000
State:
$55,628
(% of AGI for various income ranges: 1020.0% for AGIs below $25k, 3431.4% for AGIs $25k-50k, 6446.7% for AGIs $50k-75k, 5756.7% for AGIs $75k-100k)
Taxable interest for individuals: $367 (reported on 18.8% of returns)
This zip code:
$367
Ohio:
$1,518
(% of AGI for various income ranges: 12.0% for AGIs below $25k, 33.3% for AGIs $50k-75k)
Ordinary dividends: $6,100 (reported on 9.4% of returns)
Here:
$6,100
State:
$7,167
(% of AGI for various income ranges: 610.0% for AGIs $50k-75k)
Net capital gain/loss in AGI: +$2,300 (reported on 9.4% of returns)
Here:
+$2,300
State:
+$18,919
(% of AGI for various income ranges: 230.0% for AGIs $50k-75k)
Profit/loss from business: +$5,525 (reported on 12.5% of returns)
Here:
+$5,525
State:
+$13,744
(% of AGI for various income ranges: 221.0% for AGIs below $25k)
Taxable individual retirement arrangement distribution: $11,867 (reported on 9.4% of returns)
45160:
$11,867
Ohio:
$18,876
(% of AGI for various income ranges: 508.6% for AGIs $25k-50k)
Earned income credit: $1,886 (reported on 21.9% of returns)
Here:
$1,886
State:
$2,304
(% of AGI for various income ranges: 81.0% for AGIs below $25k, 72.9% for AGIs $25k-50k)
Percentage of individuals using paid preparers for their 2020 taxes: 93.8%
Here:
94%
State:
94%
(% for various income ranges: 92.3% for AGIs below $25k, 88.9% for AGIs $25k-50k, 100.0% for AGIs $50k-75k, 100.0% for AGIs $75k-100k, 100.0% for AGIs $100k-200k)
Averages for the 2012 tax year for zip code 45160, filed in 2013:
Average Adjusted Gross Income (AGI) in 2012: $36,215 (Individual Income Tax Returns)
Here:
$36,215
State:
$54,926
Salary/wage: $33,337 (reported on 79.4% of returns)
Here:
$33,337
State:
$45,869
(% of AGI for various income ranges: 71.8% for AGIs below $25k, 82.3% for AGIs $25k-50k, 79.0% for AGIs $50k-75k, 59.0% for AGIs $100k-200k)
Taxable interest for individuals: $357 (reported on 20.6% of returns)
This zip code:
$357
Ohio:
$1,297
(% of AGI for various income ranges: 0.2% for AGIs $25k-50k, 0.5% for AGIs $50k-75k)
Ordinary dividends: $3,300 (reported on 11.8% of returns)
Here:
$3,300
State:
$5,821
(% of AGI for various income ranges: 2.1% for AGIs below $25k, 2.4% for AGIs $50k-75k)
Net capital gain/loss in AGI: +$633 (reported on 8.8% of returns)
Here:
+$633
State:
+$11,232
(% of AGI for various income ranges: 0.6% for AGIs $25k-50k)
Profit/loss from business: +$7,520 (reported on 14.7% of returns)
Here:
+$7,520
State:
+$12,773
(% of AGI for various income ranges: 19.7% for AGIs below $25k)
Taxable individual retirement arrangement distribution: $9,500 (reported on 8.8% of returns)
45160:
$9,500
Ohio:
$14,511
(% of AGI for various income ranges: 9.2% for AGIs $25k-50k)
Total itemized deductions: $15,743 (22% of AGI, reported on 20.6% of returns)
Here:
$15,743
State:
$21,278
Here:
21.6% of AGI
State:
18.8% of AGI
(% of AGI for various income ranges: 9.1% for AGIs $25k-50k, 8.5% for AGIs $50k-75k, 14.3% for AGIs $100k-200k)
Charity contributions: $2,700 (reported on 11.8% of returns)
Here:
$2,700
State:
$3,943
(% of AGI for various income ranges: 2.8% for AGIs $50k-75k)
Taxes paid: $5,971 (reported on 20.6% of returns)
45160:
$5,971
State:
$9,568
(% of AGI for various income ranges: 2.5% for AGIs $25k-50k, 3.0% for AGIs $50k-75k, 6.6% for AGIs $100k-200k)
Earned income credit: $2,267 (reported on 26.5% of returns)
Here:
$2,267
State:
$2,285
(% of AGI for various income ranges: 10.7% for AGIs below $25k)
Percentage of individuals using paid preparers for their 2012 taxes: 55.9%
Here:
56%
State:
51%
(% for various income ranges: 56.2% for AGIs below $25k, 55.6% for AGIs $25k-50k, 50.0% for AGIs $50k-75k, 66.7% for AGIs $100k-200k)
Averages for the 2004 tax year for zip code 45160, filed in 2005:
Average Adjusted Gross Income (AGI) in 2004: $33,064 (Individual Income Tax Returns)
Here:
$33,064
State:
$44,480
Salary/wage: $31,310 (reported on 86.3% of returns)
Here:
$31,310
State:
$39,198
(% of AGI for various income ranges: 94.5% for AGIs below $10k, 81.5% for AGIs $10k-25k, 84.6% for AGIs $25k-50k, 79.5% for AGIs $50k-75k, 92.6% for AGIs $75k-100k, 69.4% for AGIs over 100k)
Taxable interest for individuals: $511 (reported on 32.1% of returns)
This zip code:
$511
Ohio:
$1,532
(% of AGI for various income ranges: 3.8% for AGIs below $10k, 0.4% for AGIs $10k-25k, 0.6% for AGIs $25k-50k, 0.4% for AGIs $50k-75k, 0.2% for AGIs $75k-100k, 0.2% for AGIs over 100k)
Taxable dividends: $1,458 (reported on 14.5% of returns)
Here:
$1,458
State:
$3,496
(% of AGI for various income ranges: 0.9% for AGIs $10k-25k, 0.4% for AGIs $25k-50k, 1.8% for AGIs $50k-75k, 0.3% for AGIs over 100k)
Net capital gain/loss: +$943 (reported on 8.6% of returns)
Here:
+$943
State:
+$8,582
Profit/loss from business: +$7,830 (reported on 11.5% of returns)
Here:
+$7,830
State:
+$10,813
Total itemized deductions: $14,811 (23% of AGI, reported on 26.0% of returns)
Here:
$14,811
State:
$17,503
Here:
22.5% of AGI
State:
20.8% of AGI
(% of AGI for various income ranges: 7.7% for AGIs $10k-25k, 9.9% for AGIs $25k-50k, 9.4% for AGIs $50k-75k, 17.3% for AGIs $75k-100k, 17.2% for AGIs over 100k)
Charity contributions deductions: $2,354 (3% of AGI, reported on 20.1% of returns)
Here:
$2,354
State:
$3,087
Here:
3.3% of AGI
State:
3.4% of AGI
(% of AGI for various income ranges: 1.2% for AGIs $25k-50k, 1.2% for AGIs $50k-75k, 1.0% for AGIs $75k-100k, 3.6% for AGIs over 100k)
Total tax: $4,186 (reported on 72.3% of returns)
45160:
$4,186
State:
$6,781
(% of AGI for various income ranges: 3.3% for AGIs below $10k, 4.2% for AGIs $10k-25k, 7.7% for AGIs $25k-50k, 8.8% for AGIs $50k-75k, 10.7% for AGIs $75k-100k, 15.5% for AGIs over 100k)
Earned income credit: $2,000 (reported on 19.4% of returns)
Here:
$2,000
State:
$1,696
Percentage of individuals using paid preparers for their 2004 taxes: 56.4%
Here:
56%
State:
55%
(% for various income ranges: 52.1% for AGIs below $10k, 48.3% for AGIs $10k-25k, 65.5% for AGIs $25k-50k, 52.5% for AGIs $50k-75k, 54.5% for AGIs $75k-100k, 83.3% for AGIs over 100k)
Household received Food Stamps/SNAP in the past 12 months: 139 Household did not receive Food Stamps/SNAP in the past 12 months: 176
Women who had a birth in the past 12 months: 3 (4 now married, 0 unmarried) Women who did not have a birth in the past 12 months: 76 (24 now married, 51 unmarried)
Housing units in zip code 45160 with a mortgage: 59 (1 second mortgage, 1 both second mortgage and home equity loan) Median monthly owner costs for units with a mortgage: $918 Median monthly owner costs for units without a mortgage: $535
Residents with income below the poverty level in 2022:
This zip code:
44.4%
Whole state:
13.4%
Residents with income below 50% of the poverty level in 2022:
This zip code:
10.7%
Whole state:
7.0%
Median number of rooms in houses and condos:
Here:
6.5
State:
6.7
Median number of rooms in apartments:
Here:
4.5
State:
4.4
Notable locations in this zip code not listed on our city pages
Size of family households: 41 2-persons, 110 3-persons, 25 4-persons, 1 5-persons, 5 6-persons
Size of nonfamily households: 108 1-person, 19 2-persons
41 married couples with children.
37 single-parent households (2 men, 35 women).
99.3% of residents of 45160 zip code speak English at home.
0.5% of residents speak Spanish at home (100% well).
Foreign born population: 0 (0.0%)
:
0.0%
Whole state:
5.0%
32%German
25%American
5%English
3%Irish
1%Dutch
Facilities with environmental interests located in this zip code:
AT&T LONG LINES OWENSVILLE (1/2MI E OF JCT SR131 & 32 in OWENSVILLE, OH)
(Resource Conservation and Recovery Act (tracking hazardous waste))
Housing units lacking complete plumbing facilities: 1.7% Housing units lacking complete kitchen facilities: 1.6%
86.5%Electricity
6.2%Fuel oil, kerosene, etc.
4.3%Utility gas
2.0%Bottled, tank, or LP gas
1.6%Other fuel
Place of birth for U.S.-born residents:
This state: 547
Northeast: 2
Midwest: 1
South: 60
West: 4
59% of the 45160 zip code residents lived in the same house 5 years ago. Out of people who lived in different houses, 56% lived in this county. Out of people who lived in different counties, 50% lived in Ohio.
92% of the 45160 zip code residents lived in the same house 1 year ago. Out of people who lived in different houses, 88% moved from this county. Out of people who lived in different houses, 6% moved from different county within same state.
Private vs. public school enrollment:
Students in private schools in grades 1 to 8 (elementary and middle school): 15
Here:
15.7%
Ohio:
16.0%
Students in private schools in grades 9 to 12 (high school):
Here:
0.0%
Ohio:
13.1%
Students in private undergraduate colleges:
Here:
0.0%
Ohio:
22.3%
Occupation by median earnings in the past 12 months ($)
60,153Construction and extraction occupations
47,675Production occupations
47,437Installation, maintenance, and repair occupations
45,716Office and administrative support occupations
27,555Material moving occupations
23,032Management occupations
Top industries in this zip code by the number of employees in 2005:
Health Care and Social Assistance: Offices of All Other Miscellaneous Health Practitioners (100-249 employees: 1 establishment)
Health Care and Social Assistance: Residential Mental Retardation Facilities (10-19: 3)
Other Services (except Public Administration): Religious Organizations (20-49: 1, 1-4: 1)
Finance and Insurance: Insurance Agencies and Brokerages (10-19: 1, 5-9: 1, 1-4: 1)
Accommodation and Food Services: Limited-Service Restaurants (10-19: 1, 1-4: 1)
Home Mortgage Disclosure Act Aggregated Statistics For Year 2009 (Based on 2 partial tracts)
A) FHA, FSA/RHS & VA Home Purchase Loans
B) Conventional Home Purchase Loans
C) Refinancings
Number
Average Value
Number
Average Value
Number
Average Value
LOANS ORIGINATED
1
$77,440
1
$143,280
7
$158,663
APPLICATIONS APPROVED, NOT ACCEPTED
0
$0
0
$0
1
$95,900
APPLICATIONS DENIED
0
$0
0
$0
2
$199,620
APPLICATIONS WITHDRAWN
0
$0
0
$0
1
$234,360
FILES CLOSED FOR INCOMPLETENESS
0
$0
0
$0
0
$0
Aggregated Statistics For Year 2008 (Based on 2 partial tracts)
B) Conventional Home Purchase Loans
C) Refinancings
Number
Average Value
Number
Average Value
LOANS ORIGINATED
1
$167,150
3
$179,760
APPLICATIONS APPROVED, NOT ACCEPTED
0
$0
0
$0
APPLICATIONS DENIED
0
$0
2
$164,500
APPLICATIONS WITHDRAWN
0
$0
1
$106,670
FILES CLOSED FOR INCOMPLETENESS
0
$0
0
$0
Aggregated Statistics For Year 2007 (Based on 2 partial tracts)
B) Conventional Home Purchase Loans
C) Refinancings
D) Home Improvement Loans
Number
Average Value
Number
Average Value
Number
Average Value
LOANS ORIGINATED
2
$171,505
4
$140,750
1
$59,330
APPLICATIONS APPROVED, NOT ACCEPTED
0
$0
1
$91,760
0
$0
APPLICATIONS DENIED
0
$0
2
$168,875
1
$46,120
APPLICATIONS WITHDRAWN
0
$0
1
$84,170
0
$0
FILES CLOSED FOR INCOMPLETENESS
0
$0
1
$102,960
0
$0
Aggregated Statistics For Year 2006 (Based on 2 partial tracts)
B) Conventional Home Purchase Loans
C) Refinancings
D) Home Improvement Loans
Number
Average Value
Number
Average Value
Number
Average Value
LOANS ORIGINATED
3
$123,767
5
$153,878
1
$42,730
APPLICATIONS APPROVED, NOT ACCEPTED
0
$0
1
$150,230
0
$0
APPLICATIONS DENIED
1
$53,170
3
$139,247
0
$0
APPLICATIONS WITHDRAWN
0
$0
2
$141,860
0
$0
FILES CLOSED FOR INCOMPLETENESS
0
$0
0
$0
0
$0
Aggregated Statistics For Year 2005 (Based on 2 partial tracts)
B) Conventional Home Purchase Loans
C) Refinancings
D) Home Improvement Loans
F) Non-occupant Loans on < 5 Family Dwellings (A B C & D)
Number
Average Value
Number
Average Value
Number
Average Value
Number
Average Value
LOANS ORIGINATED
4
$132,048
5
$145,858
0
$0
1
$76,390
APPLICATIONS APPROVED, NOT ACCEPTED
0
$0
1
$139,790
0
$0
0
$0
APPLICATIONS DENIED
1
$106,740
3
$120,503
1
$15,480
0
$0
APPLICATIONS WITHDRAWN
1
$123,730
2
$144,395
0
$0
0
$0
FILES CLOSED FOR INCOMPLETENESS
0
$0
0
$0
0
$0
0
$0
Aggregated Statistics For Year 2004 (Based on 2 partial tracts)
B) Conventional Home Purchase Loans
C) Refinancings
D) Home Improvement Loans
Number
Average Value
Number
Average Value
Number
Average Value
LOANS ORIGINATED
3
$171,120
6
$116,737
1
$35,960
APPLICATIONS APPROVED, NOT ACCEPTED
0
$0
1
$173,520
0
$0
APPLICATIONS DENIED
1
$64,300
3
$101,543
0
$0
APPLICATIONS WITHDRAWN
0
$0
1
$192,240
0
$0
FILES CLOSED FOR INCOMPLETENESS
0
$0
0
$0
0
$0
Aggregated Statistics For Year 2003 (Based on 2 partial tracts)
B) Conventional Home Purchase Loans
C) Refinancings
D) Home Improvement Loans
F) Non-occupant Loans on < 5 Family Dwellings (A B C & D)
Number
Average Value
Number
Average Value
Number
Average Value
Number
Average Value
LOANS ORIGINATED
3
$122,413
14
$121,587
1
$46,980
1
$80,750
APPLICATIONS APPROVED, NOT ACCEPTED
0
$0
2
$112,430
0
$0
0
$0
APPLICATIONS DENIED
0
$0
3
$126,527
0
$0
0
$0
APPLICATIONS WITHDRAWN
0
$0
2
$86,365
0
$0
0
$0
FILES CLOSED FOR INCOMPLETENESS
0
$0
1
$65,770
0
$0
0
$0
Aggregated Statistics For Year 2002 (Based on 2 partial tracts)
B) Conventional Home Purchase Loans
C) Refinancings
D) Home Improvement Loans
F) Non-occupant Loans on < 5 Family Dwellings (A B C & D)
Number
Average Value
Number
Average Value
Number
Average Value
Number
Average Value
LOANS ORIGINATED
2
$155,160
10
$117,832
1
$32,870
1
$47,160
APPLICATIONS APPROVED, NOT ACCEPTED
0
$0
1
$131,620
0
$0
0
$0
APPLICATIONS DENIED
0
$0
3
$116,603
0
$0
0
$0
APPLICATIONS WITHDRAWN
0
$0
1
$155,660
0
$0
0
$0
FILES CLOSED FOR INCOMPLETENESS
0
$0
0
$0
0
$0
0
$0
Aggregated Statistics For Year 2001 (Based on 2 partial tracts)
B) Conventional Home Purchase Loans
C) Refinancings
D) Home Improvement Loans
F) Non-occupant Loans on < 5 Family Dwellings (A B C & D)
Number
Average Value
Number
Average Value
Number
Average Value
Number
Average Value
LOANS ORIGINATED
2
$118,870
9
$106,152
1
$18,220
1
$69,480
APPLICATIONS APPROVED, NOT ACCEPTED
0
$0
2
$91,945
0
$0
0
$0
APPLICATIONS DENIED
1
$72,680
4
$92,592
0
$0
0
$0
APPLICATIONS WITHDRAWN
0
$0
2
$88,075
0
$0
0
$0
FILES CLOSED FOR INCOMPLETENESS
0
$0
1
$61,060
0
$0
0
$0
Aggregated Statistics For Year 2000 (Based on 2 partial tracts)
B) Conventional Home Purchase Loans
C) Refinancings
D) Home Improvement Loans
Number
Average Value
Number
Average Value
Number
Average Value
LOANS ORIGINATED
2
$125,260
3
$82,957
1
$52,670
APPLICATIONS APPROVED, NOT ACCEPTED
0
$0
1
$58,140
0
$0
APPLICATIONS DENIED
1
$54,720
1
$124,990
1
$14,220
APPLICATIONS WITHDRAWN
0
$0
1
$60,950
0
$0
FILES CLOSED FOR INCOMPLETENESS
0
$0
0
$0
0
$0
Aggregated Statistics For Year 1999 (Based on 1 partial tract)
Detailed PMIC statistics for the following Tracts:0408.00
2003 - 2018 National Fire Incident Reporting System (NFIRS) incidents
Based on the data from the years 2003 - 2018 the average number of fires per year is 6. The highest number of fire incidents - 16 took place in 2004, and the least - 1 in 2016. The data has a dropping trend.
When looking into fire subcategories, the most reports belonged to: Structure Fires (52.9%), and Outside Fires (29.4%).
Fire incident types reported to NFIRS in Zip Code 45160


 Nearest zip codes: 45103, 45158, 45122, 45150, 45176, 45102.


 Based on the data from the years 2003 - 2018 the average number of fires per year is 6. The highest number of fire incidents - 16 took place in 2004, and the least - 1 in 2016. The data has a dropping trend.
 When looking into fire subcategories, the most reports belonged to: Structure Fires (52.9%), and Outside Fires (29.4%).