Estimated zip code population in 2022: 3,960 Zip code population in 2010: 3,883 Zip code population in 2000: 4,110
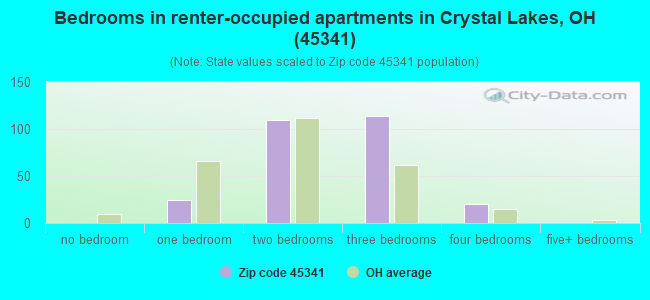
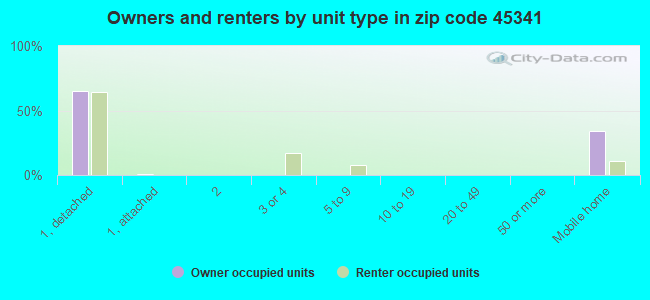
Houses and condos: 1,851 Renter-occupied apartments: 270
% of renters here:
15%
State:
33%
March 2022 cost of living index in zip code 45341: 91.2 (less than average, U.S. average is 100)
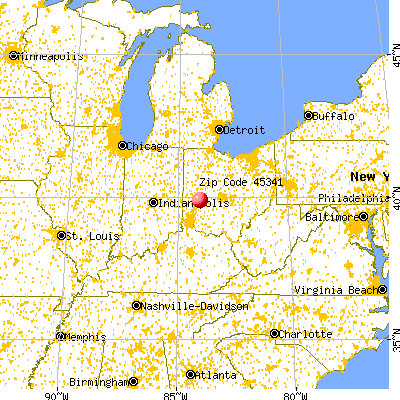
Land area: 6.1 sq. mi. Water area: 0.4 sq. mi.
Population density: 653 people per square mile
(low).
OSM Map
General Map
Google Map
MSN Map
OSM Map
General Map
Google Map
MSN Map
OSM Map
General Map
Google Map
MSN Map
OSM Map
General Map
Google Map
MSN Map
Please wait while loading the map...
Real estate property taxes paid for housing units in 2022:
This zip code:
1.3% ($1,470)
Ohio:
1.3% ($2,639)
Median real estate property taxes paid for housing units with mortgages in 2022: $1,716 (1.3%) Median real estate property taxes paid for housing units with no mortgage in 2022: $961 (1.6%)
Business Search- 14 Million verified businesses
Males: 1,850
(46.7%)
Females: 2,109
(53.3%)
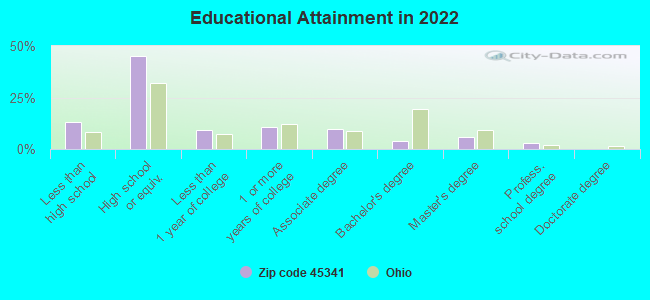
For population 25 years and over in 45341:
High school or higher: 85.4%
Bachelor's degree or higher: 12.1%
Graduate or professional degree: 8.3%
Unemployed: 4.9%
Mean travel time to work (commute): 24.6 minutes
For population 15 years and over in 45341:
Never married: 24.8%
Now married: 46.6%
Separated: 1.6%
Widowed: 10.9%
Divorced: 16.1%
Zip code 45341 compared to state average:
Median house value below state average.
Black race population percentage significantly below state average.
Median age significantly above state average.
Foreign-born population percentage significantly below state average.
Renting percentage below state average.
Percentage of population with a bachelor's degree or higher significantly below state average.
Estimated median house/condo value in 2022: $109,900
45341:
$109,900
Ohio:
$204,100
According to our research of Ohio and other state lists, there were 4 registered sex offenders living in 45341 zip code as of May 28, 2024. The ratio of all residents to sex offenders in zip code 45341 is 950 to 1. The ratio of registered sex offenders to all residents in this zip code is lower than the state average.
Median resident age:
This zip code:
48.5 years
Ohio median age:
39.9 years
Average household size:
This zip code:
2.3 people
Ohio:
2.4 people
Averages for the 2020 tax year for zip code 45341, filed in 2021:
Average Adjusted Gross Income (AGI) in 2020: $45,791 (Individual Income Tax Returns)
Here:
$45,791
State:
$67,288
Salary/wage: $40,778 (reported on 79.8% of returns)
Here:
$40,778
State:
$55,628
(% of AGI for various income ranges: 1118.3% for AGIs below $25k, 3432.4% for AGIs $25k-50k, 6137.7% for AGIs $50k-75k, 8570.8% for AGIs $75k-100k, 16212.2% for AGIs $100k-200k)
Taxable interest for individuals: $735 (reported on 26.8% of returns)
This zip code:
$735
Ohio:
$1,518
(% of AGI for various income ranges: 12.5% for AGIs below $25k, 21.3% for AGIs $25k-50k, 28.2% for AGIs $50k-75k, 51.7% for AGIs $75k-100k, 86.7% for AGIs $100k-200k)
Ordinary dividends: $2,162 (reported on 8.7% of returns)
Here:
$2,162
State:
$7,167
(% of AGI for various income ranges: 21.7% for AGIs below $25k, 11.1% for AGIs $25k-50k, 16.8% for AGIs $50k-75k, 171.1% for AGIs $100k-200k)
Net capital gain/loss in AGI: +$6,879 (reported on 7.7% of returns)
Here:
+$6,879
State:
+$18,919
(% of AGI for various income ranges: 22.8% for AGIs $25k-50k, 101.4% for AGIs $50k-75k, 706.7% for AGIs $100k-200k)
Profit/loss from business: +$7,625 (reported on 10.9% of returns)
Here:
+$7,625
State:
+$13,744
(% of AGI for various income ranges: 97.3% for AGIs below $25k, 73.0% for AGIs $25k-50k, 99.1% for AGIs $50k-75k, 326.7% for AGIs $75k-100k, 124.4% for AGIs $100k-200k)
Taxable individual retirement arrangement distribution: $12,220 (reported on 8.2% of returns)
45341:
$12,220
Ohio:
$18,876
(% of AGI for various income ranges: 43.1% for AGIs below $25k, 55.7% for AGIs $25k-50k, 152.7% for AGIs $50k-75k, 265.8% for AGIs $75k-100k, 794.4% for AGIs $100k-200k)
Total itemized deductions: $32,767 (reported on 1.6% of returns)
Here:
$32,767
State:
$33,869
(% of AGI for various income ranges: 819.2% for AGIs $75k-100k)
Charity contributions: $8,600 (reported on 1.1% of returns)
Here:
$8,600
State:
$14,577
(% of AGI for various income ranges: 37.4% for AGIs $25k-50k)
Taxes paid: $6,133 (reported on 1.6% of returns)
45341:
$6,133
State:
$7,681
(% of AGI for various income ranges: 153.3% for AGIs $75k-100k)
Earned income credit: $2,148 (reported on 18.0% of returns)
Here:
$2,148
State:
$2,304
(% of AGI for various income ranges: 85.4% for AGIs below $25k, 65.0% for AGIs $25k-50k)
Percentage of individuals using paid preparers for their 2020 taxes: 92.9%
Here:
93%
State:
94%
(% for various income ranges: 90.8% for AGIs below $25k, 96.5% for AGIs $25k-50k, 93.3% for AGIs $50k-75k, 93.8% for AGIs $75k-100k, 86.7% for AGIs $100k-200k)
Averages for the 2012 tax year for zip code 45341, filed in 2013:
Average Adjusted Gross Income (AGI) in 2012: $38,620 (Individual Income Tax Returns)
Here:
$38,620
State:
$54,926
Salary/wage: $34,837 (reported on 78.8% of returns)
Here:
$34,837
State:
$45,869
(% of AGI for various income ranges: 68.2% for AGIs below $25k, 74.2% for AGIs $25k-50k, 69.7% for AGIs $50k-75k, 78.2% for AGIs $75k-100k, 63.0% for AGIs $100k-200k)
Taxable interest for individuals: $625 (reported on 28.3% of returns)
This zip code:
$625
Ohio:
$1,297
(% of AGI for various income ranges: 0.4% for AGIs below $25k, 0.6% for AGIs $25k-50k, 0.5% for AGIs $50k-75k, 0.6% for AGIs $75k-100k, 0.1% for AGIs $100k-200k)
Ordinary dividends: $1,626 (reported on 10.3% of returns)
Here:
$1,626
State:
$5,821
(% of AGI for various income ranges: 0.6% for AGIs below $25k, 0.4% for AGIs $25k-50k, 0.6% for AGIs $50k-75k, 0.3% for AGIs $75k-100k, 0.2% for AGIs $100k-200k)
Net capital gain/loss in AGI: +$1,685 (reported on 7.1% of returns)
Here:
+$1,685
State:
+$11,232
(% of AGI for various income ranges: 0.6% for AGIs $50k-75k, 1.1% for AGIs $75k-100k)
Profit/loss from business: +$8,473 (reported on 12.0% of returns)
Here:
+$8,473
State:
+$12,773
(% of AGI for various income ranges: 6.1% for AGIs below $25k, 3.3% for AGIs $25k-50k, 2.1% for AGIs $50k-75k, 1.9% for AGIs $75k-100k)
Taxable individual retirement arrangement distribution: $7,600 (reported on 8.7% of returns)
45341:
$7,600
Ohio:
$14,511
(% of AGI for various income ranges: 3.0% for AGIs below $25k, 1.5% for AGIs $25k-50k, 1.9% for AGIs $50k-75k, 2.4% for AGIs $75k-100k)
Total itemized deductions: $16,300 (22% of AGI, reported on 18.5% of returns)
Here:
$16,300
State:
$21,278
Here:
22.4% of AGI
State:
18.8% of AGI
(% of AGI for various income ranges: 3.3% for AGIs below $25k, 6.3% for AGIs $25k-50k, 8.1% for AGIs $50k-75k, 8.5% for AGIs $75k-100k, 12.7% for AGIs $100k-200k)
Charity contributions: $3,345 (reported on 12.0% of returns)
Here:
$3,345
State:
$3,943
(% of AGI for various income ranges: 0.6% for AGIs $25k-50k, 1.3% for AGIs $50k-75k, 1.2% for AGIs $75k-100k, 2.1% for AGIs $100k-200k)
Taxes paid: $5,018 (reported on 18.5% of returns)
45341:
$5,018
State:
$9,568
(% of AGI for various income ranges: 0.6% for AGIs below $25k, 1.5% for AGIs $25k-50k, 2.6% for AGIs $50k-75k, 3.1% for AGIs $75k-100k, 4.2% for AGIs $100k-200k)
Earned income credit: $2,197 (reported on 20.7% of returns)
Here:
$2,197
State:
$2,285
(% of AGI for various income ranges: 6.1% for AGIs below $25k, 1.0% for AGIs $25k-50k)
Percentage of individuals using paid preparers for their 2012 taxes: 42.4%
Here:
42%
State:
51%
(% for various income ranges: 37.8% for AGIs below $25k, 46.2% for AGIs $25k-50k, 48.0% for AGIs $50k-75k, 37.5% for AGIs $75k-100k, 55.6% for AGIs $100k-200k)
Averages for the 2004 tax year for zip code 45341, filed in 2005:
Average Adjusted Gross Income (AGI) in 2004: $34,274 (Individual Income Tax Returns)
Here:
$34,274
State:
$44,480
Salary/wage: $30,552 (reported on 83.1% of returns)
Here:
$30,552
State:
$39,198
(% of AGI for various income ranges: 84.8% for AGIs below $10k, 67.6% for AGIs $10k-25k, 71.8% for AGIs $25k-50k, 77.5% for AGIs $50k-75k, 81.4% for AGIs $75k-100k, 69.2% for AGIs over 100k)
Taxable interest for individuals: $1,080 (reported on 37.5% of returns)
This zip code:
$1,080
Ohio:
$1,532
(% of AGI for various income ranges: 1.8% for AGIs below $10k, 1.7% for AGIs $10k-25k, 1.6% for AGIs $25k-50k, 1.0% for AGIs $50k-75k, 0.7% for AGIs $75k-100k, 0.2% for AGIs over 100k)
Taxable dividends: $942 (reported on 15.5% of returns)
Here:
$942
State:
$3,496
(% of AGI for various income ranges: 1.0% for AGIs below $10k, 0.8% for AGIs $10k-25k, 0.4% for AGIs $25k-50k, 0.4% for AGIs $50k-75k, 0.2% for AGIs $75k-100k, 0.2% for AGIs over 100k)
Net capital gain/loss: +$744 (reported on 10.7% of returns)
Here:
+$744
State:
+$8,582
(% of AGI for various income ranges: -1.4% for AGIs below $10k, -0.3% for AGIs $10k-25k, 0.6% for AGIs $25k-50k, 0.1% for AGIs $50k-75k, 0.1% for AGIs $75k-100k, 0.8% for AGIs over 100k)
Profit/loss from business: +$6,328 (reported on 10.5% of returns)
Here:
+$6,328
State:
+$10,813
(% of AGI for various income ranges: -0.5% for AGIs below $10k, 4.5% for AGIs $10k-25k, 2.1% for AGIs $25k-50k, 1.7% for AGIs $50k-75k, -0.0% for AGIs $75k-100k, 1.5% for AGIs over 100k)
IRA payment deduction: $2,350 (reported on 1.1% of returns)
45341:
$2,350
Ohio:
$2,794
Total itemized deductions: $12,657 (22% of AGI, reported on 25.6% of returns)
Here:
$12,657
State:
$17,503
Here:
21.9% of AGI
State:
20.8% of AGI
(% of AGI for various income ranges: 5.3% for AGIs $10k-25k, 8.8% for AGIs $25k-50k, 10.3% for AGIs $50k-75k, 12.8% for AGIs $75k-100k, 12.5% for AGIs over 100k)
Charity contributions deductions: $2,028 (3% of AGI, reported on 19.1% of returns)
Here:
$2,028
State:
$3,087
Here:
3.2% of AGI
State:
3.4% of AGI
(% of AGI for various income ranges: 0.6% for AGIs $10k-25k, 0.8% for AGIs $25k-50k, 1.5% for AGIs $50k-75k, 1.8% for AGIs $75k-100k, 1.2% for AGIs over 100k)
Total tax: $3,879 (reported on 76.5% of returns)
45341:
$3,879
State:
$6,781
(% of AGI for various income ranges: 2.0% for AGIs below $10k, 3.9% for AGIs $10k-25k, 7.3% for AGIs $25k-50k, 9.8% for AGIs $50k-75k, 10.8% for AGIs $75k-100k, 15.3% for AGIs over 100k)
Earned income credit: $1,714 (reported on 14.6% of returns)
Here:
$1,714
State:
$1,696
Percentage of individuals using paid preparers for their 2004 taxes: 51.5%
Here:
51%
State:
55%
(% for various income ranges: 38.9% for AGIs below $10k, 55.8% for AGIs $10k-25k, 55.9% for AGIs $25k-50k, 51.3% for AGIs $50k-75k, 46.4% for AGIs $75k-100k, 41.2% for AGIs over 100k)
Size of family households: 601 2-persons, 209 3-persons, 238 4-persons, 81 5-persons, 12 6-persons
Size of nonfamily households: 546 1-person, 50 2-persons, 15 3-persons
266 married couples with children.
412 single-parent households (113 men, 299 women).
98.7% of residents of 45341 zip code speak English at home.
1.4% of residents speak Spanish at home (56% very well, 22% well, 22% not at all).
0.1% of residents speak other Indo-European language at home (100% very well).
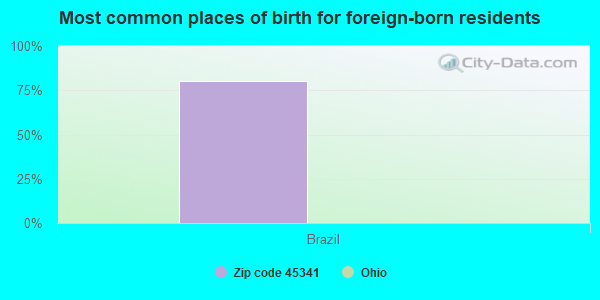
Foreign born population: 10 (0.3%) (100.0% of them are naturalized citizens)
This zip code:
0.3%
Whole state:
5.0%
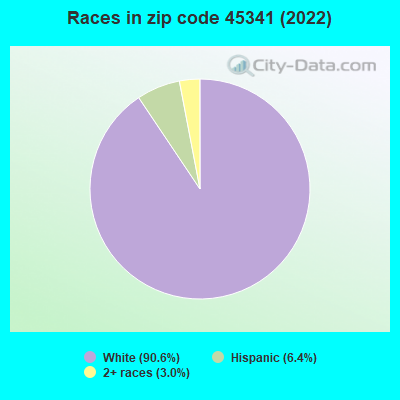
80%Brazil
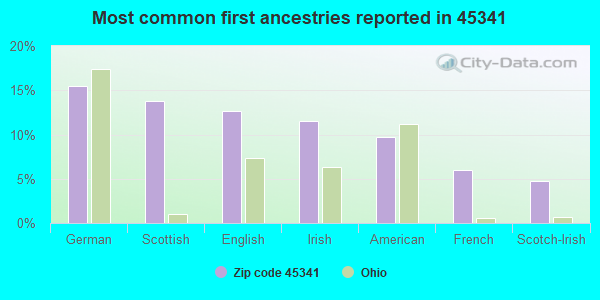
15%German
14%Scottish
13%English
11%Irish
10%American
6%French
5%Scotch-Irish
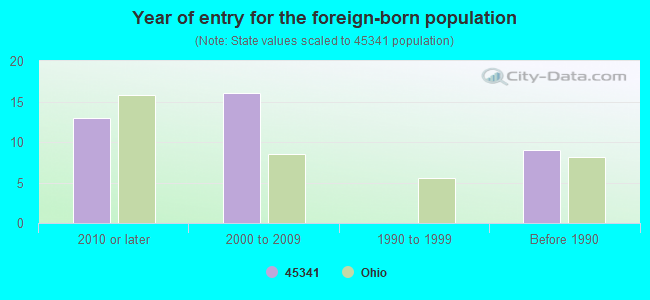
Year of entry for the foreign-born population
132010 or later
162000 to 2009
01990 to 1999
9Before 1990
Facilities with environmental interests located in this zip code:
BP PIPELINES NA MEDWAY TANK FARM * (4741 OSBORN ROAD in MEDWAY, OH)
STATE MASTER (Ohio general info) - PCS-OH0108812, National Pollutant Discharge Elimination System Permit, AIR MAJOR STATE MASTER (Ohio general info) - RCRA-OHD000773044, HAZARDOUS WASTE PROGRAM HAZARDOUS WASTE BIENNIAL REPORTER (Resource Conservation and Recovery Act (tracking hazardous waste)) Large Quantity Generators, more that 1000 kg of hazardous waste/month (Resource Conservation and Recovery Act (tracking hazardous waste)) Business SIC classification: REFINED PETROLEUM PIPELINES Organizations: BP PIPELINES N.A. (CONTACT/OPERATOR)
Alternative names: BP EXPLORATION AND OIL INC, BP EXPLORATION AND OIL MEDWAY, MEDWAY TERMINAL *
Housing units lacking complete plumbing facilities: 3.1% Housing units lacking complete kitchen facilities: 2.8%
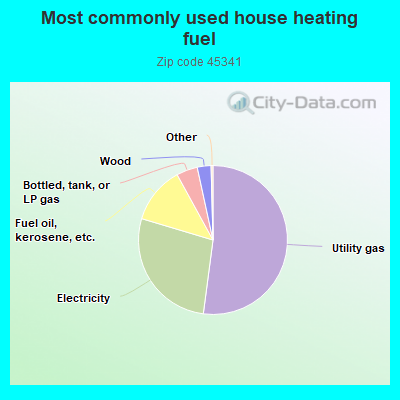
52.2%Utility gas
27.6%Electricity
12.4%Fuel oil, kerosene, etc.
4.6%Bottled, tank, or LP gas
3.0%Wood
Population in 1990: 4,385.
Place of birth for U.S.-born residents:
This state: 3,142
Northeast: 87
Midwest: 116
South: 527
West: 33
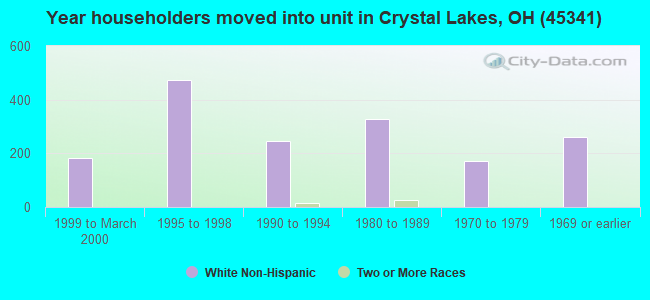
60% of the 45341 zip code residents lived in the same house 5 years ago. Out of people who lived in different houses, 49% lived in this county. Out of people who lived in different counties, 50% lived in Ohio.
91% of the 45341 zip code residents lived in the same house 1 year ago. Out of people who lived in different houses, 41% moved from this county. Out of people who lived in different houses, 45% moved from different county within same state. Out of people who lived in different houses, 15% moved from different state.
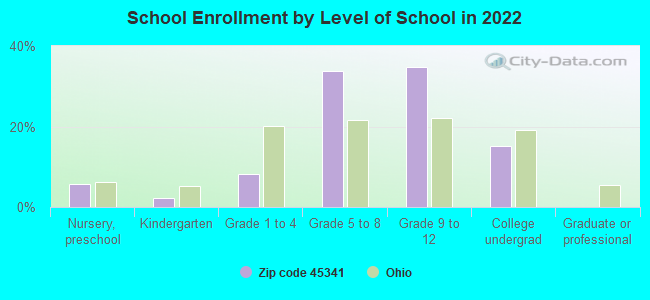
Private vs. public school enrollment:
Students in private schools in grades 1 to 8 (elementary and middle school): 70
Here:
18.2%
Ohio:
16.0%
Students in private schools in grades 9 to 12 (high school): 33
Here:
10.4%
Ohio:
13.1%
Students in private undergraduate colleges: 33
Here:
23.8%
Ohio:
22.3%
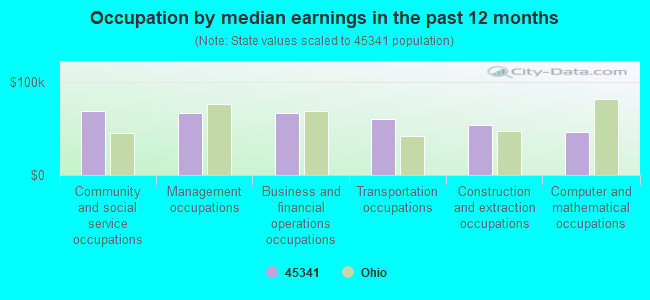
Occupation by median earnings in the past 12 months ($)
68,957Community and social service occupations
66,878Management occupations
66,386Business and financial operations occupations
60,649Transportation occupations
53,398Construction and extraction occupations
46,369Computer and mathematical occupations
Companies with federal contracts located in this zip code:
AERO COMPOSITES, L L C (3400 SPANGLER RD in MEDWAY, OH; small business) : $98,800 in 3 contractsfrom 1999 to 2005
$35,199 with Navy for Other Defense -- Applied Research and Exploratory Development (R&D). Signed on 2002-01-03. Completion date: 2002-01-23.
$34,245, same as above.Signed on 2005-02-18. Completion date: 2005-03-31.
$29,356 with Navy for Defense Aircraft -- Applied Research and Exploratory Development (R&D). Signed on 1999-12-09. Completion date: 2000-02-14.
Top industries in this zip code by the number of employees in 2005:
Wholesale Trade: Electrical Apparatus and Equipment, Wiring Supplies, and Related Equipment Merchant Wholesalers (20-49 employees: 1 establishment)
Construction: Other Building Finishing Contractors (20-49: 1)
Accommodation and Food Services: Full-Service Restaurants (10-19: 1)
Other Services (except Public Administration): Religious Organizations (5-9: 1, 1-4: 4)
Mining: Construction Sand and Gravel Mining (10-19: 1)
Construction: Poured Concrete Foundation and Structure Contractors (10-19: 1)
Educational Services: Apprenticeship Training (10-19: 1)
People in group quarters in 2000:
33 people in other noninstitutional group quarters
Fatal accident statistics in 2013:
Fatal accident count: 1
Vehicles involved in fatal accidents: 1
Fatal accidents caused by drunken drivers: 1
Fatalities: 1
Persons involved in fatal accidents: 1
Pedestrians involved in fatal accidents: 0
Fatal accident statistics in 2011:
Fatal accident count: 1
Vehicles involved in fatal accidents: 2
Fatal accidents caused by drunken drivers: 0
Fatalities: 1
Persons involved in fatal accidents: 2
Pedestrians involved in fatal accidents: 0
Home Mortgage Disclosure Act Aggregated Statistics For Year 2009 (Based on 4 partial tracts)
A) FHA, FSA/RHS & VA Home Purchase Loans
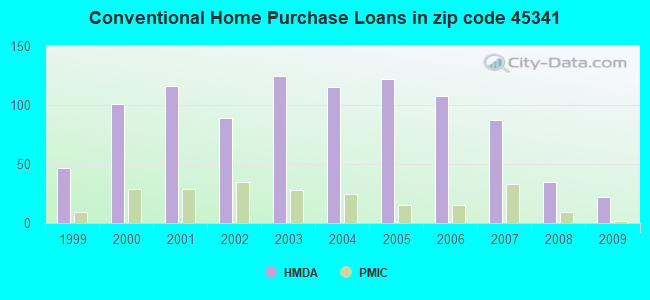
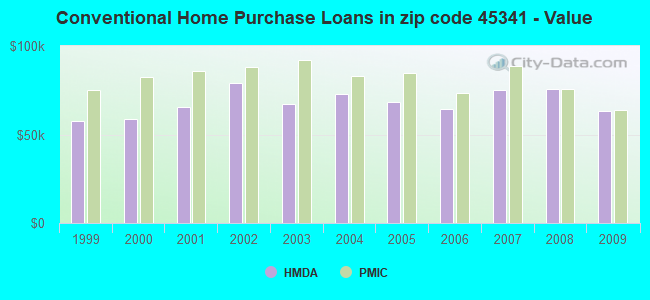
B) Conventional Home Purchase Loans
C) Refinancings
D) Home Improvement Loans
F) Non-occupant Loans on < 5 Family Dwellings (A B C & D)
G) Loans On Manufactured Home Dwelling (A B C & D)
Number
Average Value
Number
Average Value
Number
Average Value
Number
Average Value
Number
Average Value
Number
Average Value
LOANS ORIGINATED
50
$90,225
22
$63,184
144
$82,321
14
$12,382
19
$52,864
4
$60,785
APPLICATIONS APPROVED, NOT ACCEPTED
6
$92,100
6
$46,357
25
$95,264
4
$5,988
0
$0
6
$26,708
APPLICATIONS DENIED
7
$66,191
8
$53,416
42
$84,032
13
$8,674
5
$57,056
4
$58,482
APPLICATIONS WITHDRAWN
4
$60,785
0
$0
43
$90,539
1
$4,320
4
$77,825
0
$0
FILES CLOSED FOR INCOMPLETENESS
0
$0
2
$17,500
8
$79,660
0
$0
1
$27,020
2
$17,500
Aggregated Statistics For Year 2008 (Based on 4 partial tracts)
A) FHA, FSA/RHS & VA Home Purchase Loans
B) Conventional Home Purchase Loans
C) Refinancings
D) Home Improvement Loans
F) Non-occupant Loans on < 5 Family Dwellings (A B C & D)
G) Loans On Manufactured Home Dwelling (A B C & D)
Number
Average Value
Number
Average Value
Number
Average Value
Number
Average Value
Number
Average Value
Number
Average Value
LOANS ORIGINATED
50
$93,401
35
$75,648
92
$80,909
27
$19,822
18
$49,199
6
$39,910
APPLICATIONS APPROVED, NOT ACCEPTED
5
$60,616
11
$96,789
7
$112,079
6
$4,183
0
$0
4
$9,670
APPLICATIONS DENIED
19
$84,311
12
$68,976
119
$84,498
23
$25,991
7
$44,051
12
$69,174
APPLICATIONS WITHDRAWN
1
$82,140
2
$269,930
50
$105,654
1
$97,810
1
$25,940
0
$0
FILES CLOSED FOR INCOMPLETENESS
2
$54,340
1
$75,660
13
$102,436
1
$22,700
1
$47,010
0
$0
Aggregated Statistics For Year 2007 (Based on 4 partial tracts)
A) FHA, FSA/RHS & VA Home Purchase Loans
B) Conventional Home Purchase Loans
C) Refinancings
D) Home Improvement Loans
E) Loans on Dwellings For 5+ Families
F) Non-occupant Loans on < 5 Family Dwellings (A B C & D)
G) Loans On Manufactured Home Dwelling (A B C & D)
Number
Average Value
Number
Average Value
Number
Average Value
Number
Average Value
Number
Average Value
Number
Average Value
Number
Average Value
LOANS ORIGINATED
33
$76,432
87
$75,093
115
$86,909
34
$23,936
2
$1,026,915
20
$71,820
7
$26,840
APPLICATIONS APPROVED, NOT ACCEPTED
1
$49,720
8
$61,085
34
$86,218
7
$50,173
0
$0
0
$0
7
$79,206
APPLICATIONS DENIED
10
$76,466
44
$80,180
179
$83,857
31
$34,216
0
$0
12
$78,836
9
$11,461
APPLICATIONS WITHDRAWN
0
$0
10
$106,674
56
$100,622
6
$35,612
0
$0
0
$0
0
$0
FILES CLOSED FOR INCOMPLETENESS
1
$59,980
6
$83,562
18
$90,787
1
$8,110
0
$0
2
$52,150
0
$0
Aggregated Statistics For Year 2006 (Based on 4 partial tracts)
A) FHA, FSA/RHS & VA Home Purchase Loans
B) Conventional Home Purchase Loans
C) Refinancings
D) Home Improvement Loans
E) Loans on Dwellings For 5+ Families
F) Non-occupant Loans on < 5 Family Dwellings (A B C & D)
G) Loans On Manufactured Home Dwelling (A B C & D)
Number
Average Value
Number
Average Value
Number
Average Value
Number
Average Value
Number
Average Value
Number
Average Value
Number
Average Value
LOANS ORIGINATED
40
$110,416
108
$64,147
148
$76,107
44
$28,692
1
$2,700
30
$76,153
11
$33,658
APPLICATIONS APPROVED, NOT ACCEPTED
2
$81,050
38
$61,443
57
$80,851
4
$21,370
0
$0
7
$58,059
6
$30,087
APPLICATIONS DENIED
5
$132,642
45
$58,590
163
$93,698
37
$39,157
2
$1,026,915
19
$86,923
9
$46,630
APPLICATIONS WITHDRAWN
4
$96,705
13
$76,270
92
$93,574
5
$53,420
0
$0
1
$44,850
2
$127,100
FILES CLOSED FOR INCOMPLETENESS
2
$58,025
8
$93,995
34
$121,847
2
$46,050
0
$0
0
$0
0
$0
Aggregated Statistics For Year 2005 (Based on 4 partial tracts)
A) FHA, FSA/RHS & VA Home Purchase Loans
B) Conventional Home Purchase Loans
C) Refinancings
D) Home Improvement Loans
F) Non-occupant Loans on < 5 Family Dwellings (A B C & D)
G) Loans On Manufactured Home Dwelling (A B C & D)
Number
Average Value
Number
Average Value
Number
Average Value
Number
Average Value
Number
Average Value
Number
Average Value
LOANS ORIGINATED
38
$102,398
122
$68,484
155
$89,046
39
$40,430
39
$61,732
22
$32,486
APPLICATIONS APPROVED, NOT ACCEPTED
4
$119,050
32
$60,537
55
$83,861
5
$17,724
13
$84,448
18
$31,627
APPLICATIONS DENIED
2
$78,510
43
$58,957
280
$89,406
38
$32,727
15
$67,624
18
$25,999
APPLICATIONS WITHDRAWN
2
$58,025
17
$69,218
98
$88,289
16
$114,389
3
$98,877
4
$39,142
FILES CLOSED FOR INCOMPLETENESS
0
$0
8
$90,468
50
$98,943
2
$19,340
0
$0
4
$53,878
Aggregated Statistics For Year 2004 (Based on 4 partial tracts)
A) FHA, FSA/RHS & VA Home Purchase Loans
B) Conventional Home Purchase Loans
C) Refinancings
D) Home Improvement Loans
F) Non-occupant Loans on < 5 Family Dwellings (A B C & D)
G) Loans On Manufactured Home Dwelling (A B C & D)
Number
Average Value
Number
Average Value
Number
Average Value
Number
Average Value
Number
Average Value
Number
Average Value
LOANS ORIGINATED
41
$99,071
115
$72,762
235
$77,672
45
$31,595
30
$64,035
12
$34,256
APPLICATIONS APPROVED, NOT ACCEPTED
2
$92,705
32
$45,559
69
$75,640
5
$23,252
6
$62,843
15
$26,033
APPLICATIONS DENIED
6
$101,062
67
$53,947
200
$87,443
35
$19,463
31
$78,086
26
$34,573
APPLICATIONS WITHDRAWN
4
$100,850
22
$87,347
114
$82,426
14
$73,854
6
$61,570
2
$55,260
FILES CLOSED FOR INCOMPLETENESS
4
$98,462
2
$88,295
26
$87,142
1
$105,380
0
$0
1
$30,800
Aggregated Statistics For Year 2003 (Based on 4 partial tracts)
A) FHA, FSA/RHS & VA Home Purchase Loans
B) Conventional Home Purchase Loans
C) Refinancings
D) Home Improvement Loans
F) Non-occupant Loans on < 5 Family Dwellings (A B C & D)
Number
Average Value
Number
Average Value
Number
Average Value
Number
Average Value
Number
Average Value
LOANS ORIGINATED
27
$89,185
125
$67,257
418
$76,107
26
$16,028
26
$54,400
APPLICATIONS APPROVED, NOT ACCEPTED
2
$60,795
32
$48,377
94
$85,615
21
$19,261
10
$61,432
APPLICATIONS DENIED
4
$101,852
44
$74,088
272
$75,551
40
$11,914
19
$123,923
APPLICATIONS WITHDRAWN
3
$67,040
5
$96,030
131
$85,074
6
$15,978
6
$66,448
FILES CLOSED FOR INCOMPLETENESS
2
$98,990
8
$74,475
43
$73,383
2
$64,470
1
$27,020
Aggregated Statistics For Year 2002 (Based on 4 partial tracts)
A) FHA, FSA/RHS & VA Home Purchase Loans
B) Conventional Home Purchase Loans
C) Refinancings
D) Home Improvement Loans
F) Non-occupant Loans on < 5 Family Dwellings (A B C & D)
Number
Average Value
Number
Average Value
Number
Average Value
Number
Average Value
Number
Average Value
LOANS ORIGINATED
46
$80,255
89
$79,177
308
$80,920
39
$13,319
16
$53,608
APPLICATIONS APPROVED, NOT ACCEPTED
3
$94,353
22
$39,647
84
$82,421
17
$43,962
6
$30,978
APPLICATIONS DENIED
6
$98,240
62
$37,217
248
$75,535
39
$10,914
3
$63,110
APPLICATIONS WITHDRAWN
0
$0
4
$122,432
122
$78,685
8
$34,752
3
$98,210
FILES CLOSED FOR INCOMPLETENESS
4
$72,760
4
$90,315
29
$77,837
0
$0
0
$0
Aggregated Statistics For Year 2001 (Based on 4 partial tracts)
A) FHA, FSA/RHS & VA Home Purchase Loans
B) Conventional Home Purchase Loans
C) Refinancings
D) Home Improvement Loans
F) Non-occupant Loans on < 5 Family Dwellings (A B C & D)
Number
Average Value
Number
Average Value
Number
Average Value
Number
Average Value
Number
Average Value
LOANS ORIGINATED
53
$81,628
116
$65,412
318
$69,804
72
$15,241
35
$59,498
APPLICATIONS APPROVED, NOT ACCEPTED
4
$95,928
29
$33,960
93
$71,502
13
$10,306
8
$72,655
APPLICATIONS DENIED
3
$79,490
50
$34,717
204
$69,374
67
$12,615
17
$52,369
APPLICATIONS WITHDRAWN
1
$55,120
6
$83,252
122
$77,015
13
$19,395
2
$89,780
FILES CLOSED FOR INCOMPLETENESS
0
$0
1
$49,180
21
$76,978
0
$0
0
$0
Aggregated Statistics For Year 2000 (Based on 4 partial tracts)
A) FHA, FSA/RHS & VA Home Purchase Loans
B) Conventional Home Purchase Loans
C) Refinancings
D) Home Improvement Loans
F) Non-occupant Loans on < 5 Family Dwellings (A B C & D)
Number
Average Value
Number
Average Value
Number
Average Value
Number
Average Value
Number
Average Value
LOANS ORIGINATED
45
$71,795
101
$58,821
159
$66,775
77
$18,418
17
$38,885
APPLICATIONS APPROVED, NOT ACCEPTED
2
$89,335
38
$57,745
67
$56,926
13
$15,048
4
$44,208
APPLICATIONS DENIED
5
$84,464
50
$25,098
134
$66,244
63
$9,705
4
$43,138
APPLICATIONS WITHDRAWN
0
$0
6
$81,192
59
$71,767
4
$15,548
5
$64,866
FILES CLOSED FOR INCOMPLETENESS
0
$0
1
$26,480
15
$75,987
0
$0
0
$0
Aggregated Statistics For Year 1999 (Based on 2 partial tracts)
A) FHA, FSA/RHS & VA Home Purchase Loans
B) Conventional Home Purchase Loans
C) Refinancings
D) Home Improvement Loans
F) Non-occupant Loans on < 5 Family Dwellings (A B C & D)
Detailed PMIC statistics for the following Tracts:0029.01
, 0029.02
2002 - 2018 National Fire Incident Reporting System (NFIRS) incidents
Based on the data from the years 2002 - 2018 the average number of fire incidents per year is 25. The highest number of reported fire incidents - 41 took place in 2011, and the least - 10 in 2018. The data has a declining trend.
When looking into fire subcategories, the most reports belonged to: Outside Fires (45.5%), and Structure Fires (39.9%).
Fire incident types reported to NFIRS in Zip Code 45341


 Nearest zip codes: 45433, 45324, 45344, 45319, 45424, 45323.


 Based on the data from the years 2002 - 2018 the average number of fire incidents per year is 25. The highest number of reported fire incidents - 41 took place in 2011, and the least - 10 in 2018. The data has a declining trend.
 When looking into fire subcategories, the most reports belonged to: Outside Fires (45.5%), and Structure Fires (39.9%).