Estimated zip code population in 2022: 6,442 Zip code population in 2010: 7,037 Zip code population in 2000: 7,143
Houses and condos: 2,974 Renter-occupied apartments: 711
% of renters here:
25%
State:
33%
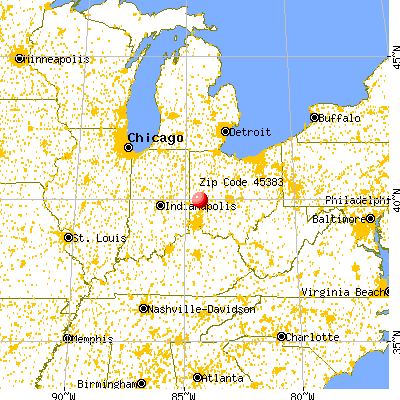
March 2022 cost of living index in zip code 45383: 93.6 (less than average, U.S. average is 100)
Land area: 26.1 sq. mi. Water area: 0.1 sq. mi.
Population density: 247 people per square mile
(very low).
OSM Map
General Map
Google Map
MSN Map
OSM Map
General Map
Google Map
MSN Map
OSM Map
General Map
Google Map
MSN Map
OSM Map
General Map
Google Map
MSN Map
Please wait while loading the map...
Real estate property taxes paid for housing units in 2022:
This zip code:
1.1% ($1,678)
Ohio:
1.3% ($2,639)
Median real estate property taxes paid for housing units with mortgages in 2022: $1,664 (1.0%) Median real estate property taxes paid for housing units with no mortgage in 2022: $1,703 (1.3%)
Estimated median house/condo value in 2022: $155,998
45383:
$155,998
Ohio:
$204,100
According to our research of Ohio and other state lists, there were 10 registered sex offenders living in 45383 zip code as of May 28, 2024. The ratio of all residents to sex offenders in zip code 45383 is 750 to 1. The ratio of registered sex offenders to all residents in this zip code is lower than the state average.
Median resident age:
This zip code:
44.9 years
Ohio median age:
39.9 years
Average household size:
This zip code:
2.2 people
Ohio:
2.4 people
Averages for the 2020 tax year for zip code 45383, filed in 2021:
Average Adjusted Gross Income (AGI) in 2020: $52,823 (Individual Income Tax Returns)
Here:
$52,823
State:
$67,288
Salary/wage: $44,922 (reported on 80.9% of returns)
Here:
$44,922
State:
$55,628
(% of AGI for various income ranges: 1075.1% for AGIs below $25k, 3609.6% for AGIs $25k-50k, 6571.4% for AGIs $50k-75k, 9302.3% for AGIs $75k-100k, 16631.0% for AGIs $100k-200k)
Taxable interest for individuals: $752 (reported on 29.3% of returns)
This zip code:
$752
Ohio:
$1,518
(% of AGI for various income ranges: 12.5% for AGIs below $25k, 13.2% for AGIs $25k-50k, 29.3% for AGIs $50k-75k, 57.3% for AGIs $75k-100k, 89.0% for AGIs $100k-200k)
Ordinary dividends: $3,225 (reported on 15.2% of returns)
Here:
$3,225
State:
$7,167
(% of AGI for various income ranges: 23.2% for AGIs below $25k, 37.3% for AGIs $25k-50k, 59.5% for AGIs $50k-75k, 71.8% for AGIs $75k-100k, 262.9% for AGIs $100k-200k)
Net capital gain/loss in AGI: +$5,298 (reported on 12.9% of returns)
Here:
+$5,298
State:
+$18,919
(% of AGI for various income ranges: 9.0% for AGIs below $25k, 19.3% for AGIs $25k-50k, 58.8% for AGIs $50k-75k, 140.5% for AGIs $75k-100k, 510.5% for AGIs $100k-200k)
Profit/loss from business: +$9,839 (reported on 12.9% of returns)
Here:
+$9,839
State:
+$13,744
(% of AGI for various income ranges: 94.1% for AGIs below $25k, 85.0% for AGIs $25k-50k, 102.1% for AGIs $50k-75k, 275.0% for AGIs $75k-100k, 911.0% for AGIs $100k-200k)
Taxable individual retirement arrangement distribution: $13,724 (reported on 12.0% of returns)
45383:
$13,724
Ohio:
$18,876
(% of AGI for various income ranges: 97.0% for AGIs below $25k, 131.1% for AGIs $25k-50k, 213.0% for AGIs $50k-75k, 359.1% for AGIs $75k-100k, 1040.5% for AGIs $100k-200k)
Total itemized deductions: $32,500 (reported on 2.6% of returns)
Here:
$32,500
State:
$33,869
(% of AGI for various income ranges: 302.3% for AGIs $50k-75k, 773.8% for AGIs $100k-200k)
Charity contributions: $8,743 (reported on 2.1% of returns)
Here:
$8,743
State:
$14,577
(% of AGI for various income ranges: 23.5% for AGIs $50k-75k, 243.3% for AGIs $100k-200k)
Taxes paid: $7,378 (reported on 2.6% of returns)
45383:
$7,378
State:
$7,681
(% of AGI for various income ranges: 64.2% for AGIs $50k-75k, 184.8% for AGIs $100k-200k)
Earned income credit: $2,090 (reported on 15.0% of returns)
Here:
$2,090
State:
$2,304
(% of AGI for various income ranges: 86.5% for AGIs below $25k, 51.8% for AGIs $25k-50k)
Percentage of individuals using paid preparers for their 2020 taxes: 94.4%
Here:
94%
State:
94%
(% for various income ranges: 93.8% for AGIs below $25k, 95.8% for AGIs $25k-50k, 93.3% for AGIs $50k-75k, 93.8% for AGIs $75k-100k, 94.7% for AGIs $100k-200k, 100.0% for AGIs over 200k)
Averages for the 2012 tax year for zip code 45383, filed in 2013:
Average Adjusted Gross Income (AGI) in 2012: $43,919 (Individual Income Tax Returns)
Here:
$43,919
State:
$54,926
Salary/wage: $38,269 (reported on 82.3% of returns)
Here:
$38,269
State:
$45,869
(% of AGI for various income ranges: 68.4% for AGIs below $25k, 75.0% for AGIs $25k-50k, 76.2% for AGIs $50k-75k, 76.0% for AGIs $75k-100k, 78.2% for AGIs $100k-200k, 35.4% for AGIs over 200k)
Taxable interest for individuals: $741 (reported on 32.0% of returns)
This zip code:
$741
Ohio:
$1,297
(% of AGI for various income ranges: 1.3% for AGIs below $25k, 0.6% for AGIs $25k-50k, 0.4% for AGIs $50k-75k, 0.4% for AGIs $75k-100k, 0.4% for AGIs $100k-200k, 0.3% for AGIs over 200k)
Ordinary dividends: $2,119 (reported on 16.2% of returns)
Here:
$2,119
State:
$5,821
(% of AGI for various income ranges: 1.1% for AGIs below $25k, 0.7% for AGIs $25k-50k, 0.4% for AGIs $50k-75k, 0.7% for AGIs $75k-100k, 1.7% for AGIs $100k-200k)
Net capital gain/loss in AGI: +$2,170 (reported on 11.3% of returns)
Here:
+$2,170
State:
+$11,232
(% of AGI for various income ranges: 0.2% for AGIs $25k-50k, 0.5% for AGIs $50k-75k, 0.2% for AGIs $75k-100k, 2.7% for AGIs $100k-200k)
Profit/loss from business: +$8,908 (reported on 11.9% of returns)
Here:
+$8,908
State:
+$12,773
(% of AGI for various income ranges: 4.9% for AGIs below $25k, 2.2% for AGIs $25k-50k, 1.9% for AGIs $50k-75k, 2.7% for AGIs $75k-100k, 2.7% for AGIs $100k-200k)
Taxable individual retirement arrangement distribution: $9,415 (reported on 12.2% of returns)
45383:
$9,415
Ohio:
$14,511
(% of AGI for various income ranges: 4.8% for AGIs below $25k, 2.4% for AGIs $25k-50k, 2.4% for AGIs $50k-75k, 3.1% for AGIs $75k-100k, 2.7% for AGIs $100k-200k)
Total itemized deductions: $16,659 (21% of AGI, reported on 26.2% of returns)
Here:
$16,659
State:
$21,278
Here:
20.9% of AGI
State:
18.8% of AGI
(% of AGI for various income ranges: 7.2% for AGIs below $25k, 7.5% for AGIs $25k-50k, 10.0% for AGIs $50k-75k, 12.0% for AGIs $75k-100k, 12.8% for AGIs $100k-200k, 10.4% for AGIs over 200k)
Charity contributions: $3,548 (reported on 18.3% of returns)
Here:
$3,548
State:
$3,943
(% of AGI for various income ranges: 0.8% for AGIs below $25k, 0.8% for AGIs $25k-50k, 1.5% for AGIs $50k-75k, 1.7% for AGIs $75k-100k, 2.2% for AGIs $100k-200k, 2.5% for AGIs over 200k)
Taxes paid: $6,694 (reported on 26.5% of returns)
45383:
$6,694
State:
$9,568
(% of AGI for various income ranges: 1.3% for AGIs below $25k, 2.1% for AGIs $25k-50k, 3.5% for AGIs $50k-75k, 4.8% for AGIs $75k-100k, 6.3% for AGIs $100k-200k, 8.5% for AGIs over 200k)
Earned income credit: $2,078 (reported on 16.5% of returns)
Here:
$2,078
State:
$2,285
(% of AGI for various income ranges: 4.9% for AGIs below $25k, 1.0% for AGIs $25k-50k)
Percentage of individuals using paid preparers for their 2012 taxes: 49.7%
Here:
50%
State:
51%
(% for various income ranges: 41.2% for AGIs below $25k, 54.8% for AGIs $25k-50k, 53.8% for AGIs $50k-75k, 58.1% for AGIs $75k-100k, 55.6% for AGIs $100k-200k, 66.7% for AGIs over 200k)
Averages for the 2004 tax year for zip code 45383, filed in 2005:
Average Adjusted Gross Income (AGI) in 2004: $37,719 (Individual Income Tax Returns)
Here:
$37,719
State:
$44,480
Salary/wage: $34,328 (reported on 87.2% of returns)
Here:
$34,328
State:
$39,198
(% of AGI for various income ranges: 127.7% for AGIs below $10k, 72.0% for AGIs $10k-25k, 79.7% for AGIs $25k-50k, 83.5% for AGIs $50k-75k, 85.5% for AGIs $75k-100k, 66.2% for AGIs over 100k)
Taxable interest for individuals: $1,397 (reported on 41.0% of returns)
This zip code:
$1,397
Ohio:
$1,532
(% of AGI for various income ranges: 6.9% for AGIs below $10k, 2.8% for AGIs $10k-25k, 1.3% for AGIs $25k-50k, 1.0% for AGIs $50k-75k, 0.7% for AGIs $75k-100k, 2.0% for AGIs over 100k)
Taxable dividends: $1,623 (reported on 21.1% of returns)
Here:
$1,623
State:
$3,496
(% of AGI for various income ranges: 2.7% for AGIs below $10k, 1.1% for AGIs $10k-25k, 0.6% for AGIs $25k-50k, 1.2% for AGIs $50k-75k, 0.5% for AGIs $75k-100k, 1.1% for AGIs over 100k)
Net capital gain/loss: +$5,934 (reported on 14.4% of returns)
Here:
+$5,934
State:
+$8,582
(% of AGI for various income ranges: -1.3% for AGIs below $10k, 0.6% for AGIs $10k-25k, 0.3% for AGIs $25k-50k, 1.2% for AGIs $50k-75k, 0.3% for AGIs $75k-100k, 11.4% for AGIs over 100k)
Profit/loss from business: +$7,144 (reported on 12.6% of returns)
Here:
+$7,144
State:
+$10,813
(% of AGI for various income ranges: 1.1% for AGIs below $10k, 3.4% for AGIs $10k-25k, 2.3% for AGIs $25k-50k, 2.4% for AGIs $50k-75k, 2.1% for AGIs $75k-100k, 2.3% for AGIs over 100k)
IRA payment deduction: $3,101 (reported on 2.0% of returns)
45383:
$3,101
Ohio:
$2,794
Total itemized deductions: $13,749 (22% of AGI, reported on 33.9% of returns)
Here:
$13,749
State:
$17,503
Here:
22.2% of AGI
State:
20.8% of AGI
(% of AGI for various income ranges: 12.8% for AGIs below $10k, 7.7% for AGIs $10k-25k, 11.1% for AGIs $25k-50k, 13.9% for AGIs $50k-75k, 14.3% for AGIs $75k-100k, 13.7% for AGIs over 100k)
Charity contributions deductions: $2,272 (3% of AGI, reported on 25.2% of returns)
Here:
$2,272
State:
$3,087
Here:
3.4% of AGI
State:
3.4% of AGI
(% of AGI for various income ranges: 0.6% for AGIs below $10k, 1.0% for AGIs $10k-25k, 1.1% for AGIs $25k-50k, 1.6% for AGIs $50k-75k, 1.9% for AGIs $75k-100k, 2.4% for AGIs over 100k)
Total tax: $4,386 (reported on 78.7% of returns)
45383:
$4,386
State:
$6,781
(% of AGI for various income ranges: 2.3% for AGIs below $10k, 4.3% for AGIs $10k-25k, 7.2% for AGIs $25k-50k, 8.8% for AGIs $50k-75k, 10.6% for AGIs $75k-100k, 16.4% for AGIs over 100k)
Earned income credit: $1,649 (reported on 11.6% of returns)
Here:
$1,649
State:
$1,696
Percentage of individuals using paid preparers for their 2004 taxes: 56.8%
Here:
57%
State:
55%
(% for various income ranges: 47.1% for AGIs below $10k, 61.5% for AGIs $10k-25k, 59.3% for AGIs $25k-50k, 56.6% for AGIs $50k-75k, 54.5% for AGIs $75k-100k, 58.0% for AGIs over 100k)
Likely homosexual households (counted as self-reported same-sex unmarried-partner households)
Lesbian couples: 0.0% of all households
Gay men: 0.8% of all households
Household received Food Stamps/SNAP in the past 12 months: 176 Household did not receive Food Stamps/SNAP in the past 12 months: 2,696
Women who had a birth in the past 12 months: 129 (44 now married, 82 unmarried) Women who did not have a birth in the past 12 months: 1,198 (665 now married, 531 unmarried)
Housing units in zip code 45383 with a mortgage: 1,074 (222 second mortgage, 7 home equity loan, 128 both second mortgage and home equity loan) Houses without a mortgage: 94
Median monthly owner costs for units with a mortgage: $1,115 Median monthly owner costs for units without a mortgage: $517
Residents with income below the poverty level in 2022:
This zip code:
6.4%
Whole state:
13.4%
Residents with income below 50% of the poverty level in 2022:
This zip code:
2.8%
Whole state:
7.0%
Median number of rooms in houses and condos:
Here:
6.7
State:
6.7
Median number of rooms in apartments:
Here:
5.7
State:
4.4
Notable locations in this zip code not listed on our city pages
Notable locations in zip code 45383: Stillwater Golf Course (A), Union Township Life Squad (B), West Milton Fire Department and Fire Company (C). Display/hide their locations on the map
Churches in zip code 45383 include: Church of the Transfiguration (A), West Union Church (B), Brush Creek Church of God (C), Center Friends Church (D), West Milton United Church of Christ (E), West Milton Church of the Nazarene (F), Hoffman United Methodist Church (G). Display/hide their locations on the map
Cemeteries: Curtis Union Cemetery (1), Vore Cemetery (2), Center Cemetery (3), West Branch Cemetery (4), Old Milton Cemetery (5), Riverside Cemetery (6). Display/hide their locations on the map
Size of family households: 949 2-persons, 387 3-persons, 143 4-persons, 118 5-persons, 63 6-persons, 79 7-or-more-persons
Size of nonfamily households: 858 1-person, 284 2-persons
871 married couples with children.
194 single-parent households (38 men, 156 women).
99.3% of residents of 45383 zip code speak English at home.
0.1% of residents speak Spanish at home (100% very well).
0.3% of residents speak other Indo-European language at home (100% very well).
0.2% of residents speak Asian or Pacific Island language at home (100% not well).
Foreign born population: 50 (0.8%) (53.5% of them are naturalized citizens)
This zip code:
0.8%
Whole state:
5.0%
46%United Kingdom, excluding England and Scotland
44%Sweden
34%German
15%American
15%English
8%Irish
6%Italian
4%European
1%Swiss
Year of entry for the foreign-born population
02010 or later
222000 to 2009
241990 to 1999
35Before 1990
Facilities with environmental interests located in this zip code:
BP OIL CO (129 N MIAMI AVE in WEST MILTON, OH)
(Resource Conservation and Recovery Act (tracking hazardous waste)) Organizations: BP OIL COMPANY (CONTACT/OWNER)
CERTIFIED GAS STATION #377 (891 MIAMI in WEST MILTON, OH)
AIR MINOR (AIRS/AFS) CRITERIA AND HAZARDOUS AIR POLLUTANT INVENTORY (Inventory of air pollution sources) Business SIC classification: GASOLINE SERVICE STATIONS Alternative names: CERTIFIED 377
Housing units lacking complete plumbing facilities: 0.4% Housing units lacking complete kitchen facilities: 2.1%
52.0%Utility gas
32.5%Electricity
4.8%Fuel oil, kerosene, etc.
3.7%Wood
3.5%No fuel used
3.3%Bottled, tank, or LP gas
Population in 1990: 6,095. Population change in the 1990s: +1,048 (+17.2%).
Place of birth for U.S.-born residents:
This state: 5,197
Northeast: 122
Midwest: 250
South: 623
West: 144
59% of the 45383 zip code residents lived in the same house 5 years ago. Out of people who lived in different houses, 49% lived in this county. Out of people who lived in different counties, 50% lived in Ohio.
96% of the 45383 zip code residents lived in the same house 1 year ago. Out of people who lived in different houses, 15% moved from this county. Out of people who lived in different houses, 99% moved from different county within same state. Out of people who lived in different houses, 6% moved from different state.
Private vs. public school enrollment:
Students in private schools in grades 1 to 8 (elementary and middle school): 25
Here:
5.4%
Ohio:
16.0%
Students in private schools in grades 9 to 12 (high school):
Here:
0.0%
Ohio:
13.1%
Students in private undergraduate colleges:
Here:
0.0%
Ohio:
22.3%
Occupation by median earnings in the past 12 months ($)
81,262Management occupations
68,268Transportation occupations
64,985Education, training, and library occupations
61,726Health diagnosing and treating practitioners and other technical occupations
52,503Installation, maintenance, and repair occupations
49,534Health technologists and technicians
Companies with federal contracts located in this zip code:
GEM WOODWORKING LTD (4901 S KESSLER FREDERICK in WEST MILTON, OH; small business)
$9,750 with Air Force for Signs, Advertising Displays, and Identification Plates. Signed on 2006-03-17. Completion date: 2006-03-24.
LASERTALK INC (9786 FOURMAN RD in WEST MILTON, OH; small business)
$6,500 with Navy for Optical Instruments, Test Equipment, Components and Accessories. Signed on 2005-06-24. Completion date: 2005-07-08.
Top industries in this zip code by the number of employees in 2005:
Other Services (except Public Administration): Religious Organizations (10-19 employees: 2 establishments, 5-9 employees: 2 establishments, 1-4 employees: 8 establishments)
Accommodation and Food Services: Full-Service Restaurants (20-49: 1, 5-9: 2)
Accommodation and Food Services: Limited-Service Restaurants (20-49: 1, 1-4: 2)
Construction: Poured Concrete Foundation and Structure Contractors (20-49: 1)
Health Care and Social Assistance: Ambulance Services (20-49: 1)
Construction: Plumbing, Heating, and Air-Conditioning Contractors (10-19: 2)
Fatal accident statistics in 2013:
Fatal accident count: 1
Vehicles involved in fatal accidents: 5
Fatal accidents caused by drunken drivers: 1
Fatalities: 1
Persons involved in fatal accidents: 6
Pedestrians involved in fatal accidents: 0
Fatal accident statistics in 2010:
Fatal accident count: 3
Vehicles involved in fatal accidents: 5
Fatal accidents caused by drunken drivers: 1
Fatalities: 3
Persons involved in fatal accidents: 6
Pedestrians involved in fatal accidents: 0
Home Mortgage Disclosure Act Aggregated Statistics For Year 2009 (Based on 2 full and 4 partial tracts)
A) FHA, FSA/RHS & VA Home Purchase Loans
B) Conventional Home Purchase Loans
C) Refinancings
D) Home Improvement Loans
F) Non-occupant Loans on < 5 Family Dwellings (A B C & D)
G) Loans On Manufactured Home Dwelling (A B C & D)
Number
Average Value
Number
Average Value
Number
Average Value
Number
Average Value
Number
Average Value
Number
Average Value
LOANS ORIGINATED
69
$97,740
55
$107,960
310
$108,513
11
$94,679
31
$81,564
2
$14,700
APPLICATIONS APPROVED, NOT ACCEPTED
0
$0
5
$141,168
22
$82,016
1
$10,170
2
$147,000
0
$0
APPLICATIONS DENIED
10
$77,891
7
$75,643
91
$105,688
13
$37,158
4
$87,235
6
$42,808
APPLICATIONS WITHDRAWN
8
$86,469
11
$108,485
55
$110,419
4
$30,380
11
$53,887
0
$0
FILES CLOSED FOR INCOMPLETENESS
2
$84,315
0
$0
6
$111,448
0
$0
0
$0
0
$0
Aggregated Statistics For Year 2008 (Based on 2 full and 4 partial tracts)
A) FHA, FSA/RHS & VA Home Purchase Loans
B) Conventional Home Purchase Loans
C) Refinancings
D) Home Improvement Loans
F) Non-occupant Loans on < 5 Family Dwellings (A B C & D)
G) Loans On Manufactured Home Dwelling (A B C & D)
Number
Average Value
Number
Average Value
Number
Average Value
Number
Average Value
Number
Average Value
Number
Average Value
LOANS ORIGINATED
40
$115,031
56
$115,673
143
$114,923
24
$37,545
18
$108,788
1
$157,620
APPLICATIONS APPROVED, NOT ACCEPTED
5
$69,032
2
$73,500
17
$89,118
6
$19,537
0
$0
0
$0
APPLICATIONS DENIED
11
$102,389
19
$143,780
94
$112,875
27
$52,648
10
$70,902
2
$4,900
APPLICATIONS WITHDRAWN
12
$88,242
7
$150,386
44
$123,880
0
$0
0
$0
2
$35,280
FILES CLOSED FOR INCOMPLETENESS
2
$147,000
2
$121,520
6
$123,153
1
$71,180
0
$0
0
$0
Aggregated Statistics For Year 2007 (Based on 2 full and 4 partial tracts)
A) FHA, FSA/RHS & VA Home Purchase Loans
B) Conventional Home Purchase Loans
C) Refinancings
D) Home Improvement Loans
E) Loans on Dwellings For 5+ Families
F) Non-occupant Loans on < 5 Family Dwellings (A B C & D)
G) Loans On Manufactured Home Dwelling (A B C & D)
Number
Average Value
Number
Average Value
Number
Average Value
Number
Average Value
Number
Average Value
Number
Average Value
Number
Average Value
LOANS ORIGINATED
28
$108,867
136
$94,638
159
$95,964
29
$67,108
4
$214,620
19
$67,658
1
$150,840
APPLICATIONS APPROVED, NOT ACCEPTED
0
$0
9
$70,619
43
$98,009
5
$71,744
0
$0
0
$0
0
$0
APPLICATIONS DENIED
6
$104,078
30
$88,770
212
$97,417
46
$47,362
0
$0
17
$87,274
4
$32,340
APPLICATIONS WITHDRAWN
5
$57,798
15
$102,568
55
$117,926
1
$8,470
0
$0
1
$105,930
0
$0
FILES CLOSED FOR INCOMPLETENESS
0
$0
3
$121,827
19
$114,736
0
$0
0
$0
6
$103,553
0
$0
Aggregated Statistics For Year 2006 (Based on 2 full and 4 partial tracts)
A) FHA, FSA/RHS & VA Home Purchase Loans
B) Conventional Home Purchase Loans
C) Refinancings
D) Home Improvement Loans
E) Loans on Dwellings For 5+ Families
F) Non-occupant Loans on < 5 Family Dwellings (A B C & D)
G) Loans On Manufactured Home Dwelling (A B C & D)
Number
Average Value
Number
Average Value
Number
Average Value
Number
Average Value
Number
Average Value
Number
Average Value
Number
Average Value
LOANS ORIGINATED
41
$91,233
163
$96,113
170
$103,058
31
$29,279
4
$216,580
20
$76,306
5
$18,750
APPLICATIONS APPROVED, NOT ACCEPTED
4
$74,970
26
$71,788
39
$77,118
16
$47,733
0
$0
7
$29,263
1
$38,130
APPLICATIONS DENIED
3
$84,713
46
$85,939
201
$101,169
32
$29,341
0
$0
8
$79,135
9
$31,301
APPLICATIONS WITHDRAWN
2
$74,480
20
$102,476
125
$109,137
11
$42,105
0
$0
2
$92,120
0
$0
FILES CLOSED FOR INCOMPLETENESS
2
$77,420
2
$99,960
26
$132,456
2
$33,320
0
$0
1
$77,110
0
$0
Aggregated Statistics For Year 2005 (Based on 2 full and 4 partial tracts)
A) FHA, FSA/RHS & VA Home Purchase Loans
B) Conventional Home Purchase Loans
C) Refinancings
D) Home Improvement Loans
E) Loans on Dwellings For 5+ Families
F) Non-occupant Loans on < 5 Family Dwellings (A B C & D)
G) Loans On Manufactured Home Dwelling (A B C & D)
Number
Average Value
Number
Average Value
Number
Average Value
Number
Average Value
Number
Average Value
Number
Average Value
Number
Average Value
LOANS ORIGINATED
36
$94,344
159
$93,598
250
$98,406
38
$70,678
6
$211,353
31
$89,324
2
$44,100
APPLICATIONS APPROVED, NOT ACCEPTED
2
$85,260
6
$87,115
52
$84,889
8
$9,064
0
$0
2
$68,600
1
$21,180
APPLICATIONS DENIED
6
$114,333
37
$78,888
194
$104,299
40
$36,664
0
$0
20
$101,384
5
$36,250
APPLICATIONS WITHDRAWN
1
$84,740
29
$96,111
106
$109,925
15
$108,881
0
$0
8
$94,080
0
$0
FILES CLOSED FOR INCOMPLETENESS
2
$97,020
7
$84,966
33
$104,280
0
$0
0
$0
0
$0
0
$0
Aggregated Statistics For Year 2004 (Based on 2 full and 4 partial tracts)
A) FHA, FSA/RHS & VA Home Purchase Loans
B) Conventional Home Purchase Loans
C) Refinancings
D) Home Improvement Loans
E) Loans on Dwellings For 5+ Families
F) Non-occupant Loans on < 5 Family Dwellings (A B C & D)
G) Loans On Manufactured Home Dwelling (A B C & D)
Number
Average Value
Number
Average Value
Number
Average Value
Number
Average Value
Number
Average Value
Number
Average Value
Number
Average Value
LOANS ORIGINATED
32
$101,007
196
$99,668
349
$98,976
33
$33,518
4
$215,600
35
$77,318
6
$41,120
APPLICATIONS APPROVED, NOT ACCEPTED
0
$0
21
$72,088
81
$111,310
6
$36,352
0
$0
12
$93,327
0
$0
APPLICATIONS DENIED
2
$127,400
33
$90,793
214
$101,236
40
$56,236
0
$0
6
$84,933
6
$26,722
APPLICATIONS WITHDRAWN
5
$94,290
22
$103,785
120
$106,282
7
$47,574
0
$0
9
$50,341
0
$0
FILES CLOSED FOR INCOMPLETENESS
0
$0
2
$52,920
27
$90,150
4
$47,865
0
$0
2
$52,920
0
$0
Aggregated Statistics For Year 2003 (Based on 2 full and 4 partial tracts)
A) FHA, FSA/RHS & VA Home Purchase Loans
B) Conventional Home Purchase Loans
C) Refinancings
D) Home Improvement Loans
E) Loans on Dwellings For 5+ Families
F) Non-occupant Loans on < 5 Family Dwellings (A B C & D)
Number
Average Value
Number
Average Value
Number
Average Value
Number
Average Value
Number
Average Value
Number
Average Value
LOANS ORIGINATED
36
$103,701
159
$97,014
808
$96,807
13
$15,687
0
$0
83
$100,576
APPLICATIONS APPROVED, NOT ACCEPTED
7
$117,597
20
$106,443
116
$102,098
8
$12,221
0
$0
6
$80,250
APPLICATIONS DENIED
6
$101,795
26
$73,382
203
$100,310
27
$12,513
5
$134,486
19
$58,935
APPLICATIONS WITHDRAWN
6
$106,820
8
$70,994
148
$98,795
6
$50,617
0
$0
4
$53,900
FILES CLOSED FOR INCOMPLETENESS
0
$0
3
$106,757
29
$105,841
2
$14,700
0
$0
2
$54,880
Aggregated Statistics For Year 2002 (Based on 2 full and 4 partial tracts)
A) FHA, FSA/RHS & VA Home Purchase Loans
B) Conventional Home Purchase Loans
C) Refinancings
D) Home Improvement Loans
E) Loans on Dwellings For 5+ Families
F) Non-occupant Loans on < 5 Family Dwellings (A B C & D)
Number
Average Value
Number
Average Value
Number
Average Value
Number
Average Value
Number
Average Value
Number
Average Value
LOANS ORIGINATED
34
$102,454
192
$81,378
533
$90,776
21
$18,073
14
$200,200
43
$75,010
APPLICATIONS APPROVED, NOT ACCEPTED
6
$66,313
18
$71,754
97
$93,990
5
$16,580
0
$0
5
$83,684
APPLICATIONS DENIED
3
$89,260
41
$44,937
185
$83,322
24
$9,012
0
$0
19
$71,524
APPLICATIONS WITHDRAWN
0
$0
14
$117,598
125
$104,935
2
$4,900
0
$0
7
$86,481
FILES CLOSED FOR INCOMPLETENESS
3
$88,217
6
$67,642
26
$79,207
2
$29,400
0
$0
2
$53,385
Aggregated Statistics For Year 2001 (Based on 2 full and 4 partial tracts)
A) FHA, FSA/RHS & VA Home Purchase Loans
B) Conventional Home Purchase Loans
C) Refinancings
D) Home Improvement Loans
F) Non-occupant Loans on < 5 Family Dwellings (A B C & D)
Number
Average Value
Number
Average Value
Number
Average Value
Number
Average Value
Number
Average Value
LOANS ORIGINATED
59
$96,903
161
$82,353
442
$91,733
45
$15,625
42
$86,930
APPLICATIONS APPROVED, NOT ACCEPTED
2
$74,480
30
$56,105
85
$81,602
18
$15,181
5
$40,722
APPLICATIONS DENIED
4
$79,380
53
$61,103
175
$83,973
49
$11,148
6
$47,038
APPLICATIONS WITHDRAWN
0
$0
18
$115,457
132
$79,500
10
$28,423
3
$65,400
FILES CLOSED FOR INCOMPLETENESS
0
$0
0
$0
24
$92,849
0
$0
0
$0
Aggregated Statistics For Year 2000 (Based on 2 full and 4 partial tracts)
A) FHA, FSA/RHS & VA Home Purchase Loans
B) Conventional Home Purchase Loans
C) Refinancings
D) Home Improvement Loans
F) Non-occupant Loans on < 5 Family Dwellings (A B C & D)
Number
Average Value
Number
Average Value
Number
Average Value
Number
Average Value
Number
Average Value
LOANS ORIGINATED
30
$91,916
165
$78,838
156
$68,021
68
$17,492
26
$60,907
APPLICATIONS APPROVED, NOT ACCEPTED
5
$88,960
18
$47,004
72
$75,516
29
$19,690
3
$46,137
APPLICATIONS DENIED
6
$96,962
35
$45,408
155
$79,819
59
$15,006
6
$29,070
APPLICATIONS WITHDRAWN
0
$0
11
$69,232
63
$86,276
8
$33,085
0
$0
FILES CLOSED FOR INCOMPLETENESS
0
$0
2
$82,320
17
$74,227
1
$41,520
0
$0
Aggregated Statistics For Year 1999 (Based on 1 full and 2 partial tracts)
A) FHA, FSA/RHS & VA Home Purchase Loans
B) Conventional Home Purchase Loans
C) Refinancings
D) Home Improvement Loans
F) Non-occupant Loans on < 5 Family Dwellings (A B C & D)
Detailed PMIC statistics for the following Tracts:3401.00
, 3450.00
2002 - 2018 National Fire Incident Reporting System (NFIRS) incidents
According to the data from the years 2002 - 2018 the average number of fire incidents per year is 25. The highest number of reported fires - 55 took place in 2002, and the least - 13 in 2016. The data has a decreasing trend.
When looking into fire subcategories, the most reports belonged to: Structure Fires (51.9%), and Outside Fires (33.1%).
Fire incident types reported to NFIRS in Zip Code 45383


 Nearest zip codes: 45339, 45322, 45361, 45354, 45337, 45359.


 According to the data from the years 2002 - 2018 the average number of fire incidents per year is 25. The highest number of reported fires - 55 took place in 2002, and the least - 13 in 2016. The data has a decreasing trend.
 When looking into fire subcategories, the most reports belonged to: Structure Fires (51.9%), and Outside Fires (33.1%).