Estimated zip code population in 2022: 2,641 Zip code population in 2010: 3,597 Zip code population in 2000: 3,435
Houses and condos: 1,224 Renter-occupied apartments: 208
% of renters here:
20%
State:
33%
March 2022 cost of living index in zip code 45613: 84.7 (less than average, U.S. average is 100)
Land area: 77.4 sq. mi. Water area: 0.1 sq. mi.
Population density: 34 people per square mile
(very low).
OSM Map
General Map
Google Map
MSN Map
OSM Map
General Map
Google Map
MSN Map
OSM Map
General Map
Google Map
MSN Map
OSM Map
General Map
Google Map
MSN Map
Please wait while loading the map...
Real estate property taxes paid for housing units in 2022:
This zip code:
0.6% ($1,032)
Ohio:
1.3% ($2,639)
Median real estate property taxes paid for housing units with mortgages in 2022: $1,216 (0.6%) Median real estate property taxes paid for housing units with no mortgage in 2022: $1,010 (0.7%)
Business Search- 14 Million verified businesses
Males: 1,335
(50.6%)
Females: 1,305
(49.4%)
For population 25 years and over in 45613:
High school or higher: 80.4%
Bachelor's degree or higher: 15.4%
Graduate or professional degree: 8.5%
Unemployed: 2.2%
Mean travel time to work (commute): 27.0 minutes
For population 15 years and over in 45613:
Never married: 24.9%
Now married: 57.7%
Separated: 1.6%
Widowed: 8.7%
Divorced: 7.1%
Zip code 45613 compared to state average:
Median household income below state average.
Unemployed percentage below state average.
Black race population percentage significantly below state average.
Hispanic race population percentage below state average.
Median age above state average.
Foreign-born population percentage significantly below state average.
Renting percentage below state average.
Length of stay since moving in significantly above state average.
Number of college students below state average.
Percentage of population with a bachelor's degree or higher below state average.
Estimated median house/condo value in 2022: $169,248
45613:
$169,248
Ohio:
$204,100
According to our research of Ohio and other state lists, there were 3 registered sex offenders living in 45613 zip code as of May 28, 2024. The ratio of all residents to sex offenders in zip code 45613 is 982 to 1. The ratio of registered sex offenders to all residents in this zip code is lower than the state average.
Median resident age:
This zip code:
46.8 years
Ohio median age:
39.9 years
Average household size:
This zip code:
2.5 people
Ohio:
2.4 people
Averages for the 2020 tax year for zip code 45613, filed in 2021:
Average Adjusted Gross Income (AGI) in 2020: $48,719 (Individual Income Tax Returns)
Here:
$48,719
State:
$67,288
Salary/wage: $43,448 (reported on 80.0% of returns)
Here:
$43,448
State:
$55,628
(% of AGI for various income ranges: 1131.8% for AGIs below $25k, 3474.7% for AGIs $25k-50k, 5618.8% for AGIs $50k-75k, 9548.9% for AGIs $75k-100k, 15791.0% for AGIs $100k-200k)
Taxable interest for individuals: $733 (reported on 19.3% of returns)
This zip code:
$733
Ohio:
$1,518
(% of AGI for various income ranges: 6.6% for AGIs below $25k, 18.3% for AGIs $25k-50k, 15.9% for AGIs $50k-75k, 37.8% for AGIs $75k-100k, 57.0% for AGIs $100k-200k)
Ordinary dividends: $1,540 (reported on 7.1% of returns)
Here:
$1,540
State:
$7,167
(% of AGI for various income ranges: 9.7% for AGIs below $25k, 29.4% for AGIs $50k-75k, 67.0% for AGIs $100k-200k)
Net capital gain/loss in AGI: +$4,890 (reported on 7.1% of returns)
Here:
+$4,890
State:
+$18,919
(% of AGI for various income ranges: 6.6% for AGIs below $25k, 74.1% for AGIs $50k-75k, 338.0% for AGIs $100k-200k)
Profit/loss from business: +$13,005 (reported on 13.6% of returns)
Here:
+$13,005
State:
+$13,744
(% of AGI for various income ranges: 123.4% for AGIs below $25k, 257.3% for AGIs $25k-50k, 284.1% for AGIs $50k-75k, 747.0% for AGIs $100k-200k)
Taxable individual retirement arrangement distribution: $15,571 (reported on 5.0% of returns)
45613:
$15,571
Ohio:
$18,876
(% of AGI for various income ranges: 33.2% for AGIs below $25k, 158.7% for AGIs $25k-50k, 542.2% for AGIs $75k-100k)
Earned income credit: $2,472 (reported on 20.7% of returns)
Here:
$2,472
State:
$2,304
(% of AGI for various income ranges: 116.8% for AGIs below $25k, 91.0% for AGIs $25k-50k)
Percentage of individuals using paid preparers for their 2020 taxes: 95.0%
Here:
95%
State:
94%
(% for various income ranges: 94.0% for AGIs below $25k, 94.9% for AGIs $25k-50k, 95.5% for AGIs $50k-75k, 92.9% for AGIs $75k-100k, 100.0% for AGIs $100k-200k)
Averages for the 2012 tax year for zip code 45613, filed in 2013:
Average Adjusted Gross Income (AGI) in 2012: $38,688 (Individual Income Tax Returns)
Here:
$38,688
State:
$54,926
Salary/wage: $36,170 (reported on 80.9% of returns)
Here:
$36,170
State:
$45,869
(% of AGI for various income ranges: 72.9% for AGIs below $25k, 78.8% for AGIs $25k-50k, 82.3% for AGIs $50k-75k, 79.0% for AGIs $75k-100k, 67.1% for AGIs $100k-200k)
Taxable interest for individuals: $574 (reported on 20.6% of returns)
This zip code:
$574
Ohio:
$1,297
(% of AGI for various income ranges: 0.6% for AGIs below $25k, 0.2% for AGIs $25k-50k, 0.1% for AGIs $50k-75k, 0.5% for AGIs $100k-200k)
Ordinary dividends: $743 (reported on 5.3% of returns)
Here:
$743
State:
$5,821
(% of AGI for various income ranges: 0.2% for AGIs $25k-50k, 0.4% for AGIs $75k-100k)
Net capital gain/loss in AGI: +$1,500 (reported on 5.3% of returns)
Here:
+$1,500
State:
+$11,232
(% of AGI for various income ranges: 0.2% for AGIs $25k-50k, 1.1% for AGIs $75k-100k)
Profit/loss from business: +$7,758 (reported on 14.5% of returns)
Here:
+$7,758
State:
+$12,773
(% of AGI for various income ranges: 8.0% for AGIs below $25k, 3.8% for AGIs $25k-50k, 0.4% for AGIs $50k-75k, 4.6% for AGIs $75k-100k)
Taxable individual retirement arrangement distribution: $13,062 (reported on 6.1% of returns)
45613:
$13,062
Ohio:
$14,511
(% of AGI for various income ranges: 2.3% for AGIs below $25k, 2.1% for AGIs $25k-50k, 8.1% for AGIs $75k-100k)
Total itemized deductions: $16,917 (21% of AGI, reported on 13.7% of returns)
Here:
$16,917
State:
$21,278
Here:
21.0% of AGI
State:
18.8% of AGI
(% of AGI for various income ranges: 5.6% for AGIs $25k-50k, 6.4% for AGIs $50k-75k, 9.4% for AGIs $75k-100k, 7.6% for AGIs $100k-200k)
Charity contributions: $3,078 (reported on 6.9% of returns)
Here:
$3,078
State:
$3,943
(% of AGI for various income ranges: 0.5% for AGIs $25k-50k, 0.2% for AGIs $50k-75k, 0.8% for AGIs $75k-100k, 1.0% for AGIs $100k-200k)
Taxes paid: $4,394 (reported on 13.7% of returns)
45613:
$4,394
State:
$9,568
(% of AGI for various income ranges: 0.9% for AGIs $25k-50k, 1.4% for AGIs $50k-75k, 2.5% for AGIs $75k-100k, 2.8% for AGIs $100k-200k)
Earned income credit: $2,450 (reported on 27.5% of returns)
Here:
$2,450
State:
$2,285
(% of AGI for various income ranges: 8.8% for AGIs below $25k, 1.6% for AGIs $25k-50k)
Percentage of individuals using paid preparers for their 2012 taxes: 55.7%
Here:
56%
State:
51%
(% for various income ranges: 50.8% for AGIs below $25k, 60.0% for AGIs $25k-50k, 58.8% for AGIs $50k-75k, 55.6% for AGIs $75k-100k, 66.7% for AGIs $100k-200k)
Averages for the 2004 tax year for zip code 45613, filed in 2005:
Average Adjusted Gross Income (AGI) in 2004: $29,565 (Individual Income Tax Returns)
Here:
$29,565
State:
$44,480
Salary/wage: $28,672 (reported on 86.5% of returns)
Here:
$28,672
State:
$39,198
(% of AGI for various income ranges: 118.5% for AGIs below $10k, 76.4% for AGIs $10k-25k, 87.0% for AGIs $25k-50k, 86.2% for AGIs $50k-75k, 86.1% for AGIs $75k-100k, 63.6% for AGIs over 100k)
Taxable interest for individuals: $987 (reported on 27.8% of returns)
This zip code:
$987
Ohio:
$1,532
(% of AGI for various income ranges: 4.4% for AGIs below $10k, 1.4% for AGIs $10k-25k, 1.0% for AGIs $25k-50k, 0.5% for AGIs $50k-75k, 0.1% for AGIs $75k-100k, 0.7% for AGIs over 100k)
Taxable dividends: $735 (reported on 7.3% of returns)
Here:
$735
State:
$3,496
(% of AGI for various income ranges: 0.7% for AGIs below $10k, 0.3% for AGIs $10k-25k, 0.2% for AGIs $25k-50k, 0.1% for AGIs $50k-75k, 0.3% for AGIs over 100k)
Net capital gain/loss: +$1,720 (reported on 6.7% of returns)
Here:
+$1,720
State:
+$8,582
(% of AGI for various income ranges: -0.2% for AGIs below $10k, 0.4% for AGIs $10k-25k, 0.2% for AGIs $25k-50k, 0.9% for AGIs $50k-75k, 0.6% for AGIs over 100k)
Profit/loss from business: +$4,416 (reported on 14.2% of returns)
Here:
+$4,416
State:
+$10,813
(% of AGI for various income ranges: 15.4% for AGIs below $10k, 5.5% for AGIs $10k-25k, 2.2% for AGIs $25k-50k, -0.4% for AGIs $50k-75k, 0.2% for AGIs $75k-100k)
IRA payment deduction: $3,167 (reported on 1.3% of returns)
45613:
$3,167
Ohio:
$2,794
Total itemized deductions: $14,938 (27% of AGI, reported on 14.0% of returns)
Here:
$14,938
State:
$17,503
Here:
26.6% of AGI
State:
20.8% of AGI
(% of AGI for various income ranges: 2.8% for AGIs $10k-25k, 6.5% for AGIs $25k-50k, 9.7% for AGIs $50k-75k, 12.1% for AGIs $75k-100k, 6.1% for AGIs over 100k)
Charity contributions deductions: $1,458 (2% of AGI, reported on 8.6% of returns)
Here:
$1,458
State:
$3,087
Here:
2.5% of AGI
State:
3.4% of AGI
Total tax: $3,367 (reported on 67.0% of returns)
45613:
$3,367
State:
$6,781
(% of AGI for various income ranges: 3.4% for AGIs below $10k, 3.7% for AGIs $10k-25k, 5.8% for AGIs $25k-50k, 9.1% for AGIs $50k-75k, 10.3% for AGIs $75k-100k, 16.8% for AGIs over 100k)
Earned income credit: $1,855 (reported on 26.3% of returns)
Here:
$1,855
State:
$1,696
Percentage of individuals using paid preparers for their 2004 taxes: 56.8%
Here:
57%
State:
55%
(% for various income ranges: 46.3% for AGIs below $10k, 59.8% for AGIs $10k-25k, 59.9% for AGIs $25k-50k, 59.0% for AGIs $50k-75k, 65.5% for AGIs $75k-100k, 60.0% for AGIs over 100k)
Likely homosexual households (counted as self-reported same-sex unmarried-partner households)
Lesbian couples: 0.2% of all households
Gay men: 0.0% of all households
Household received Food Stamps/SNAP in the past 12 months: 307 Household did not receive Food Stamps/SNAP in the past 12 months: 742
Women who had a birth in the past 12 months: 1 (0 now married, 1 unmarried) Women who did not have a birth in the past 12 months: 456 (177 now married, 279 unmarried)
Housing units in zip code 45613 with a mortgage: 290 (40 second mortgage, 22 both second mortgage and home equity loan) Median monthly owner costs for units with a mortgage: $1,524 Median monthly owner costs for units without a mortgage: $358
Residents with income below the poverty level in 2022:
This zip code:
28.0%
Whole state:
13.4%
Residents with income below 50% of the poverty level in 2022:
This zip code:
20.4%
Whole state:
7.0%
Median number of rooms in houses and condos:
Here:
6.4
State:
6.7
Median number of rooms in apartments:
Here:
4.3
State:
4.4
Notable locations in this zip code not listed on our city pages
Notable locations in zip code 45613: Beaver Sewage Treatment Plant (A), Brown Farm (B), Cordle Dairy (C), Stockdale Volunteer Fire Department (D), Beaver Volunteer Fire Department (E). Display/hide their locations on the map
Churches in zip code 45613 include: Allen Chapel (A), Beaver Valley Church (B), Carrs Run Church (C), Linn Hill Church (D), Little Ettie Baptist Church (E), New Zion Church (F), Philadelphia Church (G), Emmanuel United Methodist Church (H). Display/hide their locations on the map
Cemeteries: Salem Cemetery (1), Barton Cemetery (2), Beaver Union Cemetery (3), Scioto Cemetery (4), Blosser Cemetery (5), Funk Cemetery (6), Haskind Cemetery (7). Display/hide their locations on the map
Streams, rivers, and creeks: Jackson Run (A), Fourmile Creek (B), Dutch Run (C), Millstone Run (D), Bee Lick (E), Swift Creek (F). Display/hide their locations on the map
In group quarters: 37 (-1 institutionalized population)
Size of family households: 340 2-persons, 166 3-persons, 120 4-persons, 130 5-persons
Size of nonfamily households: 265 1-person, 14 2-persons
215 married couples with children.
229 single-parent households (43 men, 186 women).
98.9% of residents of 45613 zip code speak English at home.
0.9% of residents speak Asian or Pacific Island language at home (100% very well).
Foreign born population: 7 (0.3%) (100.0% of them are naturalized citizens)
This zip code:
0.3%
Whole state:
5.0%
100%Japan
25%American
19%German
12%English
11%Scandinavian
6%European
2%Irish
2%French
Year of entry for the foreign-born population
02010 or later
02000 to 2009
61990 to 1999
49Before 1990
Facilities with environmental interests located in this zip code:
BEAVER WWTP * (BEAVER PIKE ROAD in BEAVER, OH)
STATE MASTER (Ohio general info) - PCS-OH0041505, National Pollutant Discharge Elimination System Permit National Pollutant Discharge Elimination System NON-MAJOR (Tracking pollutant discharge elimination systems) - permit National Pollutant Discharge Elimination System NON-MAJOR (Tracking pollutant discharge elimination systems) - permit Business SIC classification: SEWERAGE SYSTEMS Organizations: BEAVER, VILLAGE OF (CONTACT/OWNER)
, VILLAGE OF BEAVER (CONTACT/OWNER)
Alternative names: BEAVER SEWAGE TREATMENT PLANT, BEAVER VILLAGE, BEAVER, VILLAGE OF, BEAVER WTP
BEAVER ELEMENTARY SCHOOL (5825 BEAVER PIKE in BEAVER, OH)
(Geographic Names Information System) (National Center for Education Statistics) - STATE ID-001941 Organizations: EASTERN LOCAL SD (SCHOOL DISTRICT)
AT&T LONG LINES BEAVER OH (APPROX 3.5 MI NO BEAVER in BEAVER, OH)
(Resource Conservation and Recovery Act (tracking hazardous waste))
Housing units lacking complete plumbing facilities: 4.6% Housing units lacking complete kitchen facilities: 0.2%
58.4%Electricity
19.8%Bottled, tank, or LP gas
17.4%Utility gas
3.0%Fuel oil, kerosene, etc.
1.6%Wood
Population in 1990: 2,953. Population change in the 1990s: +482 (+16.3%).
Place of birth for U.S.-born residents:
This state: 2,069
Northeast: 17
Midwest: 188
South: 255
West: 42
67% of the 45613 zip code residents lived in the same house 5 years ago. Out of people who lived in different houses, 60% lived in this county. Out of people who lived in different counties, 50% lived in Ohio.
89% of the 45613 zip code residents lived in the same house 1 year ago. Out of people who lived in different houses, 65% moved from this county. Out of people who lived in different houses, 14% moved from different county within same state. Out of people who lived in different houses, 17% moved from different state.
Private vs. public school enrollment:
Students in private schools in grades 1 to 8 (elementary and middle school): 2
Here:
0.7%
Ohio:
16.0%
Students in private schools in grades 9 to 12 (high school): 6
Here:
6.0%
Ohio:
13.1%
Students in private undergraduate colleges:
Here:
0.0%
Ohio:
22.3%
Occupation by median earnings in the past 12 months ($)
108,195Management occupations
87,250Installation, maintenance, and repair occupations
67,053Health technologists and technicians
62,803Education, training, and library occupations
55,975Law enforcement workers including supervisors
54,143Transportation occupations
Top industries in this zip code by the number of employees in 2005:
Health Care and Social Assistance: Nursing Care Facilities (50-99 employees: 1 establishment)
Construction: Highway, Street, and Bridge Construction (20-49: 1, 1-4: 1)
Other Services (except Public Administration): Religious Organizations (10-19: 1)
Health Care and Social Assistance: All Other Outpatient Care Centers (10-19: 1)
Information: Data Processing, Hosting, and Related Services (10-19: 1)
Accommodation and Food Services: Limited-Service Restaurants (10-19: 1)
People in group quarters in 2010:
44 people in nursing facilities/skilled-nursing facilities
20 people in group homes intended for adults
People in group quarters in 2000:
42 people in nursing homes
Fatal accident statistics in 2013:
Fatal accident count: 1
Vehicles involved in fatal accidents: 2
Fatal accidents caused by drunken drivers: 0
Fatalities: 1
Persons involved in fatal accidents: 2
Pedestrians involved in fatal accidents: 0
Fatal accident statistics in 2011:
Fatal accident count: 1
Vehicles involved in fatal accidents: 1
Fatal accidents caused by drunken drivers: 0
Fatalities: 1
Persons involved in fatal accidents: 1
Pedestrians involved in fatal accidents: 0
2002 - 2018 National Fire Incident Reporting System (NFIRS) incidents
According to the data from the years 2002 - 2018 the average number of fire incidents per year is 43. The highest number of fires - 66 took place in 2009, and the least - 17 in 2016. The data has a declining trend.
When looking into fire subcategories, the most reports belonged to: Structure Fires (48.8%), and Outside Fires (38.9%).
Fire incident types reported to NFIRS in Zip Code 45613

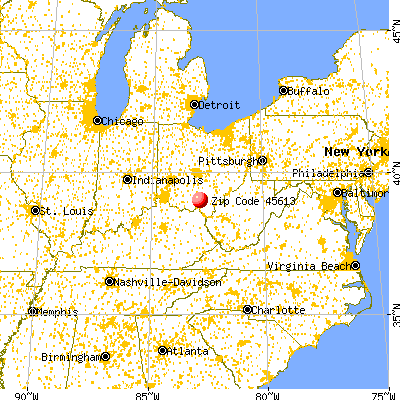


 Nearest zip codes: 45653, 45673, 45690, 45648, 45640, 45642.


 According to the data from the years 2002 - 2018 the average number of fire incidents per year is 43. The highest number of fires - 66 took place in 2009, and the least - 17 in 2016. The data has a declining trend.
 When looking into fire subcategories, the most reports belonged to: Structure Fires (48.8%), and Outside Fires (38.9%).