Estimated zip code population in 2022: 2,755 Zip code population in 2010: 3,036 Zip code population in 2000: 2,911
Houses and condos: 1,189 Renter-occupied apartments: 82
% of renters here:
8%
State:
33%
March 2022 cost of living index in zip code 45645: 82.4 (low, U.S. average is 100)
Land area: 46.7 sq. mi. Water area: 0.1 sq. mi.
Population density: 59 people per square mile
(very low).
OSM Map
General Map
Google Map
MSN Map
OSM Map
General Map
Google Map
MSN Map
OSM Map
General Map
Google Map
MSN Map
OSM Map
General Map
Google Map
MSN Map
Please wait while loading the map...
Real estate property taxes paid for housing units in 2022:
This zip code:
0.9% ($579)
Ohio:
1.3% ($2,639)
Median real estate property taxes paid for housing units with mortgages in 2022: $878 Median real estate property taxes paid for housing units with no mortgage in 2022: $537
Business Search- 14 Million verified businesses
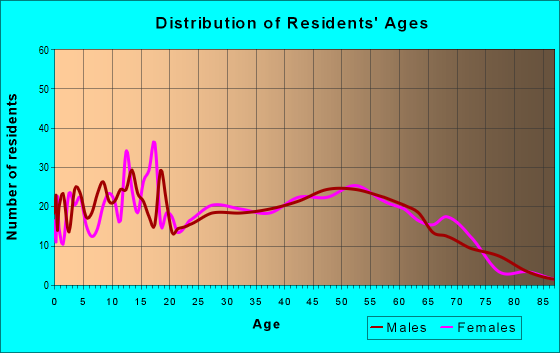
Males: 1,086
(39.4%)
Females: 1,669
(60.6%)
For population 25 years and over in 45645:
High school or higher: 83.3%
Bachelor's degree or higher: 13.2%
Graduate or professional degree: 5.3%
Mean travel time to work (commute): 24.2 minutes
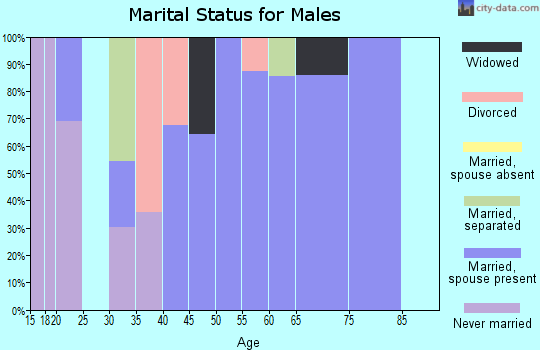
For population 15 years and over in 45645:
Never married: 25.2%
Now married: 68.4%
Separated: 0.9%
Widowed: 2.7%
Divorced: 2.9%
Zip code 45645 compared to state average:
Median household income below state average.
Median house value significantly below state average.
Unemployed percentage significantly below state average.
Black race population percentage significantly below state average.
Hispanic race population percentage significantly below state average.
Foreign-born population percentage significantly below state average.
Renting percentage significantly below state average.
Length of stay since moving in above state average.
Number of rooms per house below state average.
House age below state average.
Number of college students below state average.
Percentage of population with a bachelor's degree or higher significantly below state average.
Averages for the 2020 tax year for zip code 45645, filed in 2021:
Average Adjusted Gross Income (AGI) in 2020: $55,664 (Individual Income Tax Returns)
Here:
$55,664
State:
$67,288
Salary/wage: $51,999 (reported on 81.4% of returns)
Here:
$51,999
State:
$55,628
(% of AGI for various income ranges: 1124.5% for AGIs below $25k, 3016.2% for AGIs $25k-50k, 5817.5% for AGIs $50k-75k, 8332.7% for AGIs $75k-100k, 18492.7% for AGIs $100k-200k)
Taxable interest for individuals: $367 (reported on 22.9% of returns)
This zip code:
$367
Ohio:
$1,518
(% of AGI for various income ranges: 4.1% for AGIs below $25k, 8.5% for AGIs $25k-50k, 20.6% for AGIs $50k-75k, 6.4% for AGIs $75k-100k, 22.7% for AGIs $100k-200k)
Ordinary dividends: $810 (reported on 8.5% of returns)
Here:
$810
State:
$7,167
(% of AGI for various income ranges: 4.8% for AGIs below $25k, 13.1% for AGIs $50k-75k, 41.8% for AGIs $100k-200k)
Net capital gain/loss in AGI: +$1,317 (reported on 5.1% of returns)
Here:
+$1,317
State:
+$18,919
(% of AGI for various income ranges: 4.5% for AGIs below $25k, 13.5% for AGIs $25k-50k, 28.2% for AGIs $100k-200k)
Profit/loss from business: +$8,040 (reported on 12.7% of returns)
Here:
+$8,040
State:
+$13,744
(% of AGI for various income ranges: 39.3% for AGIs below $25k, 145.8% for AGIs $25k-50k, 487.3% for AGIs $75k-100k, 160.9% for AGIs $100k-200k)
Taxable individual retirement arrangement distribution: $14,150 (reported on 5.1% of returns)
45645:
$14,150
Ohio:
$18,876
(% of AGI for various income ranges: 153.1% for AGIs $25k-50k, 410.0% for AGIs $75k-100k)
Total itemized deductions: $30,850 (reported on 1.7% of returns)
Here:
$30,850
State:
$33,869
(% of AGI for various income ranges: 385.6% for AGIs $50k-75k)
Taxes paid: $6,500 (reported on 1.7% of returns)
45645:
$6,500
State:
$7,681
(% of AGI for various income ranges: 81.2% for AGIs $50k-75k)
Earned income credit: $2,357 (reported on 17.8% of returns)
Here:
$2,357
State:
$2,304
(% of AGI for various income ranges: 89.0% for AGIs below $25k, 91.2% for AGIs $25k-50k)
Percentage of individuals using paid preparers for their 2020 taxes: 94.1%
Here:
94%
State:
94%
(% for various income ranges: 91.7% for AGIs below $25k, 96.8% for AGIs $25k-50k, 95.0% for AGIs $50k-75k, 92.9% for AGIs $75k-100k, 94.1% for AGIs $100k-200k)
Averages for the 2012 tax year for zip code 45645, filed in 2013:
Average Adjusted Gross Income (AGI) in 2012: $44,078 (Individual Income Tax Returns)
Here:
$44,078
State:
$54,926
Salary/wage: $40,752 (reported on 86.2% of returns)
Here:
$40,752
State:
$45,869
(% of AGI for various income ranges: 74.1% for AGIs below $25k, 80.0% for AGIs $25k-50k, 80.6% for AGIs $50k-75k, 82.4% for AGIs $75k-100k, 78.8% for AGIs $100k-200k)
Taxable interest for individuals: $414 (reported on 25.0% of returns)
This zip code:
$414
Ohio:
$1,297
(% of AGI for various income ranges: 0.3% for AGIs below $25k, 0.2% for AGIs $25k-50k, 0.3% for AGIs $50k-75k, 0.3% for AGIs $75k-100k, 0.1% for AGIs $100k-200k)
Ordinary dividends: $544 (reported on 7.8% of returns)
Here:
$544
State:
$5,821
(% of AGI for various income ranges: 0.2% for AGIs below $25k, 0.1% for AGIs $50k-75k, 0.2% for AGIs $75k-100k)
Net capital gain/loss in AGI: +$3,325 (reported on 3.4% of returns)
Here:
+$3,325
State:
+$11,232
(% of AGI for various income ranges: 1.2% for AGIs $50k-75k)
Profit/loss from business: +$5,321 (reported on 16.4% of returns)
Here:
+$5,321
State:
+$12,773
(% of AGI for various income ranges: 8.3% for AGIs below $25k, 1.7% for AGIs $25k-50k, 0.9% for AGIs $50k-75k, 1.8% for AGIs $75k-100k, 0.4% for AGIs $100k-200k)
Taxable individual retirement arrangement distribution: $9,043 (reported on 6.0% of returns)
45645:
$9,043
Ohio:
$14,511
(% of AGI for various income ranges: 4.7% for AGIs below $25k, 3.3% for AGIs $50k-75k)
Total itemized deductions: $18,050 (20% of AGI, reported on 15.5% of returns)
Here:
$18,050
State:
$21,278
Here:
20.0% of AGI
State:
18.8% of AGI
(% of AGI for various income ranges: 4.9% for AGIs $25k-50k, 6.3% for AGIs $50k-75k, 7.5% for AGIs $75k-100k, 9.6% for AGIs $100k-200k)
Charity contributions: $5,125 (reported on 10.3% of returns)
Here:
$5,125
State:
$3,943
(% of AGI for various income ranges: 0.7% for AGIs $25k-50k, 0.8% for AGIs $50k-75k, 1.2% for AGIs $75k-100k, 2.6% for AGIs $100k-200k)
Taxes paid: $4,822 (reported on 15.5% of returns)
45645:
$4,822
State:
$9,568
(% of AGI for various income ranges: 0.7% for AGIs $25k-50k, 1.4% for AGIs $50k-75k, 1.8% for AGIs $75k-100k, 3.6% for AGIs $100k-200k)
Earned income credit: $2,359 (reported on 23.3% of returns)
Here:
$2,359
State:
$2,285
(% of AGI for various income ranges: 9.0% for AGIs below $25k, 1.1% for AGIs $25k-50k)
Percentage of individuals using paid preparers for their 2012 taxes: 56.0%
Here:
56%
State:
51%
(% for various income ranges: 54.3% for AGIs below $25k, 50.0% for AGIs $25k-50k, 61.1% for AGIs $50k-75k, 61.5% for AGIs $75k-100k, 66.7% for AGIs $100k-200k)
Averages for the 2004 tax year for zip code 45645, filed in 2005:
Average Adjusted Gross Income (AGI) in 2004: $31,871 (Individual Income Tax Returns)
Here:
$31,871
State:
$44,480
Salary/wage: $31,951 (reported on 87.2% of returns)
Here:
$31,951
State:
$39,198
(% of AGI for various income ranges: 81.5% for AGIs below $10k, 81.1% for AGIs $10k-25k, 84.4% for AGIs $25k-50k, 94.1% for AGIs $50k-75k, 87.0% for AGIs $75k-100k, 91.9% for AGIs over 100k)
Taxable interest for individuals: $572 (reported on 36.2% of returns)
This zip code:
$572
Ohio:
$1,532
(% of AGI for various income ranges: 2.5% for AGIs below $10k, 1.1% for AGIs $10k-25k, 0.6% for AGIs $25k-50k, 0.5% for AGIs $50k-75k, 0.3% for AGIs $75k-100k, 0.3% for AGIs over 100k)
Taxable dividends: $348 (reported on 10.1% of returns)
Here:
$348
State:
$3,496
(% of AGI for various income ranges: 0.2% for AGIs $10k-25k, 0.1% for AGIs $25k-50k, 0.0% for AGIs $50k-75k, 0.1% for AGIs $75k-100k, 0.3% for AGIs over 100k)
Profit/loss from business: +$2,511 (reported on 19.8% of returns)
Here:
+$2,511
State:
+$10,813
(% of AGI for various income ranges: 9.0% for AGIs below $10k, 3.1% for AGIs $10k-25k, 3.0% for AGIs $25k-50k, -0.7% for AGIs $50k-75k, 0.5% for AGIs $75k-100k)
IRA payment deduction: $2,882 (reported on 1.5% of returns)
45645:
$2,882
Ohio:
$2,794
Total itemized deductions: $15,132 (24% of AGI, reported on 15.3% of returns)
Here:
$15,132
State:
$17,503
Here:
23.6% of AGI
State:
20.8% of AGI
(% of AGI for various income ranges: 3.4% for AGIs $10k-25k, 6.6% for AGIs $25k-50k, 7.7% for AGIs $50k-75k, 10.5% for AGIs $75k-100k, 12.2% for AGIs over 100k)
Charity contributions deductions: $3,563 (5% of AGI, reported on 11.1% of returns)
Here:
$3,563
State:
$3,087
Here:
5.2% of AGI
State:
3.4% of AGI
(% of AGI for various income ranges: 1.4% for AGIs below $10k, 0.7% for AGIs $25k-50k, 1.5% for AGIs $50k-75k, 1.9% for AGIs $75k-100k, 3.3% for AGIs over 100k)
Total tax: $3,503 (reported on 67.6% of returns)
45645:
$3,503
State:
$6,781
(% of AGI for various income ranges: 2.6% for AGIs below $10k, 3.1% for AGIs $10k-25k, 6.0% for AGIs $25k-50k, 8.2% for AGIs $50k-75k, 10.8% for AGIs $75k-100k, 13.5% for AGIs over 100k)
Earned income credit: $1,892 (reported on 24.4% of returns)
Here:
$1,892
State:
$1,696
Percentage of individuals using paid preparers for their 2004 taxes: 64.3%
Here:
64%
State:
55%
(% for various income ranges: 57.4% for AGIs below $10k, 66.5% for AGIs $10k-25k, 65.7% for AGIs $25k-50k, 64.5% for AGIs $50k-75k, 76.2% for AGIs $75k-100k, 55.2% for AGIs over 100k)
Household received Food Stamps/SNAP in the past 12 months: 74 Household did not receive Food Stamps/SNAP in the past 12 months: 925
Women who had a birth in the past 12 months: 37 (0 now married, 36 unmarried) Women who did not have a birth in the past 12 months: 789 (450 now married, 337 unmarried)
Housing units in zip code 45645 with a mortgage: 267 (17 second mortgage, 13 both second mortgage and home equity loan) Median monthly owner costs for units with a mortgage: $904 Median monthly owner costs for units without a mortgage: $709
Residents with income below the poverty level in 2022:
This zip code:
31.3%
Whole state:
13.4%
Residents with income below 50% of the poverty level in 2022:
This zip code:
15.3%
Whole state:
7.0%
Median number of rooms in houses and condos:
Here:
5.2
State:
6.7
Median number of rooms in apartments:
Here:
5.3
State:
4.4
Notable locations in this zip code not listed on our city pages
Notable locations in zip code 45645: Lawrence Township Fire Department Station 2 (A), Lawrence Township Volunteer Fire Department Station 1 Headquarters (B). Display/hide their locations on the map
Churches in zip code 45645 include: Myrtle Ridge Church (A), Mamre Church (B), Highway Church (C), Symmes Valley Church (D), Bald Knob Church (E), Union Church (F), Oakland Chapel (G). Display/hide their locations on the map
Cemeteries: Willis Cemetery (1), Williams Cemetery (2), Webb Cemetery (3), Ross Cemetery (4), Mays Cemetery (5), Lodge Ridge Cemetery (6), Leatherwood Cemetery (7). Display/hide their locations on the map
Streams, rivers, and creeks: Elkins Creek (A), Drift Creek (B), Dog Fork (C), DeLoss Creek (D), Buck Creek (E), Sharps Creek (F), Ned Fork (G), Markin Fork (H). Display/hide their locations on the map
In group quarters: 1 (-1 institutionalized population)
Size of family households: 300 2-persons, 304 3-persons, 140 4-persons, 38 5-persons, 22 7-or-more-persons
Size of nonfamily households: 158 1-person, 27 2-persons
436 married couples with children.
132 single-parent households (132 women).
99.2% of residents of 45645 zip code speak English at home.
Foreign born population: 0 (0.0%)
:
0.0%
Whole state:
5.0%
50%American
17%English
11%German
6%Scottish
5%Irish
1%British
Year of entry for the foreign-born population
1772010 or later
02000 to 2009
01990 to 1999
23Before 1990
Housing units lacking complete plumbing facilities: 10.9% Housing units lacking complete kitchen facilities: 9.4%
46.7%Bottled, tank, or LP gas
28.1%Electricity
15.3%Utility gas
10.1%Wood
Population in 1990: 2,837. Population change in the 1990s: +74 (+2.6%).
Place of birth for U.S.-born residents:
This state: 1,449
Midwest: 4
South: 1,092
71% of the 45645 zip code residents lived in the same house 5 years ago. Out of people who lived in different houses, 78% lived in this county. Out of people who lived in different counties, 50% lived in Ohio.
99% of the 45645 zip code residents lived in the same house 1 year ago. Out of people who lived in different houses, 119% moved from this county. Out of people who lived in different houses, 62% moved from different state.
Private vs. public school enrollment:
Students in private schools in grades 1 to 8 (elementary and middle school): 1
Here:
0.9%
Ohio:
16.0%
Students in private schools in grades 9 to 12 (high school): 1
Here:
0.7%
Ohio:
13.1%
Students in private undergraduate colleges:
Here:
0.0%
Ohio:
22.3%
Occupation by median earnings in the past 12 months ($)
51,652Sales and related occupations
49,415Installation, maintenance, and repair occupations
45,568Construction and extraction occupations
28,358Office and administrative support occupations
25,566Education, training, and library occupations
4,839Building and grounds cleaning and maintenance occupations
Top industries in this zip code by the number of employees in 2005:
Health Care and Social Assistance: Other Residential Care Facilities (20-49 employees: 1 establishment)
Construction: Water and Sewer Line and Related Structures Construction (20-49: 1)
Accommodation and Food Services: Limited-Service Restaurants (10-19: 1)
Construction: Other Building Equipment Contractors (10-19: 1)
Other Services (except Public Administration): Religious Organizations (5-9: 1, 1-4: 1)
Health Care and Social Assistance: Nursing Care Facilities (5-9: 1)
Construction: Industrial Building Construction (5-9: 1)
Health Care and Social Assistance: Child Day Care Services (5-9: 1)
Fatal accident statistics in 2013:
Fatal accident count: 1
Vehicles involved in fatal accidents: 2
Fatal accidents caused by drunken drivers: 0
Fatalities: 1
Persons involved in fatal accidents: 6
Pedestrians involved in fatal accidents: 0
Home Mortgage Disclosure Act Aggregated Statistics For Year 2009 (Based on 2 partial tracts)
A) FHA, FSA/RHS & VA Home Purchase Loans
B) Conventional Home Purchase Loans
C) Refinancings
D) Home Improvement Loans
F) Non-occupant Loans on < 5 Family Dwellings (A B C & D)
G) Loans On Manufactured Home Dwelling (A B C & D)
Number
Average Value
Number
Average Value
Number
Average Value
Number
Average Value
Number
Average Value
Number
Average Value
LOANS ORIGINATED
4
$108,548
9
$62,036
52
$128,182
9
$33,608
4
$44,002
3
$38,270
APPLICATIONS APPROVED, NOT ACCEPTED
1
$48,370
1
$36,720
7
$147,614
0
$0
0
$0
1
$45,460
APPLICATIONS DENIED
1
$55,370
1
$93,250
29
$97,770
12
$36,377
1
$17,480
2
$74,890
APPLICATIONS WITHDRAWN
1
$79,840
1
$110,730
9
$132,490
0
$0
0
$0
2
$84,215
FILES CLOSED FOR INCOMPLETENESS
0
$0
1
$25,640
3
$76,737
1
$13,400
1
$25,640
0
$0
Aggregated Statistics For Year 2008 (Based on 2 partial tracts)
A) FHA, FSA/RHS & VA Home Purchase Loans
B) Conventional Home Purchase Loans
C) Refinancings
D) Home Improvement Loans
F) Non-occupant Loans on < 5 Family Dwellings (A B C & D)
G) Loans On Manufactured Home Dwelling (A B C & D)
Number
Average Value
Number
Average Value
Number
Average Value
Number
Average Value
Number
Average Value
Number
Average Value
LOANS ORIGINATED
9
$133,461
16
$109,566
31
$95,560
15
$41,340
5
$77,862
9
$61,518
APPLICATIONS APPROVED, NOT ACCEPTED
0
$0
1
$69,940
3
$109,760
3
$42,933
0
$0
1
$14,570
APPLICATIONS DENIED
3
$78,873
5
$78,912
38
$93,217
15
$57,309
1
$5,250
4
$50,268
APPLICATIONS WITHDRAWN
2
$144,825
1
$93,830
4
$136,668
1
$76,350
0
$0
1
$89,170
FILES CLOSED FOR INCOMPLETENESS
0
$0
0
$0
1
$85,090
2
$77,805
0
$0
0
$0
Aggregated Statistics For Year 2007 (Based on 2 partial tracts)
A) FHA, FSA/RHS & VA Home Purchase Loans
B) Conventional Home Purchase Loans
C) Refinancings
D) Home Improvement Loans
F) Non-occupant Loans on < 5 Family Dwellings (A B C & D)
G) Loans On Manufactured Home Dwelling (A B C & D)
Number
Average Value
Number
Average Value
Number
Average Value
Number
Average Value
Number
Average Value
Number
Average Value
LOANS ORIGINATED
5
$82,174
30
$92,199
54
$86,222
18
$25,741
3
$53,813
12
$75,181
APPLICATIONS APPROVED, NOT ACCEPTED
0
$0
3
$52,840
15
$79,727
2
$45,165
0
$0
2
$48,955
APPLICATIONS DENIED
1
$85,090
20
$81,476
41
$92,836
22
$40,452
1
$53,620
13
$60,612
APPLICATIONS WITHDRAWN
1
$41,960
3
$100,437
13
$103,425
3
$37,493
1
$3,500
0
$0
FILES CLOSED FOR INCOMPLETENESS
0
$0
1
$48,960
1
$166,100
0
$0
0
$0
0
$0
Aggregated Statistics For Year 2006 (Based on 2 partial tracts)
A) FHA, FSA/RHS & VA Home Purchase Loans
B) Conventional Home Purchase Loans
C) Refinancings
D) Home Improvement Loans
F) Non-occupant Loans on < 5 Family Dwellings (A B C & D)
G) Loans On Manufactured Home Dwelling (A B C & D)
Number
Average Value
Number
Average Value
Number
Average Value
Number
Average Value
Number
Average Value
Number
Average Value
LOANS ORIGINATED
5
$87,654
32
$98,366
47
$92,033
22
$36,849
2
$162,895
11
$61,935
APPLICATIONS APPROVED, NOT ACCEPTED
0
$0
10
$70,635
10
$84,856
2
$25,350
1
$81,590
6
$49,247
APPLICATIONS DENIED
2
$108,110
22
$80,267
58
$83,290
11
$34,120
2
$60,030
22
$58,730
APPLICATIONS WITHDRAWN
2
$89,170
5
$133,810
20
$76,026
3
$70,130
0
$0
2
$107,820
FILES CLOSED FOR INCOMPLETENESS
0
$0
2
$110,730
8
$91,791
0
$0
1
$26,810
1
$41,960
Aggregated Statistics For Year 2005 (Based on 2 partial tracts)
A) FHA, FSA/RHS & VA Home Purchase Loans
B) Conventional Home Purchase Loans
C) Refinancings
D) Home Improvement Loans
F) Non-occupant Loans on < 5 Family Dwellings (A B C & D)
G) Loans On Manufactured Home Dwelling (A B C & D)
Number
Average Value
Number
Average Value
Number
Average Value
Number
Average Value
Number
Average Value
Number
Average Value
LOANS ORIGINATED
5
$93,714
39
$78,289
48
$82,964
14
$43,502
8
$65,493
14
$49,788
APPLICATIONS APPROVED, NOT ACCEPTED
1
$114,810
10
$54,375
12
$63,282
5
$54,200
1
$43,710
9
$46,041
APPLICATIONS DENIED
1
$18,070
21
$67,966
96
$92,167
21
$39,020
2
$85,965
26
$58,258
APPLICATIONS WITHDRAWN
1
$140,450
5
$123,904
34
$107,081
5
$96,278
1
$174,840
3
$79,650
FILES CLOSED FOR INCOMPLETENESS
0
$0
1
$169,010
3
$66,633
1
$80,430
0
$0
1
$24,480
Aggregated Statistics For Year 2004 (Based on 2 partial tracts)
A) FHA, FSA/RHS & VA Home Purchase Loans
B) Conventional Home Purchase Loans
C) Refinancings
D) Home Improvement Loans
F) Non-occupant Loans on < 5 Family Dwellings (A B C & D)
G) Loans On Manufactured Home Dwelling (A B C & D)
Number
Average Value
Number
Average Value
Number
Average Value
Number
Average Value
Number
Average Value
Number
Average Value
LOANS ORIGINATED
2
$77,510
30
$74,443
55
$77,544
17
$33,288
3
$23,893
10
$45,225
APPLICATIONS APPROVED, NOT ACCEPTED
1
$46,040
8
$50,412
17
$60,748
3
$23,700
1
$33,220
8
$36,061
APPLICATIONS DENIED
1
$58,860
27
$53,855
68
$67,236
20
$36,134
2
$71,395
27
$44,768
APPLICATIONS WITHDRAWN
1
$92,670
5
$82,408
31
$88,135
5
$32,754
0
$0
2
$64,110
FILES CLOSED FOR INCOMPLETENESS
0
$0
2
$49,245
7
$74,931
0
$0
1
$11,660
1
$36,130
Aggregated Statistics For Year 2003 (Based on 2 partial tracts)
A) FHA, FSA/RHS & VA Home Purchase Loans
B) Conventional Home Purchase Loans
C) Refinancings
D) Home Improvement Loans
F) Non-occupant Loans on < 5 Family Dwellings (A B C & D)
Number
Average Value
Number
Average Value
Number
Average Value
Number
Average Value
Number
Average Value
LOANS ORIGINATED
2
$33,800
34
$64,314
98
$78,720
17
$22,009
2
$34,675
APPLICATIONS APPROVED, NOT ACCEPTED
1
$54,780
16
$53,071
23
$89,320
5
$20,282
1
$53,030
APPLICATIONS DENIED
6
$47,110
50
$45,085
77
$71,828
11
$25,007
4
$26,372
APPLICATIONS WITHDRAWN
1
$39,630
5
$62,826
28
$74,078
2
$13,985
1
$20,980
FILES CLOSED FOR INCOMPLETENESS
1
$53,620
0
$0
8
$109,639
1
$39,050
0
$0
Aggregated Statistics For Year 2002 (Based on 2 partial tracts)
A) FHA, FSA/RHS & VA Home Purchase Loans
B) Conventional Home Purchase Loans
C) Refinancings
D) Home Improvement Loans
F) Non-occupant Loans on < 5 Family Dwellings (A B C & D)
Number
Average Value
Number
Average Value
Number
Average Value
Number
Average Value
Number
Average Value
LOANS ORIGINATED
4
$63,380
33
$48,973
62
$72,953
18
$17,516
3
$22,340
APPLICATIONS APPROVED, NOT ACCEPTED
1
$108,400
26
$43,643
20
$70,840
3
$24,673
0
$0
APPLICATIONS DENIED
6
$53,228
67
$41,283
60
$69,266
11
$16,106
1
$52,450
APPLICATIONS WITHDRAWN
1
$38,460
3
$93,830
24
$67,410
1
$18,650
1
$19,230
FILES CLOSED FOR INCOMPLETENESS
0
$0
1
$38,460
8
$99,004
1
$150,950
1
$86,250
Aggregated Statistics For Year 2001 (Based on 2 partial tracts)
A) FHA, FSA/RHS & VA Home Purchase Loans
B) Conventional Home Purchase Loans
C) Refinancings
D) Home Improvement Loans
E) Loans on Dwellings For 5+ Families
F) Non-occupant Loans on < 5 Family Dwellings (A B C & D)
Number
Average Value
Number
Average Value
Number
Average Value
Number
Average Value
Number
Average Value
Number
Average Value
LOANS ORIGINATED
4
$64,252
26
$59,311
59
$71,615
35
$19,216
1
$233,120
5
$38,698
APPLICATIONS APPROVED, NOT ACCEPTED
1
$75,180
12
$39,096
17
$74,324
3
$20,203
0
$0
2
$38,755
APPLICATIONS DENIED
1
$51,290
31
$37,468
45
$75,868
17
$10,696
0
$0
1
$2,910
APPLICATIONS WITHDRAWN
0
$0
2
$69,060
27
$67,972
6
$12,142
0
$0
0
$0
FILES CLOSED FOR INCOMPLETENESS
0
$0
0
$0
4
$77,805
0
$0
0
$0
0
$0
Aggregated Statistics For Year 2000 (Based on 2 partial tracts)
A) FHA, FSA/RHS & VA Home Purchase Loans
B) Conventional Home Purchase Loans
C) Refinancings
D) Home Improvement Loans
F) Non-occupant Loans on < 5 Family Dwellings (A B C & D)
Number
Average Value
Number
Average Value
Number
Average Value
Number
Average Value
Number
Average Value
LOANS ORIGINATED
5
$63,292
33
$57,150
34
$65,051
12
$21,321
3
$39,823
APPLICATIONS APPROVED, NOT ACCEPTED
1
$64,110
22
$42,306
14
$63,775
2
$24,770
1
$51,290
APPLICATIONS DENIED
2
$26,515
42
$38,270
50
$58,140
17
$17,107
1
$25,060
APPLICATIONS WITHDRAWN
1
$17,480
6
$59,932
31
$54,388
1
$50,120
0
$0
FILES CLOSED FOR INCOMPLETENESS
0
$0
0
$0
3
$85,867
0
$0
0
$0
Aggregated Statistics For Year 1999 (Based on 1 partial tract)
B) Conventional Home Purchase Loans
C) Refinancings
D) Home Improvement Loans
F) Non-occupant Loans on < 5 Family Dwellings (A B C & D)
Detailed PMIC statistics for the following Tracts:0505.00
2003 - 2018 National Fire Incident Reporting System (NFIRS) incidents
According to the data from the years 2003 - 2018 the average number of fire incidents per year is 21. The highest number of fires - 33 took place in 2013, and the least - 8 in 2005. The data has a rising trend.
When looking into fire subcategories, the most reports belonged to: Structure Fires (47.7%), and Outside Fires (36.9%).
Fire incident types reported to NFIRS in Zip Code 45645
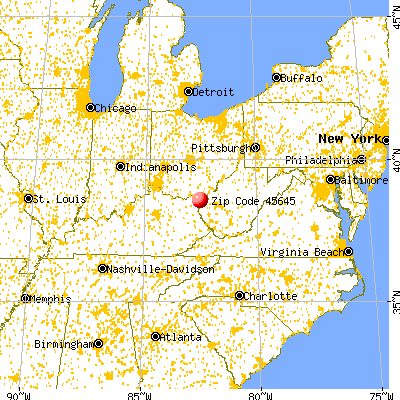


 Nearest zip codes: 45696, 45680, 45619, 45659, 41101, 45638.


 According to the data from the years 2003 - 2018 the average number of fire incidents per year is 21. The highest number of fires - 33 took place in 2013, and the least - 8 in 2005. The data has a rising trend.
 When looking into fire subcategories, the most reports belonged to: Structure Fires (47.7%), and Outside Fires (36.9%).