Estimated zip code population in 2022: 3,471 Zip code population in 2010: 3,519 Zip code population in 2000: 3,566
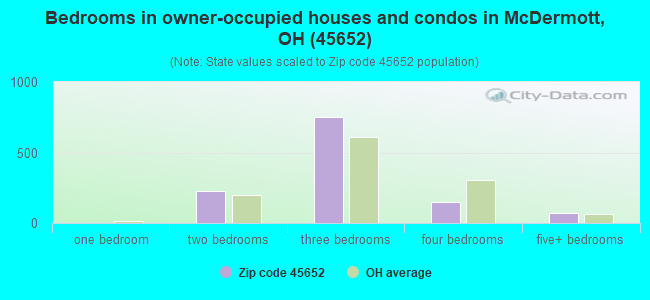
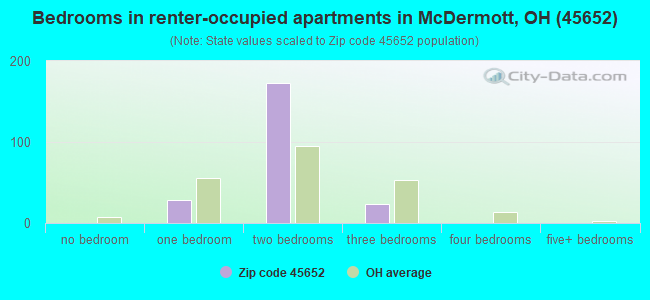
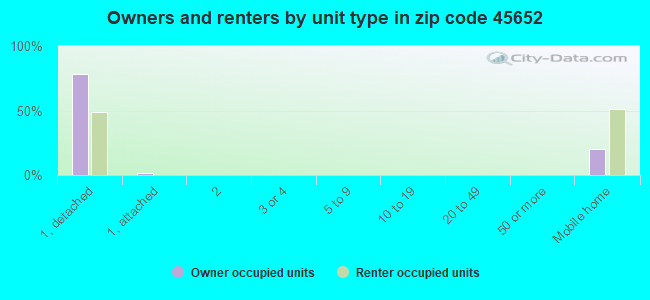
Houses and condos: 1,629 Renter-occupied apartments: 225
% of renters here:
16%
State:
33%
March 2022 cost of living index in zip code 45652: 84.3 (less than average, U.S. average is 100)
Land area: 33.2 sq. mi. Water area: 0.4 sq. mi.
Population density: 104 people per square mile
(very low).
OSM Map
General Map
Google Map
MSN Map
OSM Map
General Map
Google Map
MSN Map
OSM Map
General Map
Google Map
MSN Map
OSM Map
General Map
Google Map
MSN Map
Please wait while loading the map...
Real estate property taxes paid for housing units in 2022:
This zip code:
0.9% ($1,196)
Ohio:
1.3% ($2,639)
Median real estate property taxes paid for housing units with mortgages in 2022: $1,320 (0.9%) Median real estate property taxes paid for housing units with no mortgage in 2022: $1,125 (1.0%)
Business Search- 14 Million verified businesses
Males: 1,724
(49.7%)
Females: 1,746
(50.3%)
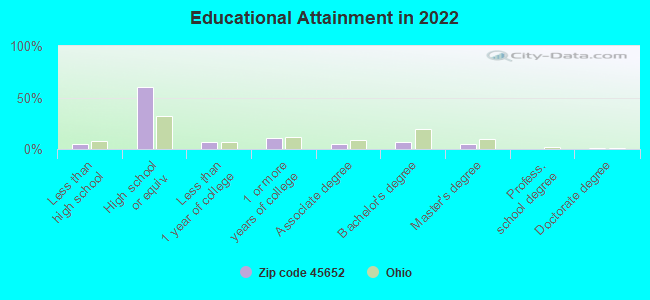
For population 25 years and over in 45652:
High school or higher: 93.6%
Bachelor's degree or higher: 13.1%
Graduate or professional degree: 6.2%
Unemployed: 7.5%
Mean travel time to work (commute): 24.1 minutes
For population 15 years and over in 45652:
Never married: 20.3%
Now married: 63.4%
Separated: 1.8%
Widowed: 5.8%
Divorced: 8.7%
Zip code 45652 compared to state average:
Median household income below state average.
Unemployed percentage above state average.
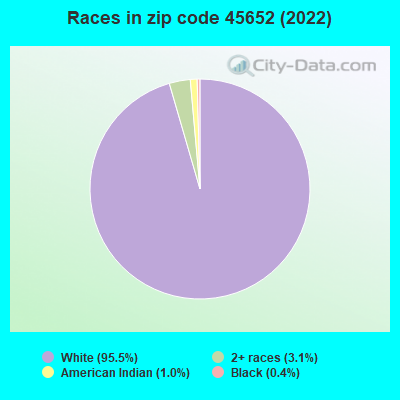
Black race population percentage significantly below state average.
Hispanic race population percentage significantly below state average.
Foreign-born population percentage significantly below state average.
Renting percentage below state average.
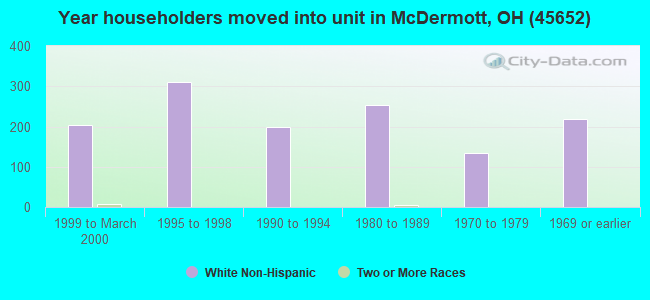
Length of stay since moving in significantly above state average.
Number of college students significantly below state average.
Percentage of population with a bachelor's degree or higher significantly below state average.
Estimated median house/condo value in 2022: $136,067
45652:
$136,067
Ohio:
$204,100
According to our research of Ohio and other state lists, there were 6 registered sex offenders living in 45652 zip code as of June 09, 2024. The ratio of all residents to sex offenders in zip code 45652 is 704 to 1. The ratio of registered sex offenders to all residents in this zip code is lower than the state average.
Median resident age:
This zip code:
42.1 years
Ohio median age:
39.9 years
Average household size:
This zip code:
2.4 people
Ohio:
2.4 people
Averages for the 2020 tax year for zip code 45652, filed in 2021:
Average Adjusted Gross Income (AGI) in 2020: $54,783 (Individual Income Tax Returns)
Here:
$54,783
State:
$67,288
Salary/wage: $46,777 (reported on 81.3% of returns)
Here:
$46,777
State:
$55,628
(% of AGI for various income ranges: 1099.7% for AGIs below $25k, 3390.7% for AGIs $25k-50k, 5620.0% for AGIs $50k-75k, 7982.7% for AGIs $75k-100k, 12196.4% for AGIs $100k-200k)
Taxable interest for individuals: $797 (reported on 23.1% of returns)
This zip code:
$797
Ohio:
$1,518
(% of AGI for various income ranges: 7.6% for AGIs below $25k, 10.7% for AGIs $25k-50k, 38.4% for AGIs $50k-75k, 7.3% for AGIs $75k-100k, 100.0% for AGIs $100k-200k)
Ordinary dividends: $3,683 (reported on 9.0% of returns)
Here:
$3,683
State:
$7,167
(% of AGI for various income ranges: 10.0% for AGIs $25k-50k, 47.9% for AGIs $50k-75k, 293.6% for AGIs $100k-200k)
Net capital gain/loss in AGI: +$2,370 (reported on 7.5% of returns)
Here:
+$2,370
State:
+$18,919
(% of AGI for various income ranges: 20.9% for AGIs below $25k, 36.8% for AGIs $50k-75k, 15.5% for AGIs $75k-100k, 71.8% for AGIs $100k-200k)
Profit/loss from business: +$10,225 (reported on 11.9% of returns)
Here:
+$10,225
State:
+$13,744
(% of AGI for various income ranges: 84.4% for AGIs below $25k, 94.3% for AGIs $25k-50k, 125.3% for AGIs $50k-75k, 37.3% for AGIs $75k-100k, 732.7% for AGIs $100k-200k)
Taxable individual retirement arrangement distribution: $21,112 (reported on 6.0% of returns)
45652:
$21,112
Ohio:
$18,876
(% of AGI for various income ranges: 98.8% for AGIs below $25k, 196.3% for AGIs $50k-75k, 890.9% for AGIs $75k-100k)
Total itemized deductions: $24,833 (reported on 2.2% of returns)
Here:
$24,833
State:
$33,869
(% of AGI for various income ranges: 392.1% for AGIs $50k-75k)
Taxes paid: $5,933 (reported on 2.2% of returns)
45652:
$5,933
State:
$7,681
(% of AGI for various income ranges: 161.8% for AGIs $75k-100k)
Earned income credit: $2,346 (reported on 19.4% of returns)
Here:
$2,346
State:
$2,304
(% of AGI for various income ranges: 102.6% for AGIs below $25k, 93.2% for AGIs $25k-50k)
Percentage of individuals using paid preparers for their 2020 taxes: 94.8%
Here:
95%
State:
94%
(% for various income ranges: 95.3% for AGIs below $25k, 94.3% for AGIs $25k-50k, 95.8% for AGIs $50k-75k, 92.9% for AGIs $75k-100k, 93.3% for AGIs $100k-200k, 100.0% for AGIs over 200k)
Averages for the 2012 tax year for zip code 45652, filed in 2013:
Average Adjusted Gross Income (AGI) in 2012: $45,392 (Individual Income Tax Returns)
Here:
$45,392
State:
$54,926
Salary/wage: $39,791 (reported on 83.1% of returns)
Here:
$39,791
State:
$45,869
(% of AGI for various income ranges: 74.7% for AGIs below $25k, 74.2% for AGIs $25k-50k, 77.0% for AGIs $50k-75k, 80.4% for AGIs $75k-100k, 64.6% for AGIs $100k-200k)
Taxable interest for individuals: $1,060 (reported on 26.9% of returns)
This zip code:
$1,060
Ohio:
$1,297
(% of AGI for various income ranges: 0.7% for AGIs below $25k, 0.6% for AGIs $25k-50k, 0.7% for AGIs $50k-75k, 0.4% for AGIs $75k-100k, 0.7% for AGIs $100k-200k)
Ordinary dividends: $2,300 (reported on 10.0% of returns)
Here:
$2,300
State:
$5,821
(% of AGI for various income ranges: 0.4% for AGIs below $25k, 0.3% for AGIs $25k-50k, 0.2% for AGIs $50k-75k, 0.3% for AGIs $75k-100k, 1.0% for AGIs $100k-200k)
Net capital gain/loss in AGI: +$150 (reported on 6.2% of returns)
Here:
+$150
State:
+$11,232
(% of AGI for various income ranges: 0.2% for AGIs $100k-200k)
Profit/loss from business: +$7,622 (reported on 13.8% of returns)
Here:
+$7,622
State:
+$12,773
(% of AGI for various income ranges: 5.7% for AGIs below $25k, 2.0% for AGIs $25k-50k, 1.8% for AGIs $50k-75k, 5.6% for AGIs $75k-100k)
Taxable individual retirement arrangement distribution: $12,367 (reported on 6.9% of returns)
45652:
$12,367
Ohio:
$14,511
(% of AGI for various income ranges: 1.4% for AGIs below $25k, 4.6% for AGIs $25k-50k, 5.0% for AGIs $75k-100k)
Total itemized deductions: $21,612 (22% of AGI, reported on 19.2% of returns)
Here:
$21,612
State:
$21,278
Here:
21.6% of AGI
State:
18.8% of AGI
(% of AGI for various income ranges: 6.1% for AGIs below $25k, 6.7% for AGIs $25k-50k, 11.2% for AGIs $50k-75k, 7.6% for AGIs $75k-100k, 11.4% for AGIs $100k-200k)
Charity contributions: $4,635 (reported on 13.1% of returns)
Here:
$4,635
State:
$3,943
(% of AGI for various income ranges: 0.9% for AGIs $25k-50k, 1.1% for AGIs $50k-75k, 1.1% for AGIs $75k-100k, 2.3% for AGIs $100k-200k)
Taxes paid: $5,788 (reported on 19.2% of returns)
45652:
$5,788
State:
$9,568
(% of AGI for various income ranges: 0.5% for AGIs below $25k, 1.4% for AGIs $25k-50k, 2.3% for AGIs $50k-75k, 2.3% for AGIs $75k-100k, 4.1% for AGIs $100k-200k)
Earned income credit: $2,477 (reported on 23.8% of returns)
Here:
$2,477
State:
$2,285
(% of AGI for various income ranges: 8.9% for AGIs below $25k, 1.4% for AGIs $25k-50k)
Percentage of individuals using paid preparers for their 2012 taxes: 53.8%
Here:
54%
State:
51%
(% for various income ranges: 51.9% for AGIs below $25k, 47.1% for AGIs $25k-50k, 60.0% for AGIs $50k-75k, 63.6% for AGIs $75k-100k, 63.6% for AGIs $100k-200k)
Averages for the 2004 tax year for zip code 45652, filed in 2005:
Average Adjusted Gross Income (AGI) in 2004: $35,066 (Individual Income Tax Returns)
Here:
$35,066
State:
$44,480
Salary/wage: $31,937 (reported on 86.7% of returns)
Here:
$31,937
State:
$39,198
(% of AGI for various income ranges: 127.2% for AGIs below $10k, 76.1% for AGIs $10k-25k, 81.6% for AGIs $25k-50k, 85.5% for AGIs $50k-75k, 88.7% for AGIs $75k-100k, 57.7% for AGIs over 100k)
Taxable interest for individuals: $904 (reported on 31.4% of returns)
This zip code:
$904
Ohio:
$1,532
(% of AGI for various income ranges: 6.3% for AGIs below $10k, 1.7% for AGIs $10k-25k, 0.6% for AGIs $25k-50k, 0.6% for AGIs $50k-75k, 0.5% for AGIs $75k-100k, 0.4% for AGIs over 100k)
Taxable dividends: $3,986 (reported on 10.9% of returns)
Here:
$3,986
State:
$3,496
(% of AGI for various income ranges: 1.0% for AGIs below $10k, 0.6% for AGIs $10k-25k, 0.1% for AGIs $25k-50k, 0.2% for AGIs $50k-75k, 0.2% for AGIs $75k-100k, 5.2% for AGIs over 100k)
Net capital gain/loss: +$1,713 (reported on 7.3% of returns)
Here:
+$1,713
State:
+$8,582
(% of AGI for various income ranges: -0.9% for AGIs below $10k, -0.1% for AGIs $10k-25k, 0.7% for AGIs $25k-50k, -0.2% for AGIs $50k-75k, -0.0% for AGIs $75k-100k, 1.1% for AGIs over 100k)
Profit/loss from business: +$4,386 (reported on 13.3% of returns)
Here:
+$4,386
State:
+$10,813
(% of AGI for various income ranges: 21.8% for AGIs below $10k, 2.9% for AGIs $10k-25k, 0.9% for AGIs $25k-50k, 0.3% for AGIs $50k-75k, 3.9% for AGIs $75k-100k)
IRA payment deduction: $2,214 (reported on 1.1% of returns)
45652:
$2,214
Ohio:
$2,794
Total itemized deductions: $16,182 (22% of AGI, reported on 22.1% of returns)
Here:
$16,182
State:
$17,503
Here:
21.8% of AGI
State:
20.8% of AGI
(% of AGI for various income ranges: 4.2% for AGIs $10k-25k, 10.3% for AGIs $25k-50k, 10.8% for AGIs $50k-75k, 13.9% for AGIs $75k-100k, 12.4% for AGIs over 100k)
Charity contributions deductions: $3,138 (4% of AGI, reported on 17.4% of returns)
Here:
$3,138
State:
$3,087
Here:
3.9% of AGI
State:
3.4% of AGI
(% of AGI for various income ranges: 0.7% for AGIs $10k-25k, 1.1% for AGIs $25k-50k, 1.5% for AGIs $50k-75k, 2.4% for AGIs $75k-100k, 2.5% for AGIs over 100k)
Total tax: $4,383 (reported on 69.5% of returns)
45652:
$4,383
State:
$6,781
(% of AGI for various income ranges: 4.4% for AGIs below $10k, 3.1% for AGIs $10k-25k, 5.9% for AGIs $25k-50k, 8.2% for AGIs $50k-75k, 10.5% for AGIs $75k-100k, 16.7% for AGIs over 100k)
Earned income credit: $1,781 (reported on 22.3% of returns)
Here:
$1,781
State:
$1,696
Percentage of individuals using paid preparers for their 2004 taxes: 60.2%
Here:
60%
State:
55%
(% for various income ranges: 52.2% for AGIs below $10k, 64.6% for AGIs $10k-25k, 59.7% for AGIs $25k-50k, 64.7% for AGIs $50k-75k, 57.8% for AGIs $75k-100k, 64.4% for AGIs over 100k)
Household received Food Stamps/SNAP in the past 12 months: 307 Household did not receive Food Stamps/SNAP in the past 12 months: 1,113
Women who had a birth in the past 12 months: 48 (49 now married, 0 unmarried) Women who did not have a birth in the past 12 months: 575 (343 now married, 231 unmarried)
Housing units in zip code 45652 with a mortgage: 424 (18 second mortgage, 18 both second mortgage and home equity loan) Median monthly owner costs for units with a mortgage: $904 Median monthly owner costs for units without a mortgage: $404
Residents with income below the poverty level in 2022:
This zip code:
26.1%
Whole state:
13.4%
Residents with income below 50% of the poverty level in 2022:
This zip code:
21.3%
Whole state:
7.0%
Median number of rooms in houses and condos:
Here:
6.4
State:
6.7
Median number of rooms in apartments:
Here:
4.6
State:
4.4
Notable locations in this zip code not listed on our city pages
Notable locations in zip code 45652: Elks Country Club (A), Brookside (B), Scioto Ambulance District Squad 2 (C), Rush Township Volunteer Fire Department (D), Union Township Volunteer Fire Department (E). Display/hide their locations on the map
Cemeteries: Scioto Burial Park (1), Country Club Cemetery (2), Duncan Cemetery (3), Thornton Cemetery (4), Euton Cemetery (5), Garvin Cemetery (6), Williams Cemetery (7). Display/hide their locations on the map
Streams, rivers, and creeks: Jacquays Run (A), Duck Run (B), Bear Creek (C), Sweeny Run (D), Scioto Brush Creek (E), McCullough Creek (F), Duncan Hollow Creek (G), Wrights Run (H), Saw Pit Run (I). Display/hide their locations on the map
In group quarters: 35 (-1 institutionalized population)
Size of family households: 656 2-persons, 130 3-persons, 252 4-persons, 25 6-persons, 20 7-or-more-persons
Size of nonfamily households: 287 1-person, 40 2-persons
497 married couples with children.
246 single-parent households (82 men, 164 women).
99.9% of residents of 45652 zip code speak English at home.
Foreign born population: 19 (0.6%) (100.0% of them are naturalized citizens)
This zip code:
0.6%
Whole state:
5.0%
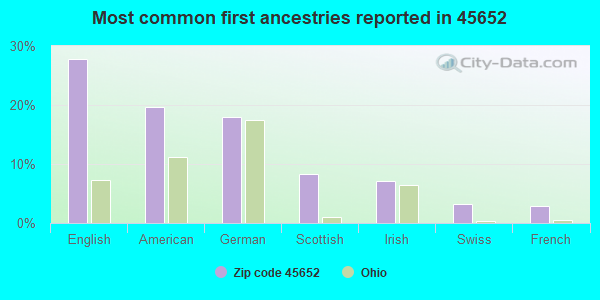
28%English
20%American
18%German
8%Scottish
7%Irish
3%Swiss
3%French
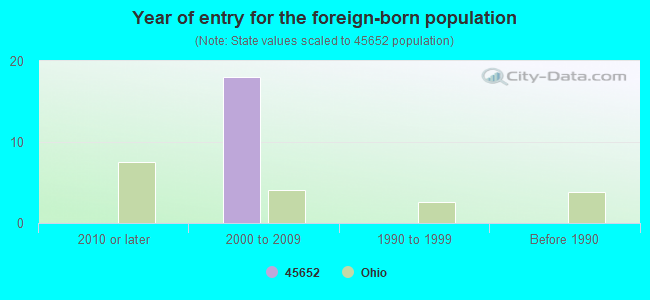
Year of entry for the foreign-born population
02010 or later
182000 to 2009
01990 to 1999
0Before 1990
Housing units lacking complete plumbing facilities: 8.8% Housing units lacking complete kitchen facilities: 8.3%
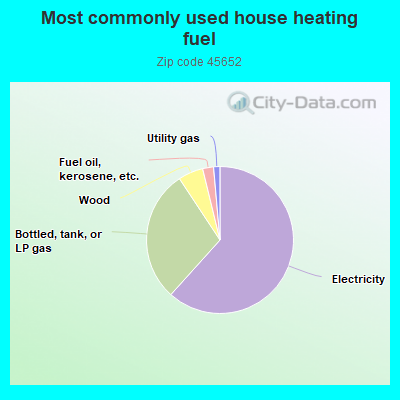
61.8%Electricity
29.1%Bottled, tank, or LP gas
5.5%Wood
2.4%Fuel oil, kerosene, etc.
1.4%Utility gas
Population in 1990: 2,932. Population change in the 1990s: +634 (+21.6%).
Place of birth for U.S.-born residents:
This state: 3,072
Northeast: 22
Midwest: 53
South: 289
West: 4
66% of the 45652 zip code residents lived in the same house 5 years ago. Out of people who lived in different houses, 85% lived in this county. Out of people who lived in different counties, 50% lived in Ohio.
97% of the 45652 zip code residents lived in the same house 1 year ago. Out of people who lived in different houses, 108% moved from this county.
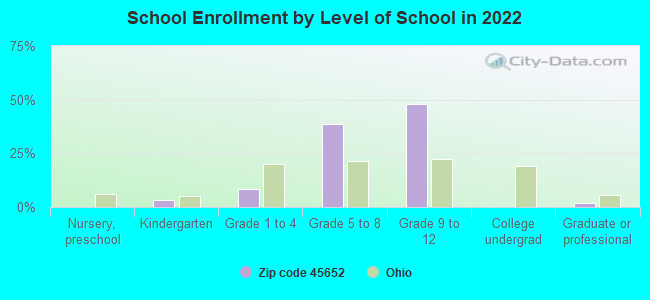
Private vs. public school enrollment:
Students in private schools in grades 1 to 8 (elementary and middle school):
Here:
0.0%
Ohio:
16.0%
Students in private schools in grades 9 to 12 (high school): 52
Here:
15.7%
Ohio:
13.1%
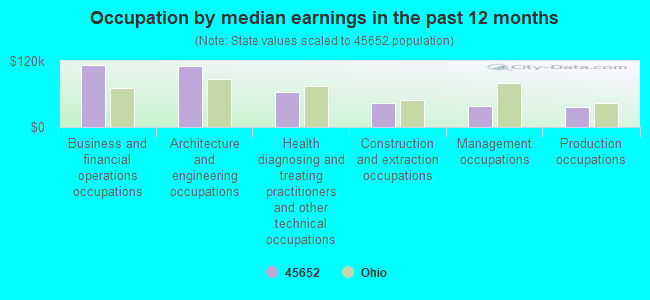
Occupation by median earnings in the past 12 months ($)
113,382Business and financial operations occupations
111,209Architecture and engineering occupations
62,750Health diagnosing and treating practitioners and other technical occupations
43,046Construction and extraction occupations
37,598Management occupations
36,177Production occupations
Companies with federal contracts located in this zip code:
STEPHANIE PAUL CONTRACTING (1391 A HENLEY DEEMER ROAD in MCDERMOTT, OH; small business) : $130,800 in 6 contractsin 2005
Contracts for Maintenance, Repair or Alteration of Real Property -- Office Buildings, Construction of Structures and Facilities -- Other Non-Building Facilities by Army, U.S. Army Corps of Engineers - civil program financing only Signed by year:2000: $0; 2001: $0; 2002: $0; 2003: $0; 2004: $0; 2005: $130,800; 2006: $0.
Biggest contracts:
$29,900 with Army for Maintenance, Repair or Alteration of Real Property -- Office Buildings. Signed on 2005-03-17. Completion date: 2005-03-15.
$29,900 with U.S. Army Corps of Engineers - civil program financing only for Maintenance, Repair or Alteration of Real Property -- Office Buildings. Signed on 2005-03-17. Completion date: 2005-03-15.
$19,000 with U.S. Army Corps of Engineers - civil program financing only for Construction of Structures and Facilities -- Other Non-Building Facilities. Taking place in KY. Signed on 2005-07-25. Completion date: 2005-08-31.
$19,000 with Army for Construction of Structures and Facilities -- Other Non-Building Facilities. Taking place in KY. Signed on 2005-07-25. Completion date: 2005-08-31.
Top industries in this zip code by the number of employees in 2005:
Health Care and Social Assistance: Offices of Physicians (except Mental Health Specialists) (50-99 employees: 1 establishment)
Health Care and Social Assistance: Residential Mental Retardation Facilities (20-49: 1, 1-4: 1)
Health Care and Social Assistance: Nursing Care Facilities (20-49: 1)
Other Services (except Public Administration): Civic and Social Organizations (20-49: 1)
People in group quarters in 2010:
19 people in nursing facilities/skilled-nursing facilities
4 people in group homes intended for adults
People in group quarters in 2000:
66 people in nursing homes
15 people in religious group quarters
5 people in other nonhousehold living situations
Fatal accident statistics in 2014:
Fatal accident count: 1
Vehicles involved in fatal accidents: 1
Fatal accidents caused by drunken drivers: 0
Fatalities: 1
Persons involved in fatal accidents: 1
Pedestrians involved in fatal accidents: 0
Fatal accident statistics in 2013:
Fatal accident count: 1
Vehicles involved in fatal accidents: 2
Fatal accidents caused by drunken drivers: 2
Fatalities: 1
Persons involved in fatal accidents: 3
Pedestrians involved in fatal accidents: 0
2002 - 2018 National Fire Incident Reporting System (NFIRS) incidents
According to the data from the years 2002 - 2018 the average number of fire incidents per year is 46. The highest number of fires - 88 took place in 2006, and the least - 15 in 2015. The data has a declining trend.
When looking into fire subcategories, the most reports belonged to: Structure Fires (50.8%), and Outside Fires (38.4%).
Fire incident types reported to NFIRS in Zip Code 45652


 Nearest zip codes: 45663, 45630, 45648, 45657, 41174, 45662.


 : $130,800 in 6 contracts in 2005
 According to the data from the years 2002 - 2018 the average number of fire incidents per year is 46. The highest number of fires - 88 took place in 2006, and the least - 15 in 2015. The data has a declining trend.
 When looking into fire subcategories, the most reports belonged to: Structure Fires (50.8%), and Outside Fires (38.4%).