Estimated zip code population in 2022: 2,186 Zip code population in 2010: 1,744 Zip code population in 2000: 1,547
Houses and condos: 911 Renter-occupied apartments: 183
% of renters here:
20%
State:
33%
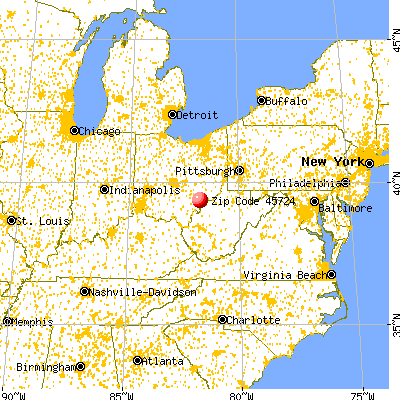
March 2022 cost of living index in zip code 45724: 83.6 (less than average, U.S. average is 100)
Land area: 53.3 sq. mi. Water area: 0.1 sq. mi.
Population density: 41 people per square mile
(very low).
OSM Map
General Map
Google Map
MSN Map
OSM Map
General Map
Google Map
MSN Map
OSM Map
General Map
Google Map
MSN Map
OSM Map
General Map
Google Map
MSN Map
Please wait while loading the map...
Real estate property taxes paid for housing units in 2022:
This zip code:
1.1% ($1,767)
Ohio:
1.3% ($2,639)
Median real estate property taxes paid for housing units with mortgages in 2022: $2,094 (1.2%) Median real estate property taxes paid for housing units with no mortgage in 2022: $1,586 (1.1%)
Business Search- 14 Million verified businesses
Males: 1,098
(50.2%)
Females: 1,088
(49.8%)
For population 25 years and over in 45724:
High school or higher: 83.9%
Bachelor's degree or higher: 8.1%
Graduate or professional degree: 2.4%
Unemployed: 3.7%
Mean travel time to work (commute): 29.8 minutes
For population 15 years and over in 45724:
Never married: 34.8%
Now married: 50.2%
Separated: 2.1%
Widowed: 4.7%
Divorced: 8.2%
Zip code 45724 compared to state average:
Black race population percentage below state average.
Hispanic race population percentage significantly below state average.
Foreign-born population percentage significantly below state average.
Renting percentage below state average.
Length of stay since moving in significantly above state average.
House age below state average.
Percentage of population with a bachelor's degree or higher significantly below state average.
Estimated median house/condo value in 2022: $162,122
45724:
$162,122
Ohio:
$204,100
According to our research of Ohio and other state lists, there was 1 registered sex offender living in 45724 zip code as of June 09, 2024. The ratio of all residents to sex offenders in zip code 45724 is 1,946 to 1. The ratio of registered sex offenders to all residents in this zip code is much lower than the state average.
Median resident age:
This zip code:
40.4 years
Ohio median age:
39.9 years
Average household size:
This zip code:
2.4 people
Ohio:
2.4 people
Averages for the 2020 tax year for zip code 45724, filed in 2021:
Average Adjusted Gross Income (AGI) in 2020: $53,520 (Individual Income Tax Returns)
Here:
$53,520
State:
$67,288
Salary/wage: $47,147 (reported on 77.5% of returns)
Here:
$47,147
State:
$55,628
(% of AGI for various income ranges: 1175.3% for AGIs below $25k, 2953.9% for AGIs $25k-50k, 5958.8% for AGIs $50k-75k, 8655.0% for AGIs $75k-100k, 14271.4% for AGIs $100k-200k)
Taxable interest for individuals: $441 (reported on 27.5% of returns)
This zip code:
$441
Ohio:
$1,518
(% of AGI for various income ranges: 9.5% for AGIs below $25k, 4.4% for AGIs $25k-50k, 21.2% for AGIs $50k-75k, 10.0% for AGIs $75k-100k, 65.7% for AGIs $100k-200k)
Ordinary dividends: $3,743 (reported on 8.8% of returns)
Here:
$3,743
State:
$7,167
(% of AGI for various income ranges: 10.0% for AGIs below $25k, 28.7% for AGIs $50k-75k, 314.3% for AGIs $100k-200k)
Net capital gain/loss in AGI: +$6,250 (reported on 10.0% of returns)
Here:
+$6,250
State:
+$18,919
(% of AGI for various income ranges: 25.8% for AGIs below $25k, 255.0% for AGIs $50k-75k, 352.9% for AGIs $100k-200k)
Profit/loss from business: +$11,210 (reported on 12.5% of returns)
Here:
+$11,210
State:
+$13,744
(% of AGI for various income ranges: 107.9% for AGIs below $25k, 303.9% for AGIs $25k-50k, 461.2% for AGIs $75k-100k)
Taxable individual retirement arrangement distribution: $15,050 (reported on 10.0% of returns)
45724:
$15,050
Ohio:
$18,876
(% of AGI for various income ranges: 267.8% for AGIs $25k-50k, 902.5% for AGIs $75k-100k)
Earned income credit: $2,500 (reported on 16.2% of returns)
Here:
$2,500
State:
$2,304
(% of AGI for various income ranges: 104.7% for AGIs below $25k, 70.0% for AGIs $25k-50k)
Percentage of individuals using paid preparers for their 2020 taxes: 96.2%
Here:
96%
State:
94%
(% for various income ranges: 96.2% for AGIs below $25k, 95.7% for AGIs $25k-50k, 100.0% for AGIs $50k-75k, 90.0% for AGIs $75k-100k, 100.0% for AGIs $100k-200k)
Averages for the 2012 tax year for zip code 45724, filed in 2013:
Average Adjusted Gross Income (AGI) in 2012: $40,981 (Individual Income Tax Returns)
Here:
$40,981
State:
$54,926
Salary/wage: $36,439 (reported on 82.6% of returns)
Here:
$36,439
State:
$45,869
(% of AGI for various income ranges: 70.3% for AGIs below $25k, 76.1% for AGIs $25k-50k, 73.1% for AGIs $50k-75k, 76.6% for AGIs $75k-100k, 70.1% for AGIs $100k-200k)
Taxable interest for individuals: $433 (reported on 26.1% of returns)
This zip code:
$433
Ohio:
$1,297
(% of AGI for various income ranges: 0.6% for AGIs below $25k, 0.2% for AGIs $25k-50k, 0.3% for AGIs $50k-75k, 0.4% for AGIs $75k-100k, 0.1% for AGIs $100k-200k)
Ordinary dividends: $2,033 (reported on 8.7% of returns)
Here:
$2,033
State:
$5,821
(% of AGI for various income ranges: 1.1% for AGIs $25k-50k, 0.8% for AGIs $75k-100k)
Net capital gain/loss in AGI: +$700 (reported on 5.8% of returns)
Here:
+$700
State:
+$11,232
(% of AGI for various income ranges: 0.5% for AGIs $50k-75k)
Profit/loss from business: +$6,256 (reported on 13.0% of returns)
Here:
+$6,256
State:
+$12,773
(% of AGI for various income ranges: 7.6% for AGIs below $25k, 1.8% for AGIs $25k-50k, 3.1% for AGIs $50k-75k)
Taxable individual retirement arrangement distribution: $13,150 (reported on 8.7% of returns)
45724:
$13,150
Ohio:
$14,511
(% of AGI for various income ranges: 6.5% for AGIs below $25k, 10.1% for AGIs $50k-75k)
Total itemized deductions: $16,131 (20% of AGI, reported on 18.8% of returns)
Here:
$16,131
State:
$21,278
Here:
20.2% of AGI
State:
18.8% of AGI
(% of AGI for various income ranges: 5.7% for AGIs $25k-50k, 7.6% for AGIs $50k-75k, 9.0% for AGIs $75k-100k, 11.5% for AGIs $100k-200k)
Charity contributions: $2,750 (reported on 11.6% of returns)
Here:
$2,750
State:
$3,943
(% of AGI for various income ranges: 1.8% for AGIs $50k-75k, 1.7% for AGIs $100k-200k)
Taxes paid: $4,446 (reported on 18.8% of returns)
45724:
$4,446
State:
$9,568
(% of AGI for various income ranges: 1.0% for AGIs $25k-50k, 1.8% for AGIs $50k-75k, 2.3% for AGIs $75k-100k, 4.1% for AGIs $100k-200k)
Earned income credit: $2,093 (reported on 21.7% of returns)
Here:
$2,093
State:
$2,285
(% of AGI for various income ranges: 6.5% for AGIs below $25k, 1.3% for AGIs $25k-50k)
Percentage of individuals using paid preparers for their 2012 taxes: 55.1%
Here:
55%
State:
51%
(% for various income ranges: 50.0% for AGIs below $25k, 60.0% for AGIs $25k-50k, 55.6% for AGIs $50k-75k, 66.7% for AGIs $75k-100k, 50.0% for AGIs $100k-200k)
Averages for the 2004 tax year for zip code 45724, filed in 2005:
Average Adjusted Gross Income (AGI) in 2004: $34,725 (Individual Income Tax Returns)
Here:
$34,725
State:
$44,480
Salary/wage: $32,312 (reported on 86.3% of returns)
Here:
$32,312
State:
$39,198
(% of AGI for various income ranges: 132.2% for AGIs below $10k, 78.0% for AGIs $10k-25k, 79.7% for AGIs $25k-50k, 83.4% for AGIs $50k-75k, 89.3% for AGIs $75k-100k, 61.1% for AGIs over 100k)
Taxable interest for individuals: $927 (reported on 37.3% of returns)
This zip code:
$927
Ohio:
$1,532
(% of AGI for various income ranges: 9.7% for AGIs below $10k, 1.4% for AGIs $10k-25k, 0.9% for AGIs $25k-50k, 0.7% for AGIs $50k-75k, 0.7% for AGIs $75k-100k, 0.3% for AGIs over 100k)
Taxable dividends: $1,359 (reported on 11.9% of returns)
Here:
$1,359
State:
$3,496
(% of AGI for various income ranges: 0.4% for AGIs $10k-25k, 0.5% for AGIs $25k-50k, 0.7% for AGIs $50k-75k, 0.4% for AGIs $75k-100k)
Net capital gain/loss: +$56 (reported on 8.2% of returns)
Here:
+$56
State:
+$8,582
(% of AGI for various income ranges: -1.2% for AGIs below $10k, 0.1% for AGIs $25k-50k, 0.2% for AGIs $50k-75k, -0.3% for AGIs $75k-100k)
Profit/loss from business: +$5,812 (reported on 12.2% of returns)
Here:
+$5,812
State:
+$10,813
(% of AGI for various income ranges: 11.9% for AGIs below $10k, 2.8% for AGIs $10k-25k, 3.0% for AGIs $25k-50k, 1.8% for AGIs $50k-75k)
IRA payment deduction: $1,000 (reported on 1.8% of returns)
45724:
$1,000
Ohio:
$2,794
Total itemized deductions: $14,056 (22% of AGI, reported on 19.0% of returns)
Here:
$14,056
State:
$17,503
Here:
21.7% of AGI
State:
20.8% of AGI
(% of AGI for various income ranges: 8.1% for AGIs $25k-50k, 9.4% for AGIs $50k-75k, 12.2% for AGIs $75k-100k, 7.9% for AGIs over 100k)
Charity contributions deductions: $1,818 (3% of AGI, reported on 13.4% of returns)
Here:
$1,818
State:
$3,087
Here:
2.8% of AGI
State:
3.4% of AGI
(% of AGI for various income ranges: 0.3% for AGIs $25k-50k, 1.2% for AGIs $50k-75k, 1.1% for AGIs $75k-100k, 1.0% for AGIs over 100k)
Total tax: $4,055 (reported on 72.3% of returns)
45724:
$4,055
State:
$6,781
(% of AGI for various income ranges: 3.4% for AGIs below $10k, 3.5% for AGIs $10k-25k, 6.2% for AGIs $25k-50k, 8.8% for AGIs $50k-75k, 10.2% for AGIs $75k-100k, 16.4% for AGIs over 100k)
Earned income credit: $1,685 (reported on 19.3% of returns)
Here:
$1,685
State:
$1,696
Percentage of individuals using paid preparers for their 2004 taxes: 56.2%
Here:
56%
State:
55%
(% for various income ranges: 46.1% for AGIs below $10k, 56.3% for AGIs $10k-25k, 60.2% for AGIs $25k-50k, 61.4% for AGIs $50k-75k, 48.6% for AGIs $75k-100k, 65.2% for AGIs over 100k)
Household received Food Stamps/SNAP in the past 12 months: 99 Household did not receive Food Stamps/SNAP in the past 12 months: 794
Women who had a birth in the past 12 months: 53 (31 now married, 21 unmarried) Women who did not have a birth in the past 12 months: 455 (198 now married, 257 unmarried)
Housing units in zip code 45724 with a mortgage: 343 (11 second mortgage, 11 both second mortgage and home equity loan) Median monthly owner costs for units with a mortgage: $1,373 Median monthly owner costs for units without a mortgage: $479
Residents with income below the poverty level in 2022:
This zip code:
17.2%
Whole state:
13.4%
Residents with income below 50% of the poverty level in 2022:
This zip code:
13.2%
Whole state:
7.0%
Median number of rooms in houses and condos:
Here:
6.9
State:
6.7
Median number of rooms in apartments:
Here:
5.0
State:
4.4
Notable locations in this zip code not listed on our city pages
Cemeteries: Mount Liberty Chapel Cemetery (1), Union Cemetery (2), Smith Cemetery (3), Sawyer Cemetery (4), Mission Cemetery (5), Miller Cemetery (6), Ladd Cemetery (7). Display/hide their locations on the map
Streams, rivers, and creeks: Ellis Run (A), Burnett Run (B), Falls Creek (C), South Fork Gilbert Run (D), Wildcat Run (E), Long Run (F), Laurel Run (G). Display/hide their locations on the map
Size of family households: 265 2-persons, 82 3-persons, 136 4-persons, 47 5-persons, 7 6-persons, 26 7-or-more-persons
Size of nonfamily households: 240 1-person, 86 2-persons
283 married couples with children.
50 single-parent households (50 women).
87.9% of residents of 45724 zip code speak English at home.
0.4% of residents speak Spanish at home (100% very well).
11.9% of residents speak other Indo-European language at home (100% very well).
Foreign born population: 0 (0.0%)
:
0.0%
Whole state:
5.0%
56%German
16%English
9%American
5%Irish
2%European
Housing units lacking complete plumbing facilities: 0.9%
30.6%Utility gas
23.1%Electricity
23.0%Bottled, tank, or LP gas
8.3%Wood
7.8%Fuel oil, kerosene, etc.
7.5%Other fuel
Population in 1990: 2,624.
Place of birth for U.S.-born residents:
This state: 1,647
Northeast: 10
Midwest: 16
South: 475
West: 23
71% of the 45724 zip code residents lived in the same house 5 years ago. Out of people who lived in different houses, 51% lived in this county. Out of people who lived in different counties, 50% lived in Ohio.
85% of the 45724 zip code residents lived in the same house 1 year ago. Out of people who lived in different houses, 80% moved from this county. Out of people who lived in different houses, 13% moved from different county within same state.
Private vs. public school enrollment:
Students in private schools in grades 1 to 8 (elementary and middle school): 28
Here:
13.7%
Ohio:
16.0%
Students in private schools in grades 9 to 12 (high school):
Here:
0.0%
Ohio:
13.1%
Students in private undergraduate colleges:
Here:
0.0%
Ohio:
22.3%
Occupation by median earnings in the past 12 months ($)
91,933Building and grounds cleaning and maintenance occupations
77,261Production occupations
45,259Construction and extraction occupations
43,065Office and administrative support occupations
33,952Education, training, and library occupations
6,309Healthcare support occupations
Top industries in this zip code by the number of employees in 2005:
Construction: Highway, Street, and Bridge Construction (10-19 employees: 1 establishment)
Construction: New Single-Family Housing Construction (except Operative Builders) (1-4: 2)
Construction: Masonry Contractors (1-4: 1)
Fatal accident statistics in 2011:
Fatal accident count: 2
Vehicles involved in fatal accidents: 2
Fatal accidents caused by drunken drivers: 0
Fatalities: 2
Persons involved in fatal accidents: 2
Pedestrians involved in fatal accidents: 0
Home Mortgage Disclosure Act Aggregated Statistics For Year 2009 (Based on 2 partial tracts)
A) FHA, FSA/RHS & VA Home Purchase Loans
B) Conventional Home Purchase Loans
C) Refinancings
D) Home Improvement Loans
F) Non-occupant Loans on < 5 Family Dwellings (A B C & D)
G) Loans On Manufactured Home Dwelling (A B C & D)
Number
Average Value
Number
Average Value
Number
Average Value
Number
Average Value
Number
Average Value
Number
Average Value
LOANS ORIGINATED
5
$90,114
21
$114,331
73
$111,486
4
$44,665
3
$85,933
12
$62,753
APPLICATIONS APPROVED, NOT ACCEPTED
1
$46,230
1
$44,670
5
$116,914
1
$90,110
0
$0
1
$30,560
APPLICATIONS DENIED
2
$64,645
11
$93,320
33
$127,869
5
$41,844
2
$58,770
5
$48,114
APPLICATIONS WITHDRAWN
1
$57,200
2
$164,165
22
$118,324
2
$89,330
0
$0
1
$87,760
FILES CLOSED FOR INCOMPLETENESS
0
$0
1
$27,430
5
$81,338
2
$55,635
0
$0
2
$28,210
Aggregated Statistics For Year 2008 (Based on 2 partial tracts)
A) FHA, FSA/RHS & VA Home Purchase Loans
B) Conventional Home Purchase Loans
C) Refinancings
D) Home Improvement Loans
F) Non-occupant Loans on < 5 Family Dwellings (A B C & D)
G) Loans On Manufactured Home Dwelling (A B C & D)
Number
Average Value
Number
Average Value
Number
Average Value
Number
Average Value
Number
Average Value
Number
Average Value
LOANS ORIGINATED
11
$96,026
16
$119,548
51
$116,403
17
$23,462
5
$62,532
13
$60,156
APPLICATIONS APPROVED, NOT ACCEPTED
1
$52,500
1
$66,610
5
$90,740
1
$23,510
0
$0
1
$55,640
APPLICATIONS DENIED
2
$61,905
5
$78,830
31
$127,828
7
$70,636
1
$25,080
9
$80,101
APPLICATIONS WITHDRAWN
0
$0
2
$55,245
13
$118,625
2
$34,085
1
$89,330
0
$0
FILES CLOSED FOR INCOMPLETENESS
2
$26,250
1
$31,340
2
$56,420
0
$0
1
$48,580
0
$0
Aggregated Statistics For Year 2007 (Based on 2 partial tracts)
A) FHA, FSA/RHS & VA Home Purchase Loans
B) Conventional Home Purchase Loans
C) Refinancings
D) Home Improvement Loans
F) Non-occupant Loans on < 5 Family Dwellings (A B C & D)
G) Loans On Manufactured Home Dwelling (A B C & D)
Number
Average Value
Number
Average Value
Number
Average Value
Number
Average Value
Number
Average Value
Number
Average Value
LOANS ORIGINATED
6
$108,137
53
$129,028
59
$109,691
11
$33,054
10
$102,025
18
$64,603
APPLICATIONS APPROVED, NOT ACCEPTED
2
$96,775
4
$108,528
6
$88,285
3
$79,143
0
$0
1
$43,100
APPLICATIONS DENIED
2
$73,660
12
$108,268
45
$87,589
17
$36,599
2
$88,940
15
$70,733
APPLICATIONS WITHDRAWN
2
$95,205
3
$103,437
16
$138,306
2
$56,420
0
$0
2
$48,190
FILES CLOSED FOR INCOMPLETENESS
1
$61,120
2
$45,450
3
$119,630
0
$0
0
$0
1
$47,020
Aggregated Statistics For Year 2006 (Based on 2 partial tracts)
A) FHA, FSA/RHS & VA Home Purchase Loans
B) Conventional Home Purchase Loans
C) Refinancings
D) Home Improvement Loans
F) Non-occupant Loans on < 5 Family Dwellings (A B C & D)
G) Loans On Manufactured Home Dwelling (A B C & D)
Number
Average Value
Number
Average Value
Number
Average Value
Number
Average Value
Number
Average Value
Number
Average Value
LOANS ORIGINATED
9
$115,102
42
$100,282
67
$91,880
20
$33,028
6
$99,517
19
$54,852
APPLICATIONS APPROVED, NOT ACCEPTED
1
$140,260
9
$82,713
14
$86,476
3
$63,210
1
$19,590
5
$38,396
APPLICATIONS DENIED
5
$93,718
13
$88,185
76
$93,042
13
$32,188
2
$9,010
20
$57,321
APPLICATIONS WITHDRAWN
1
$68,170
5
$103,592
28
$118,268
2
$83,060
0
$0
4
$64,647
FILES CLOSED FOR INCOMPLETENESS
0
$0
1
$13,320
13
$109,523
1
$47,020
1
$65,820
1
$13,320
Aggregated Statistics For Year 2005 (Based on 2 partial tracts)
A) FHA, FSA/RHS & VA Home Purchase Loans
B) Conventional Home Purchase Loans
C) Refinancings
D) Home Improvement Loans
F) Non-occupant Loans on < 5 Family Dwellings (A B C & D)
G) Loans On Manufactured Home Dwelling (A B C & D)
Number
Average Value
Number
Average Value
Number
Average Value
Number
Average Value
Number
Average Value
Number
Average Value
LOANS ORIGINATED
9
$108,659
41
$110,105
62
$95,637
15
$17,291
8
$74,050
19
$56,543
APPLICATIONS APPROVED, NOT ACCEPTED
0
$0
10
$74,129
18
$72,527
2
$26,640
2
$47,410
5
$69,898
APPLICATIONS DENIED
2
$92,465
25
$76,197
80
$96,559
10
$26,172
2
$28,995
27
$63,907
APPLICATIONS WITHDRAWN
1
$59,550
13
$72,815
40
$103,024
8
$157,308
3
$44,143
12
$64,973
FILES CLOSED FOR INCOMPLETENESS
0
$0
1
$81,490
4
$87,568
1
$2,350
0
$0
2
$55,635
Aggregated Statistics For Year 2004 (Based on 2 partial tracts)
A) FHA, FSA/RHS & VA Home Purchase Loans
B) Conventional Home Purchase Loans
C) Refinancings
D) Home Improvement Loans
F) Non-occupant Loans on < 5 Family Dwellings (A B C & D)
G) Loans On Manufactured Home Dwelling (A B C & D)
Number
Average Value
Number
Average Value
Number
Average Value
Number
Average Value
Number
Average Value
Number
Average Value
LOANS ORIGINATED
4
$76,792
52
$97,799
89
$93,213
14
$31,568
5
$172,548
26
$52,079
APPLICATIONS APPROVED, NOT ACCEPTED
2
$121,065
7
$87,316
16
$71,406
2
$54,070
2
$47,410
4
$50,542
APPLICATIONS DENIED
3
$37,090
16
$60,680
53
$96,516
10
$22,176
2
$36,830
23
$59,349
APPLICATIONS WITHDRAWN
1
$68,960
8
$90,995
43
$91,335
5
$38,554
2
$36,830
7
$65,374
FILES CLOSED FOR INCOMPLETENESS
0
$0
0
$0
2
$114,015
1
$15,670
0
$0
1
$50,930
Aggregated Statistics For Year 2003 (Based on 2 partial tracts)
A) FHA, FSA/RHS & VA Home Purchase Loans
B) Conventional Home Purchase Loans
C) Refinancings
D) Home Improvement Loans
F) Non-occupant Loans on < 5 Family Dwellings (A B C & D)
Number
Average Value
Number
Average Value
Number
Average Value
Number
Average Value
Number
Average Value
LOANS ORIGINATED
4
$107,550
49
$93,952
150
$87,565
12
$8,032
5
$60,494
APPLICATIONS APPROVED, NOT ACCEPTED
2
$50,150
8
$86,392
23
$86,400
0
$0
1
$47,800
APPLICATIONS DENIED
2
$49,760
20
$76,871
78
$72,453
7
$5,150
2
$24,685
APPLICATIONS WITHDRAWN
0
$0
6
$73,005
36
$88,939
2
$21,155
1
$20,370
FILES CLOSED FOR INCOMPLETENESS
0
$0
1
$67,390
4
$76,010
2
$27,820
1
$90,110
Aggregated Statistics For Year 2002 (Based on 2 partial tracts)
A) FHA, FSA/RHS & VA Home Purchase Loans
B) Conventional Home Purchase Loans
C) Refinancings
D) Home Improvement Loans
F) Non-occupant Loans on < 5 Family Dwellings (A B C & D)
Number
Average Value
Number
Average Value
Number
Average Value
Number
Average Value
Number
Average Value
LOANS ORIGINATED
6
$112,968
46
$95,412
114
$84,292
16
$13,468
2
$43,880
APPLICATIONS APPROVED, NOT ACCEPTED
1
$86,200
5
$61,748
20
$73,698
2
$16,845
2
$54,070
APPLICATIONS DENIED
1
$113,620
18
$68,522
63
$62,713
6
$14,105
1
$10,970
APPLICATIONS WITHDRAWN
1
$47,800
4
$53,090
31
$91,757
2
$17,630
2
$39,965
FILES CLOSED FOR INCOMPLETENESS
0
$0
2
$39,965
9
$92,464
1
$15,670
0
$0
Aggregated Statistics For Year 2001 (Based on 2 partial tracts)
A) FHA, FSA/RHS & VA Home Purchase Loans
B) Conventional Home Purchase Loans
C) Refinancings
D) Home Improvement Loans
F) Non-occupant Loans on < 5 Family Dwellings (A B C & D)
Number
Average Value
Number
Average Value
Number
Average Value
Number
Average Value
Number
Average Value
LOANS ORIGINATED
2
$123,810
39
$77,737
115
$77,835
20
$16,260
2
$43,880
APPLICATIONS APPROVED, NOT ACCEPTED
1
$32,910
9
$44,839
16
$61,856
2
$23,115
1
$16,460
APPLICATIONS DENIED
1
$105,000
29
$43,314
49
$60,337
7
$5,373
3
$38,657
APPLICATIONS WITHDRAWN
0
$0
7
$49,031
21
$72,987
2
$3,525
0
$0
FILES CLOSED FOR INCOMPLETENESS
0
$0
0
$0
1
$53,280
0
$0
1
$53,280
Aggregated Statistics For Year 2000 (Based on 2 partial tracts)
A) FHA, FSA/RHS & VA Home Purchase Loans
B) Conventional Home Purchase Loans
C) Refinancings
D) Home Improvement Loans
F) Non-occupant Loans on < 5 Family Dwellings (A B C & D)
Number
Average Value
Number
Average Value
Number
Average Value
Number
Average Value
Number
Average Value
LOANS ORIGINATED
2
$82,670
45
$79,126
64
$58,795
16
$17,337
9
$42,401
APPLICATIONS APPROVED, NOT ACCEPTED
0
$0
10
$69,035
18
$53,938
3
$29,517
1
$78,360
APPLICATIONS DENIED
0
$0
24
$45,971
40
$46,722
9
$14,714
2
$63,470
APPLICATIONS WITHDRAWN
0
$0
9
$100,213
13
$51,055
2
$11,755
0
$0
FILES CLOSED FOR INCOMPLETENESS
0
$0
1
$30,560
3
$63,210
0
$0
0
$0
Aggregated Statistics For Year 1999 (Based on 1 partial tract)
B) Conventional Home Purchase Loans
C) Refinancings
D) Home Improvement Loans
F) Non-occupant Loans on < 5 Family Dwellings (A B C & D)
Detailed PMIC statistics for the following Tracts:0217.00
2002 - 2018 National Fire Incident Reporting System (NFIRS) incidents
Based on the data from the years 2002 - 2018 the average number of fires per year is 7. The highest number of fire incidents - 13 took place in 2018, and the least - 3 in 2005. The data has a growing trend.
When looking into fire subcategories, the most reports belonged to: Structure Fires (51.6%), and Outside Fires (32.3%).
Fire incident types reported to NFIRS in Zip Code 45724


 Nearest zip codes: 45778, 45742, 45784, 43728, 45711, 43787.


 Based on the data from the years 2002 - 2018 the average number of fires per year is 7. The highest number of fire incidents - 13 took place in 2018, and the least - 3 in 2005. The data has a growing trend.
 When looking into fire subcategories, the most reports belonged to: Structure Fires (51.6%), and Outside Fires (32.3%).