Estimated zip code population in 2022: 3,422 Zip code population in 2010: 3,432 Zip code population in 2000: 3,522
Houses and condos: 1,679 Renter-occupied apartments: 460
% of renters here:
31%
State:
33%
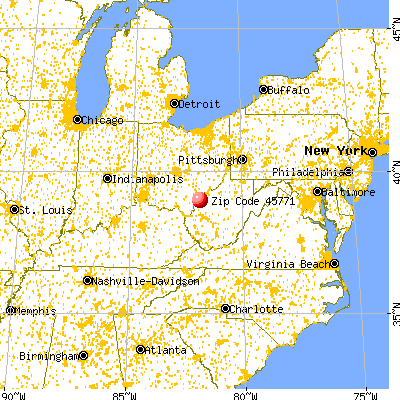
March 2022 cost of living index in zip code 45771: 82.9 (low, U.S. average is 100)
Land area: 61.7 sq. mi. Water area: 1.2 sq. mi.
Population density: 55 people per square mile
(very low).
OSM Map
General Map
Google Map
MSN Map
OSM Map
General Map
Google Map
MSN Map
OSM Map
General Map
Google Map
MSN Map
OSM Map
General Map
Google Map
MSN Map
Please wait while loading the map...
Real estate property taxes paid for housing units in 2022:
This zip code:
0.8% ($1,083)
Ohio:
1.3% ($2,639)
Median real estate property taxes paid for housing units with mortgages in 2022: $1,213 (0.9%) Median real estate property taxes paid for housing units with no mortgage in 2022: $939 (0.7%)
Business Search- 14 Million verified businesses
Males: 1,779
(52.0%)
Females: 1,643
(48.0%)
For population 25 years and over in 45771:
High school or higher: 89.7%
Bachelor's degree or higher: 12.9%
Graduate or professional degree: 2.6%
Unemployed: 0.4%
Mean travel time to work (commute): 32.0 minutes
For population 15 years and over in 45771:
Never married: 17.6%
Now married: 56.0%
Separated: 2.3%
Widowed: 9.5%
Divorced: 14.6%
Zip code 45771 compared to state average:
Unemployed percentage significantly below state average.
Black race population percentage significantly below state average.
Hispanic race population percentage below state average.
Median age above state average.
Foreign-born population percentage significantly below state average.
Length of stay since moving in significantly above state average.
Number of college students below state average.
Percentage of population with a bachelor's degree or higher significantly below state average.
Estimated median house/condo value in 2022: $136,735
45771:
$136,735
Ohio:
$204,100
According to our research of Ohio and other state lists, there were 5 registered sex offenders living in 45771 zip code as of May 28, 2024. The ratio of all residents to sex offenders in zip code 45771 is 758 to 1. The ratio of registered sex offenders to all residents in this zip code is lower than the state average.
Median resident age:
This zip code:
44.6 years
Ohio median age:
39.9 years
Average household size:
This zip code:
2.3 people
Ohio:
2.4 people
Averages for the 2020 tax year for zip code 45771, filed in 2021:
Average Adjusted Gross Income (AGI) in 2020: $50,663 (Individual Income Tax Returns)
Here:
$50,663
State:
$67,288
Salary/wage: $45,524 (reported on 79.0% of returns)
Here:
$45,524
State:
$55,628
(% of AGI for various income ranges: 1102.4% for AGIs below $25k, 3143.2% for AGIs $25k-50k, 5579.5% for AGIs $50k-75k, 8665.0% for AGIs $75k-100k, 14202.3% for AGIs $100k-200k)
Taxable interest for individuals: $498 (reported on 27.2% of returns)
This zip code:
$498
Ohio:
$1,518
(% of AGI for various income ranges: 10.7% for AGIs below $25k, 24.6% for AGIs $25k-50k, 8.6% for AGIs $50k-75k, 17.0% for AGIs $75k-100k, 36.9% for AGIs $100k-200k)
Ordinary dividends: $1,713 (reported on 9.3% of returns)
Here:
$1,713
State:
$7,167
(% of AGI for various income ranges: 16.9% for AGIs below $25k, 5.4% for AGIs $25k-50k, 28.6% for AGIs $50k-75k, 81.5% for AGIs $100k-200k)
Net capital gain/loss in AGI: +$2,143 (reported on 8.6% of returns)
Here:
+$2,143
State:
+$18,919
(% of AGI for various income ranges: 0.7% for AGIs below $25k, 15.1% for AGIs $25k-50k, 47.1% for AGIs $50k-75k, 109.2% for AGIs $100k-200k)
Profit/loss from business: +$10,844 (reported on 9.9% of returns)
Here:
+$10,844
State:
+$13,744
(% of AGI for various income ranges: 144.3% for AGIs below $25k, 71.9% for AGIs $25k-50k, 227.6% for AGIs $50k-75k, 296.2% for AGIs $100k-200k)
Taxable individual retirement arrangement distribution: $15,053 (reported on 9.3% of returns)
45771:
$15,053
Ohio:
$18,876
(% of AGI for various income ranges: 48.8% for AGIs below $25k, 128.6% for AGIs $25k-50k, 363.8% for AGIs $50k-75k, 625.4% for AGIs $100k-200k)
Total itemized deductions: $26,300 (reported on 1.9% of returns)
Here:
$26,300
State:
$33,869
(% of AGI for various income ranges: 375.7% for AGIs $50k-75k)
Taxes paid: $5,333 (reported on 1.9% of returns)
45771:
$5,333
State:
$7,681
(% of AGI for various income ranges: 160.0% for AGIs $75k-100k)
Earned income credit: $2,369 (reported on 16.0% of returns)
Here:
$2,369
State:
$2,304
(% of AGI for various income ranges: 92.4% for AGIs below $25k, 61.6% for AGIs $25k-50k)
Percentage of individuals using paid preparers for their 2020 taxes: 94.4%
Here:
94%
State:
94%
(% for various income ranges: 92.9% for AGIs below $25k, 93.5% for AGIs $25k-50k, 96.2% for AGIs $50k-75k, 92.9% for AGIs $75k-100k, 111.1% for AGIs $100k-200k, 0.0% for AGIs over 200k)
Averages for the 2012 tax year for zip code 45771, filed in 2013:
Average Adjusted Gross Income (AGI) in 2012: $42,024 (Individual Income Tax Returns)
Here:
$42,024
State:
$54,926
Salary/wage: $37,516 (reported on 83.1% of returns)
Here:
$37,516
State:
$45,869
(% of AGI for various income ranges: 67.4% for AGIs below $25k, 71.6% for AGIs $25k-50k, 78.9% for AGIs $50k-75k, 79.1% for AGIs $75k-100k, 72.7% for AGIs $100k-200k)
Taxable interest for individuals: $1,146 (reported on 27.5% of returns)
This zip code:
$1,146
Ohio:
$1,297
(% of AGI for various income ranges: 1.1% for AGIs below $25k, 1.1% for AGIs $25k-50k, 0.8% for AGIs $50k-75k, 0.2% for AGIs $75k-100k, 0.6% for AGIs $100k-200k)
Ordinary dividends: $1,433 (reported on 10.6% of returns)
Here:
$1,433
State:
$5,821
(% of AGI for various income ranges: 0.3% for AGIs below $25k, 0.4% for AGIs $25k-50k, 0.5% for AGIs $50k-75k, 0.3% for AGIs $75k-100k, 0.3% for AGIs $100k-200k)
Net capital gain/loss in AGI: +$4,430 (reported on 7.0% of returns)
Here:
+$4,430
State:
+$11,232
(% of AGI for various income ranges: 0.4% for AGIs below $25k, 0.6% for AGIs $25k-50k, 0.7% for AGIs $50k-75k, 2.4% for AGIs $75k-100k)
Profit/loss from business: +$6,805 (reported on 14.1% of returns)
Here:
+$6,805
State:
+$12,773
(% of AGI for various income ranges: 6.4% for AGIs below $25k, 0.6% for AGIs $25k-50k, 0.4% for AGIs $50k-75k, 1.4% for AGIs $75k-100k, 4.1% for AGIs $100k-200k)
Taxable individual retirement arrangement distribution: $13,760 (reported on 7.0% of returns)
45771:
$13,760
Ohio:
$14,511
(% of AGI for various income ranges: 2.5% for AGIs below $25k, 3.9% for AGIs $25k-50k, 6.0% for AGIs $75k-100k)
Total itemized deductions: $16,759 (21% of AGI, reported on 15.5% of returns)
Here:
$16,759
State:
$21,278
Here:
20.9% of AGI
State:
18.8% of AGI
(% of AGI for various income ranges: 2.9% for AGIs below $25k, 5.0% for AGIs $25k-50k, 5.7% for AGIs $50k-75k, 5.8% for AGIs $75k-100k, 9.8% for AGIs $100k-200k)
Charity contributions: $3,458 (reported on 8.5% of returns)
Here:
$3,458
State:
$3,943
(% of AGI for various income ranges: 0.7% for AGIs $25k-50k, 0.9% for AGIs $50k-75k, 1.5% for AGIs $100k-200k)
Taxes paid: $4,400 (reported on 15.5% of returns)
45771:
$4,400
State:
$9,568
(% of AGI for various income ranges: 0.4% for AGIs below $25k, 0.8% for AGIs $25k-50k, 1.2% for AGIs $50k-75k, 1.7% for AGIs $75k-100k, 3.5% for AGIs $100k-200k)
Earned income credit: $2,129 (reported on 21.8% of returns)
Here:
$2,129
State:
$2,285
(% of AGI for various income ranges: 6.5% for AGIs below $25k, 1.1% for AGIs $25k-50k)
Percentage of individuals using paid preparers for their 2012 taxes: 59.2%
Here:
59%
State:
51%
(% for various income ranges: 52.5% for AGIs below $25k, 56.1% for AGIs $25k-50k, 65.0% for AGIs $50k-75k, 75.0% for AGIs $75k-100k, 80.0% for AGIs $100k-200k)
Averages for the 2004 tax year for zip code 45771, filed in 2005:
Average Adjusted Gross Income (AGI) in 2004: $32,908 (Individual Income Tax Returns)
Here:
$32,908
State:
$44,480
Salary/wage: $30,562 (reported on 83.7% of returns)
Here:
$30,562
State:
$39,198
(% of AGI for various income ranges: 85.5% for AGIs below $10k, 67.4% for AGIs $10k-25k, 80.6% for AGIs $25k-50k, 84.9% for AGIs $50k-75k, 83.3% for AGIs $75k-100k, 58.4% for AGIs over 100k)
Taxable interest for individuals: $1,384 (reported on 37.5% of returns)
This zip code:
$1,384
Ohio:
$1,532
(% of AGI for various income ranges: 3.8% for AGIs below $10k, 2.3% for AGIs $10k-25k, 1.4% for AGIs $25k-50k, 1.1% for AGIs $50k-75k, 1.6% for AGIs $75k-100k, 2.0% for AGIs over 100k)
Taxable dividends: $1,047 (reported on 13.2% of returns)
Here:
$1,047
State:
$3,496
(% of AGI for various income ranges: 0.3% for AGIs below $10k, 0.5% for AGIs $10k-25k, 0.3% for AGIs $25k-50k, 0.1% for AGIs $50k-75k, 0.8% for AGIs $75k-100k, 1.0% for AGIs over 100k)
Net capital gain/loss: +$3,893 (reported on 10.3% of returns)
Here:
+$3,893
State:
+$8,582
(% of AGI for various income ranges: 0.7% for AGIs below $10k, 0.3% for AGIs $10k-25k, 1.1% for AGIs $25k-50k, 0.7% for AGIs $50k-75k, 0.9% for AGIs $75k-100k, 4.5% for AGIs over 100k)
Profit/loss from business: +$6,332 (reported on 14.6% of returns)
Here:
+$6,332
State:
+$10,813
(% of AGI for various income ranges: 11.8% for AGIs below $10k, 3.4% for AGIs $10k-25k, 1.8% for AGIs $25k-50k, 0.8% for AGIs $50k-75k, -0.4% for AGIs $75k-100k, 10.4% for AGIs over 100k)
IRA payment deduction: $2,692 (reported on 1.8% of returns)
45771:
$2,692
Ohio:
$2,794
Total itemized deductions: $13,227 (21% of AGI, reported on 15.9% of returns)
Here:
$13,227
State:
$17,503
Here:
21.2% of AGI
State:
20.8% of AGI
(% of AGI for various income ranges: 3.0% for AGIs $10k-25k, 5.6% for AGIs $25k-50k, 7.2% for AGIs $50k-75k, 9.1% for AGIs $75k-100k, 9.7% for AGIs over 100k)
Charity contributions deductions: $2,799 (4% of AGI, reported on 9.3% of returns)
Here:
$2,799
State:
$3,087
Here:
3.9% of AGI
State:
3.4% of AGI
(% of AGI for various income ranges: 2.1% for AGIs below $10k, 0.6% for AGIs $25k-50k, 0.4% for AGIs $50k-75k, 1.5% for AGIs $75k-100k, 2.1% for AGIs over 100k)
Total tax: $3,747 (reported on 74.0% of returns)
45771:
$3,747
State:
$6,781
(% of AGI for various income ranges: 3.1% for AGIs below $10k, 3.9% for AGIs $10k-25k, 6.5% for AGIs $25k-50k, 8.6% for AGIs $50k-75k, 11.1% for AGIs $75k-100k, 17.5% for AGIs over 100k)
Earned income credit: $1,709 (reported on 20.5% of returns)
Here:
$1,709
State:
$1,696
Percentage of individuals using paid preparers for their 2004 taxes: 64.7%
Here:
65%
State:
55%
(% for various income ranges: 57.5% for AGIs below $10k, 62.5% for AGIs $10k-25k, 68.6% for AGIs $25k-50k, 66.2% for AGIs $50k-75k, 71.9% for AGIs $75k-100k, 80.5% for AGIs over 100k)
Household received Food Stamps/SNAP in the past 12 months: 267 Household did not receive Food Stamps/SNAP in the past 12 months: 1,197
Women who had a birth in the past 12 months: 30 (27 now married, 3 unmarried) Women who did not have a birth in the past 12 months: 579 (335 now married, 243 unmarried)
Housing units in zip code 45771 with a mortgage: 403 (20 second mortgage, 8 both second mortgage and home equity loan) Houses without a mortgage: 8
Median monthly owner costs for units with a mortgage: $1,041 Median monthly owner costs for units without a mortgage: $409
Residents with income below the poverty level in 2022:
This zip code:
19.2%
Whole state:
13.4%
Residents with income below 50% of the poverty level in 2022:
This zip code:
13.4%
Whole state:
7.0%
Median number of rooms in houses and condos:
Here:
6.1
State:
6.7
Median number of rooms in apartments:
Here:
5.0
State:
4.4
Notable locations in this zip code not listed on our city pages
Notable locations in zip code 45771: Sanfords Landing (A), Alexanders Landing (B), Peytons Landing (C), McClintocks Landing (D), Sayres Landing (E), Mill Landing (F), Pickens Landing (G), Dyes Landing (H), Crows Landing (I), Widow Parr Landing (J), Peyton Landing (K), Never Dunn Farm and Greenhouses (L), Morning Star Farm (M), Rowe Farm (N), Racine Emergency Medical Services (O), Racine Volunteer Fire Department (P). Display/hide their locations on the map
Churches in zip code 45771 include: Fairview Church (A), Pine Grove Church (B), Morning Star United Methodist Church (C), Forest Run United Methodist Church (D), Eagle Ridge Methodist Church (E), Nease Settlement Church (F), Letart Falls United Brethren in Christ Church (G), Letart Falls United Methodist Church (H), East Letart United Methodist Church (I). Display/hide their locations on the map
Cemeteries: Carmel Cemetery (1), Oak Grove Cemetery (2), Bethlehem Cemetery (3), Syracuse Hill Cemetery (4), Gilmore Cemetery (5), Greenwood Cemetery (6), Letart Falls Cemetery (7). Display/hide their locations on the map
Streams, rivers, and creeks: Nease Creek (A), Mill Run (B), Mikes Run (C), Tanner Run (D), Yellowbush Creek (E), Wolf Run (F), Johns Run (G), Jennie Watts Run (H), Cooks Run (I). Display/hide their locations on the map
Size of family households: 418 2-persons, 261 3-persons, 175 4-persons, 50 5-persons, 2 6-persons
Size of nonfamily households: 522 1-person, 27 2-persons
423 married couples with children.
305 single-parent households (124 men, 181 women).
98.1% of residents of 45771 zip code speak English at home.
1.8% of residents speak Spanish at home (12% very well, 88% not at all).
0.2% of residents speak other Indo-European language at home (100% very well).
Foreign born population: 42 (1.2%) (4.8% of them are naturalized citizens)
This zip code:
1.2%
Whole state:
5.0%
100%Honduras
2%Croatia
34%German
17%English
15%American
9%Irish
4%European
4%Scotch-Irish
1%French
Year of entry for the foreign-born population
462010 or later
02000 to 2009
01990 to 1999
13Before 1990
Facilities with environmental interests located in this zip code:
ASHLAND BRANDED MARKETING (RACINE VILLAGE in RACINE, OH)
Housing units lacking complete plumbing facilities: 5.2% Housing units lacking complete kitchen facilities: 2.4%
50.4%Electricity
31.5%Utility gas
8.7%Bottled, tank, or LP gas
4.6%Other fuel
4.3%Wood
0.6%Fuel oil, kerosene, etc.
Population in 1990: 3,774.
Place of birth for U.S.-born residents:
This state: 1,977
Northeast: 162
Midwest: 73
South: 1,105
West: 21
71% of the 45771 zip code residents lived in the same house 5 years ago. Out of people who lived in different houses, 73% lived in this county. Out of people who lived in different counties, 50% lived in Ohio.
92% of the 45771 zip code residents lived in the same house 1 year ago. Out of people who lived in different houses, 28% moved from this county. Out of people who lived in different houses, 37% moved from different county within same state. Out of people who lived in different houses, 40% moved from different state.
Private vs. public school enrollment:
Students in private schools in grades 1 to 8 (elementary and middle school): 43
Here:
11.6%
Ohio:
16.0%
Students in private schools in grades 9 to 12 (high school):
Here:
0.0%
Ohio:
13.1%
Students in private undergraduate colleges: 19
Here:
27.4%
Ohio:
22.3%
Occupation by median earnings in the past 12 months ($)
64,136Life, physical, and social science occupations
55,076Sales and related occupations
54,461Community and social service occupations
53,834Health diagnosing and treating practitioners and other technical occupations
53,748Management occupations
48,464Installation, maintenance, and repair occupations
Top industries in this zip code by the number of employees in 2005:
Mining: Crude Petroleum and Natural Gas Extraction (20-49 employees: 1 establishment, 1-4 employees: 1 establishment)
Finance and Insurance: Commercial Banking (20-49: 1)
Mining: Construction Sand and Gravel Mining (10-19: 1)
Other Services (except Public Administration): Automotive Body, Paint, and Interior Repair and Maintenance (10-19: 1)
Accommodation and Food Services: Full-Service Restaurants (5-9: 1, 1-4: 1)
Health Care and Social Assistance: Offices of Dentists (5-9: 1)
Fatal accident statistics in 2013:
Fatal accident count: 2
Vehicles involved in fatal accidents: 4
Fatal accidents caused by drunken drivers: 1
Fatalities: 3
Persons involved in fatal accidents: 6
Pedestrians involved in fatal accidents: 0
Fatal accident statistics in 2011:
Fatal accident count: 1
Vehicles involved in fatal accidents: 1
Fatal accidents caused by drunken drivers: 0
Fatalities: 1
Persons involved in fatal accidents: 1
Pedestrians involved in fatal accidents: 0
2002 - 2018 National Fire Incident Reporting System (NFIRS) incidents
According to the data from the years 2002 - 2018 the average number of fire incidents per year is 21. The highest number of fire incidents - 41 took place in 2009, and the least - 14 in 2004. The data has a rising trend.
When looking into fire subcategories, the most incidents belonged to: Outside Fires (43.0%), and Structure Fires (40.7%).
Fire incident types reported to NFIRS in Zip Code 45771


 Nearest zip codes: 25265, 45779, 25253, 45770, 25262, 45743.


 According to the data from the years 2002 - 2018 the average number of fire incidents per year is 21. The highest number of fire incidents - 41 took place in 2009, and the least - 14 in 2004. The data has a rising trend.
 When looking into fire subcategories, the most incidents belonged to: Outside Fires (43.0%), and Structure Fires (40.7%).