Estimated zip code population in 2022: 570 Zip code population in 2010: 745 Zip code population in 2000: 839
Houses and condos: 245 Renter-occupied apartments: 7
% of renters here:
3%
State:
29%
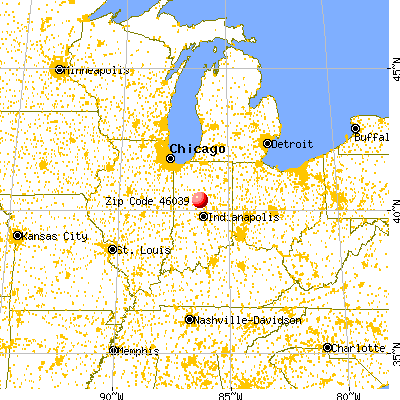
March 2022 cost of living index in zip code 46039: 82.4 (low, U.S. average is 100)
Land area: 27.1 sq. mi. Water area: 0.0 sq. mi.
Population density: 21 people per square mile
(very low).
OSM Map
General Map
Google Map
MSN Map
OSM Map
General Map
Google Map
MSN Map
OSM Map
General Map
Google Map
MSN Map
OSM Map
General Map
Google Map
MSN Map
Please wait while loading the map...
Real estate property taxes paid for housing units in 2022:
This zip code:
0.5% ($568)
Indiana:
0.7% ($1,467)
Median real estate property taxes paid for housing units with mortgages in 2022: $506 (0.4%) Median real estate property taxes paid for housing units with no mortgage in 2022: $1,114 (0.9%)
Business Search- 14 Million verified businesses
Males: 266
(46.7%)
Females: 304
(53.3%)
For population 25 years and over in 46039:
High school or higher: 77.7%
Bachelor's degree or higher: 12.3%
Graduate or professional degree: 1.7%
Mean travel time to work (commute): 28.6 minutes
For population 15 years and over in 46039:
Never married: 7.6%
Now married: 72.5%
Separated: 0.0%
Widowed: 6.3%
Divorced: 13.6%
Zip code 46039 compared to state average:
Median house value below state average.
Unemployed percentage significantly below state average.
Black race population percentage significantly below state average.
Hispanic race population percentage significantly below state average.
Foreign-born population percentage significantly below state average.
Renting percentage significantly below state average.
Length of stay since moving in significantly above state average.
House age above state average.
Number of college students significantly below state average.
Percentage of population with a bachelor's degree or higher significantly below state average.
Estimated median house/condo value in 2022: $124,811
46039:
$124,811
Indiana:
$208,700
Median resident age:
This zip code:
37.9 years
Indiana median age:
38.2 years
Average household size:
This zip code:
2.5 people
Indiana:
2.4 people
Averages for the 2020 tax year for zip code 46039, filed in 2021:
Average Adjusted Gross Income (AGI) in 2020: $55,491 (Individual Income Tax Returns)
Here:
$55,491
State:
$64,978
Salary/wage: $46,796 (reported on 78.8% of returns)
Here:
$46,796
State:
$55,245
(% of AGI for various income ranges: 760.0% for AGIs below $25k, 3593.3% for AGIs $25k-50k, 5745.0% for AGIs $50k-75k, 8003.3% for AGIs $75k-100k, 16186.7% for AGIs $100k-200k)
Taxable interest for individuals: $630 (reported on 30.3% of returns)
This zip code:
$630
Indiana:
$1,351
(% of AGI for various income ranges: 10.0% for AGIs below $25k, 18.3% for AGIs $25k-50k, 25.0% for AGIs $50k-75k, 120.0% for AGIs $100k-200k)
Ordinary dividends: $1,180 (reported on 15.2% of returns)
Here:
$1,180
State:
$5,827
(% of AGI for various income ranges: 41.7% for AGIs below $25k, 113.3% for AGIs $75k-100k)
Net capital gain/loss in AGI: +$1,600 (reported on 12.1% of returns)
Here:
+$1,600
State:
+$17,730
(% of AGI for various income ranges: 80.0% for AGIs below $25k, 40.0% for AGIs $50k-75k)
Profit/loss from business: +$4,350 (reported on 12.1% of returns)
Here:
+$4,350
State:
+$12,144
(% of AGI for various income ranges: 290.0% for AGIs $25k-50k)
Taxable individual retirement arrangement distribution: $11,333 (reported on 9.1% of returns)
46039:
$11,333
Indiana:
$18,302
(% of AGI for various income ranges: 566.7% for AGIs $25k-50k)
Earned income credit: $1,625 (reported on 12.1% of returns)
Here:
$1,625
State:
$2,298
(% of AGI for various income ranges: 108.3% for AGIs below $25k)
Percentage of individuals using paid preparers for their 2020 taxes: 93.9%
Here:
94%
State:
94%
(% for various income ranges: 90.0% for AGIs below $25k, 88.9% for AGIs $25k-50k, 100.0% for AGIs $50k-75k, 100.0% for AGIs $75k-100k, 100.0% for AGIs $100k-200k)
Averages for the 2012 tax year for zip code 46039, filed in 2013:
Average Adjusted Gross Income (AGI) in 2012: $49,857 (Individual Income Tax Returns)
Here:
$49,857
State:
$52,932
Salary/wage: $37,939 (reported on 80.0% of returns)
Here:
$37,939
State:
$45,173
(% of AGI for various income ranges: 66.7% for AGIs below $25k, 69.0% for AGIs $25k-50k, 66.1% for AGIs $50k-75k, 76.9% for AGIs $75k-100k, 46.8% for AGIs $100k-200k)
Taxable interest for individuals: $700 (reported on 31.4% of returns)
This zip code:
$700
Indiana:
$1,311
(% of AGI for various income ranges: 0.9% for AGIs below $25k, 0.6% for AGIs $50k-75k, 0.6% for AGIs $100k-200k)
Ordinary dividends: $1,317 (reported on 17.1% of returns)
Here:
$1,317
State:
$4,690
Profit/loss from business: +$3,425 (reported on 11.4% of returns)
Here:
+$3,425
State:
+$11,105
Taxable individual retirement arrangement distribution: $4,567 (reported on 8.6% of returns)
46039:
$4,567
Indiana:
$13,841
Total itemized deductions: $15,986 (18% of AGI, reported on 20.0% of returns)
Here:
$15,986
State:
$20,913
Here:
17.9% of AGI
State:
18.2% of AGI
Charity contributions: $3,700 (reported on 14.3% of returns)
Here:
$3,700
State:
$4,697
Taxes paid: $5,557 (reported on 20.0% of returns)
46039:
$5,557
State:
$7,456
Earned income credit: $2,220 (reported on 14.3% of returns)
Here:
$2,220
State:
$2,265
(% of AGI for various income ranges: 6.5% for AGIs below $25k)
Percentage of individuals using paid preparers for their 2012 taxes: 65.7%
Here:
66%
State:
53%
(% for various income ranges: 60.0% for AGIs below $25k, 75.0% for AGIs $25k-50k, 60.0% for AGIs $50k-75k, 66.7% for AGIs $75k-100k, 75.0% for AGIs $100k-200k)
Averages for the 2004 tax year for zip code 46039, filed in 2005:
Average Adjusted Gross Income (AGI) in 2004: $41,329 (Individual Income Tax Returns)
Here:
$41,329
State:
$44,790
Salary/wage: $39,350 (reported on 84.5% of returns)
Here:
$39,350
State:
$39,615
(% of AGI for various income ranges: 100.4% for AGIs below $10k, 59.1% for AGIs $10k-25k, 70.7% for AGIs $25k-50k, 84.9% for AGIs $50k-75k, 88.2% for AGIs $75k-100k, 84.3% for AGIs over 100k)
Taxable interest for individuals: $861 (reported on 47.8% of returns)
This zip code:
$861
Indiana:
$1,535
(% of AGI for various income ranges: 10.9% for AGIs below $10k, 2.9% for AGIs $10k-25k, 1.0% for AGIs $25k-50k, 0.8% for AGIs $50k-75k, 0.3% for AGIs $75k-100k, 0.4% for AGIs over 100k)
Taxable dividends: $577 (reported on 21.5% of returns)
Here:
$577
State:
$2,998
(% of AGI for various income ranges: 0.5% for AGIs $10k-25k, 0.5% for AGIs $25k-50k, 0.5% for AGIs $50k-75k, 0.1% for AGIs $75k-100k)
Net capital gain/loss: +$407 (reported on 14.9% of returns)
Here:
+$407
State:
+$8,619
(% of AGI for various income ranges: -1.9% for AGIs below $10k, -0.0% for AGIs $25k-50k, -0.1% for AGIs $50k-75k, 0.9% for AGIs $75k-100k)
Profit/loss from business: +$1,550 (reported on 5.5% of returns)
Here:
+$1,550
State:
+$10,071
Total itemized deductions: $14,667 (19% of AGI, reported on 24.9% of returns)
Here:
$14,667
State:
$17,065
Here:
19.1% of AGI
State:
19.5% of AGI
(% of AGI for various income ranges: 7.4% for AGIs $25k-50k, 10.6% for AGIs $50k-75k, 10.7% for AGIs $75k-100k, 10.6% for AGIs over 100k)
Charity contributions deductions: $2,029 (2% of AGI, reported on 19.1% of returns)
Here:
$2,029
State:
$3,550
Here:
2.5% of AGI
State:
3.8% of AGI
(% of AGI for various income ranges: 0.9% for AGIs $25k-50k, 1.0% for AGIs $50k-75k, 0.5% for AGIs $75k-100k, 1.9% for AGIs over 100k)
Total tax: $5,093 (reported on 77.1% of returns)
46039:
$5,093
State:
$6,914
(% of AGI for various income ranges: 1.5% for AGIs below $10k, 3.9% for AGIs $10k-25k, 7.1% for AGIs $25k-50k, 8.2% for AGIs $50k-75k, 10.6% for AGIs $75k-100k, 15.5% for AGIs over 100k)
Earned income credit: $1,528 (reported on 9.9% of returns)
Here:
$1,528
State:
$1,685
Percentage of individuals using paid preparers for their 2004 taxes: 66.6%
Here:
67%
State:
59%
(% for various income ranges: 62.0% for AGIs below $10k, 61.5% for AGIs $10k-25k, 72.7% for AGIs $25k-50k, 62.3% for AGIs $50k-75k, 85.0% for AGIs $75k-100k, 54.2% for AGIs over 100k)
Household received Food Stamps/SNAP in the past 12 months: 0 Household did not receive Food Stamps/SNAP in the past 12 months: 227
Women who did not have a birth in the past 12 months: 143 (89 now married, 53 unmarried)
Housing units in zip code 46039 with a mortgage: 123 (5 second mortgage) Median monthly owner costs for units with a mortgage: $936 Median monthly owner costs for units without a mortgage: $417
Residents with income below the poverty level in 2022:
This zip code:
14.1%
Whole state:
12.6%
Residents with income below 50% of the poverty level in 2022:
This zip code:
3.1%
Whole state:
6.3%
Median number of rooms in houses and condos:
Here:
6.7
State:
6.6
Notable locations in this zip code not listed on our city pages
Size of family households: 69 2-persons, 14 3-persons, 23 4-persons, 28 5-persons
Size of nonfamily households: 91 1-person
203 married couples with children.
0 single-parent households ().
98.9% of residents of 46039 zip code speak English at home.
Foreign born population: 0 (0.0%)
:
0.0%
Whole state:
6.1%
49%American
16%German
11%English
Facilities with environmental interests located in this zip code:
INTERNATIONAL MINERALS AND CHEMICAL CORP (930 E 680 N in FOREST, IN)
STATE MASTER (Indiana facility tracking) (Resource Conservation and Recovery Act (tracking hazardous waste)) Organizations: INTERNATIONAL MINERALS & CHEMICAL CORP (CONTACT/OWNER)
IMPACT COOPERATIVE INC (6472 N FOREST AVE in FOREST, IN)
STATE MASTER (Indiana facility tracking) COMPLIANCE ACTIVITY (Tracking inspections of insecticide, fungicide, and rodenticide, and toxic substances) Alternative names: IMACT COOPERATIVE INC (FOREST AGRO)
47.3%Bottled, tank, or LP gas
38.2%Utility gas
15.5%Electricity
Population in 1990: 879.
Place of birth for U.S.-born residents:
This state: 539
South: 24
65% of the 46039 zip code residents lived in the same house 5 years ago. Out of people who lived in different houses, 65% lived in this county.
101% of the 46039 zip code residents lived in the same house 1 year ago.
Private vs. public school enrollment:
Students in private schools in grades 1 to 8 (elementary and middle school): 5
Here:
3.9%
Indiana:
14.9%
Students in private schools in grades 9 to 12 (high school):
Here:
0.0%
Indiana:
11.4%
Occupation by median earnings in the past 12 months ($)
55,414Production occupations
39,686Office and administrative support occupations
Top industries in this zip code by the number of employees in 2005:
Construction: Painting and Wall Covering Contractors (10-19 employees: 1 establishment)
Other Services (except Public Administration): General Automotive Repair (1-4: 1)
Wholesale Trade: Wholesale Trade Agents and Brokers (1-4: 1)
Home Mortgage Disclosure Act Aggregated Statistics For Year 2003 (Based on 2 partial tracts)
A) FHA, FSA/RHS & VA Home Purchase Loans
B) Conventional Home Purchase Loans
C) Refinancings
D) Home Improvement Loans
F) Non-occupant Loans on < 5 Family Dwellings (A B C & D)
Number
Average Value
Number
Average Value
Number
Average Value
Number
Average Value
Number
Average Value
LOANS ORIGINATED
3
$72,227
18
$116,064
64
$86,062
11
$23,730
3
$56,827
APPLICATIONS APPROVED, NOT ACCEPTED
0
$0
4
$72,302
12
$89,204
0
$0
1
$70,690
APPLICATIONS DENIED
0
$0
6
$62,447
29
$92,193
5
$9,980
0
$0
APPLICATIONS WITHDRAWN
0
$0
3
$67,607
14
$92,466
4
$31,878
0
$0
FILES CLOSED FOR INCOMPLETENESS
0
$0
0
$0
4
$95,518
0
$0
0
$0
Aggregated Statistics For Year 2002 (Based on 2 partial tracts)
A) FHA, FSA/RHS & VA Home Purchase Loans
B) Conventional Home Purchase Loans
C) Refinancings
D) Home Improvement Loans
F) Non-occupant Loans on < 5 Family Dwellings (A B C & D)
Number
Average Value
Number
Average Value
Number
Average Value
Number
Average Value
Number
Average Value
LOANS ORIGINATED
4
$77,385
18
$71,199
57
$83,274
4
$21,945
2
$69,995
APPLICATIONS APPROVED, NOT ACCEPTED
1
$62,370
1
$89,170
14
$72,435
0
$0
1
$85,470
APPLICATIONS DENIED
2
$67,450
8
$61,850
20
$83,460
3
$22,637
0
$0
APPLICATIONS WITHDRAWN
0
$0
1
$83,620
14
$76,824
1
$12,010
0
$0
FILES CLOSED FOR INCOMPLETENESS
0
$0
1
$51,740
7
$87,649
0
$0
0
$0
Aggregated Statistics For Year 2001 (Based on 2 partial tracts)
A) FHA, FSA/RHS & VA Home Purchase Loans
B) Conventional Home Purchase Loans
C) Refinancings
D) Home Improvement Loans
F) Non-occupant Loans on < 5 Family Dwellings (A B C & D)
Number
Average Value
Number
Average Value
Number
Average Value
Number
Average Value
Number
Average Value
LOANS ORIGINATED
3
$90,860
17
$61,908
51
$83,540
8
$13,282
6
$42,967
APPLICATIONS APPROVED, NOT ACCEPTED
1
$79,000
3
$49,280
3
$90,707
0
$0
1
$62,830
APPLICATIONS DENIED
0
$0
7
$54,649
24
$65,854
7
$16,434
2
$86,625
APPLICATIONS WITHDRAWN
0
$0
3
$77,153
9
$67,760
2
$18,020
1
$93,320
FILES CLOSED FOR INCOMPLETENESS
0
$0
0
$0
2
$55,210
1
$41,580
0
$0
Aggregated Statistics For Year 2000 (Based on 2 partial tracts)
A) FHA, FSA/RHS & VA Home Purchase Loans
B) Conventional Home Purchase Loans
C) Refinancings
D) Home Improvement Loans
F) Non-occupant Loans on < 5 Family Dwellings (A B C & D)
Number
Average Value
Number
Average Value
Number
Average Value
Number
Average Value
Number
Average Value
LOANS ORIGINATED
5
$88,888
17
$72,561
23
$51,965
13
$25,125
3
$22,330
APPLICATIONS APPROVED, NOT ACCEPTED
0
$0
1
$29,110
7
$54,251
2
$30,260
0
$0
APPLICATIONS DENIED
0
$0
5
$72,534
14
$67,221
7
$26,400
0
$0
APPLICATIONS WITHDRAWN
0
$0
0
$0
6
$52,437
0
$0
0
$0
FILES CLOSED FOR INCOMPLETENESS
0
$0
1
$38,810
2
$74,615
0
$0
0
$0
Aggregated Statistics For Year 1999 (Based on 1 partial tract)
B) Conventional Home Purchase Loans
C) Refinancings
D) Home Improvement Loans
F) Non-occupant Loans on < 5 Family Dwellings (A B C & D)


 Nearest zip codes: 46979, 46057, 46049, 46915, 46050, 46045.


