Estimated zip code population in 2022: 2,371 Zip code population in 2010: 1,890 Zip code population in 2000: 1,775
Houses and condos: 829 Renter-occupied apartments: 87
% of renters here:
11%
State:
29%
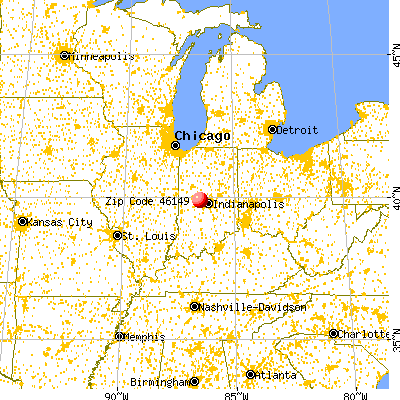
March 2022 cost of living index in zip code 46149: 86.7 (less than average, U.S. average is 100)
Land area: 26.2 sq. mi. Water area: 0.0 sq. mi.
Population density: 90 people per square mile
(very low).
OSM Map
General Map
Google Map
MSN Map
OSM Map
General Map
Google Map
MSN Map
OSM Map
General Map
Google Map
MSN Map
OSM Map
General Map
Google Map
MSN Map
Please wait while loading the map...
Real estate property taxes paid for housing units in 2022:
This zip code:
0.8% ($2,192)
Indiana:
0.7% ($1,467)
Median real estate property taxes paid for housing units with mortgages in 2022: $2,104 (0.8%) Median real estate property taxes paid for housing units with no mortgage in 2022: $2,574 (1.0%)
Business Search- 14 Million verified businesses
Males: 1,171
(49.4%)
Females: 1,199
(50.6%)
For population 25 years and over in 46149:
High school or higher: 96.6%
Bachelor's degree or higher: 33.5%
Graduate or professional degree: 5.2%
Unemployed: 2.0%
Mean travel time to work (commute): 31.8 minutes
For population 15 years and over in 46149:
Never married: 17.4%
Now married: 70.8%
Separated: 0.5%
Widowed: 3.0%
Divorced: 8.3%
Zip code 46149 compared to state average:
Unemployed percentage below state average.
Black race population percentage significantly below state average.
Hispanic race population percentage significantly below state average.
Median age below state average.
Foreign-born population percentage significantly below state average.
Renting percentage significantly below state average.
Length of stay since moving in significantly above state average.
Estimated median house/condo value in 2022: $272,015
46149:
$272,015
Indiana:
$208,700
Median resident age:
This zip code:
33.5 years
Indiana median age:
38.2 years
Average household size:
This zip code:
2.9 people
Indiana:
2.4 people
Averages for the 2020 tax year for zip code 46149, filed in 2021:
Average Adjusted Gross Income (AGI) in 2020: $74,975 (Individual Income Tax Returns)
Here:
$74,975
State:
$64,978
Salary/wage: $67,063 (reported on 81.4% of returns)
Here:
$67,063
State:
$55,245
(% of AGI for various income ranges: 1022.6% for AGIs below $25k, 3733.1% for AGIs $25k-50k, 6029.2% for AGIs $50k-75k, 9655.0% for AGIs $75k-100k, 17682.5% for AGIs $100k-200k)
Taxable interest for individuals: $1,581 (reported on 30.4% of returns)
This zip code:
$1,581
Indiana:
$1,351
(% of AGI for various income ranges: 13.2% for AGIs below $25k, 26.2% for AGIs $25k-50k, 17.5% for AGIs $50k-75k, 23.8% for AGIs $75k-100k, 72.5% for AGIs $100k-200k)
Ordinary dividends: $3,286 (reported on 20.6% of returns)
Here:
$3,286
State:
$5,827
(% of AGI for various income ranges: 17.4% for AGIs below $25k, 27.5% for AGIs $25k-50k, 170.8% for AGIs $50k-75k, 86.2% for AGIs $75k-100k, 163.3% for AGIs $100k-200k)
Net capital gain/loss in AGI: +$9,122 (reported on 17.6% of returns)
Here:
+$9,122
State:
+$17,730
(% of AGI for various income ranges: 7.4% for AGIs below $25k, 71.2% for AGIs $25k-50k, 49.2% for AGIs $50k-75k, 105.0% for AGIs $75k-100k, 216.7% for AGIs $100k-200k)
Profit/loss from business: +$12,421 (reported on 13.7% of returns)
Here:
+$12,421
State:
+$12,144
(% of AGI for various income ranges: 159.5% for AGIs below $25k, 290.0% for AGIs $25k-50k, 377.5% for AGIs $75k-100k, 558.3% for AGIs $100k-200k)
Taxable individual retirement arrangement distribution: $20,955 (reported on 10.8% of returns)
46149:
$20,955
Indiana:
$18,302
(% of AGI for various income ranges: 163.2% for AGIs below $25k, 250.8% for AGIs $50k-75k, 445.0% for AGIs $75k-100k, 1115.0% for AGIs $100k-200k)
Total itemized deductions: $31,417 (reported on 5.9% of returns)
Here:
$31,417
State:
$35,601
(% of AGI for various income ranges: 426.7% for AGIs $50k-75k, 1144.2% for AGIs $100k-200k)
Charity contributions: $8,517 (reported on 5.9% of returns)
Here:
$8,517
State:
$15,596
(% of AGI for various income ranges: 425.8% for AGIs $100k-200k)
Taxes paid: $8,633 (reported on 5.9% of returns)
46149:
$8,633
State:
$7,542
(% of AGI for various income ranges: 108.3% for AGIs $50k-75k, 323.3% for AGIs $100k-200k)
Earned income credit: $1,938 (reported on 7.8% of returns)
Here:
$1,938
State:
$2,298
(% of AGI for various income ranges: 53.7% for AGIs below $25k, 33.1% for AGIs $25k-50k)
Percentage of individuals using paid preparers for their 2020 taxes: 91.2%
Here:
91%
State:
94%
(% for various income ranges: 85.7% for AGIs below $25k, 90.5% for AGIs $25k-50k, 94.1% for AGIs $50k-75k, 100.0% for AGIs $75k-100k, 94.4% for AGIs $100k-200k, 83.3% for AGIs over 200k)
Averages for the 2012 tax year for zip code 46149, filed in 2013:
Average Adjusted Gross Income (AGI) in 2012: $57,679 (Individual Income Tax Returns)
Here:
$57,679
State:
$52,932
Salary/wage: $51,204 (reported on 85.7% of returns)
Here:
$51,204
State:
$45,173
(% of AGI for various income ranges: 69.2% for AGIs below $25k, 79.3% for AGIs $25k-50k, 73.4% for AGIs $50k-75k, 76.3% for AGIs $75k-100k, 86.8% for AGIs $100k-200k, 55.5% for AGIs over 200k)
Taxable interest for individuals: $931 (reported on 35.2% of returns)
This zip code:
$931
Indiana:
$1,311
(% of AGI for various income ranges: 1.9% for AGIs below $25k, 0.4% for AGIs $25k-50k, 0.6% for AGIs $50k-75k, 0.6% for AGIs $75k-100k, 0.1% for AGIs $100k-200k, 1.0% for AGIs over 200k)
Ordinary dividends: $1,915 (reported on 22.0% of returns)
Here:
$1,915
State:
$4,690
(% of AGI for various income ranges: 1.6% for AGIs below $25k, 0.3% for AGIs $25k-50k, 1.5% for AGIs $50k-75k, 0.6% for AGIs $75k-100k, 0.7% for AGIs $100k-200k)
Net capital gain/loss in AGI: +$1,364 (reported on 12.1% of returns)
Here:
+$1,364
State:
+$10,406
(% of AGI for various income ranges: 1.2% for AGIs $100k-200k)
Profit/loss from business: +$7,820 (reported on 16.5% of returns)
Here:
+$7,820
State:
+$11,105
(% of AGI for various income ranges: 4.5% for AGIs below $25k, 3.3% for AGIs $25k-50k, 2.7% for AGIs $50k-75k, 3.4% for AGIs $100k-200k)
Taxable individual retirement arrangement distribution: $12,756 (reported on 9.9% of returns)
46149:
$12,756
Indiana:
$13,841
(% of AGI for various income ranges: 9.2% for AGIs below $25k, 4.7% for AGIs $50k-75k, 4.4% for AGIs $75k-100k)
Total itemized deductions: $18,832 (19% of AGI, reported on 37.4% of returns)
Here:
$18,832
State:
$20,913
Here:
19.4% of AGI
State:
18.2% of AGI
(% of AGI for various income ranges: 9.1% for AGIs below $25k, 10.4% for AGIs $25k-50k, 12.9% for AGIs $50k-75k, 14.2% for AGIs $75k-100k, 12.7% for AGIs $100k-200k, 10.6% for AGIs over 200k)
Charity contributions: $3,875 (reported on 30.8% of returns)
Here:
$3,875
State:
$4,697
(% of AGI for various income ranges: 1.8% for AGIs $25k-50k, 2.3% for AGIs $50k-75k, 1.8% for AGIs $75k-100k, 2.2% for AGIs $100k-200k, 2.9% for AGIs over 200k)
Taxes paid: $6,774 (reported on 37.4% of returns)
46149:
$6,774
State:
$7,456
(% of AGI for various income ranges: 1.5% for AGIs below $25k, 2.6% for AGIs $25k-50k, 3.9% for AGIs $50k-75k, 4.9% for AGIs $75k-100k, 5.4% for AGIs $100k-200k, 5.1% for AGIs over 200k)
Earned income credit: $1,600 (reported on 13.2% of returns)
Here:
$1,600
State:
$2,265
(% of AGI for various income ranges: 3.6% for AGIs below $25k, 1.0% for AGIs $25k-50k)
Percentage of individuals using paid preparers for their 2012 taxes: 48.4%
Here:
48%
State:
53%
(% for various income ranges: 40.6% for AGIs below $25k, 50.0% for AGIs $25k-50k, 57.1% for AGIs $50k-75k, 45.5% for AGIs $75k-100k, 53.8% for AGIs $100k-200k, 66.7% for AGIs over 200k)
Averages for the 2004 tax year for zip code 46149, filed in 2005:
Average Adjusted Gross Income (AGI) in 2004: $51,390 (Individual Income Tax Returns)
Here:
$51,390
State:
$44,790
Salary/wage: $47,267 (reported on 86.5% of returns)
Here:
$47,267
State:
$39,615
(% of AGI for various income ranges: 88.4% for AGIs below $10k, 73.4% for AGIs $10k-25k, 77.4% for AGIs $25k-50k, 87.1% for AGIs $50k-75k, 87.3% for AGIs $75k-100k, 71.5% for AGIs over 100k)
Taxable interest for individuals: $1,300 (reported on 52.2% of returns)
This zip code:
$1,300
Indiana:
$1,535
(% of AGI for various income ranges: 10.3% for AGIs below $10k, 3.1% for AGIs $10k-25k, 1.9% for AGIs $25k-50k, 0.7% for AGIs $50k-75k, 0.5% for AGIs $75k-100k, 1.3% for AGIs over 100k)
Taxable dividends: $2,143 (reported on 25.7% of returns)
Here:
$2,143
State:
$2,998
(% of AGI for various income ranges: 4.1% for AGIs below $10k, 1.7% for AGIs $10k-25k, 1.3% for AGIs $25k-50k, 0.6% for AGIs $50k-75k, 0.3% for AGIs $75k-100k, 1.5% for AGIs over 100k)
Net capital gain/loss: +$1,701 (reported on 17.4% of returns)
Here:
+$1,701
State:
+$8,619
(% of AGI for various income ranges: -2.8% for AGIs below $10k, 0.6% for AGIs $10k-25k, 0.1% for AGIs $25k-50k, 0.3% for AGIs $50k-75k, -0.1% for AGIs $75k-100k, 1.6% for AGIs over 100k)
Profit/loss from business: +$5,960 (reported on 17.7% of returns)
Here:
+$5,960
State:
+$10,071
(% of AGI for various income ranges: 14.0% for AGIs below $10k, 0.9% for AGIs $10k-25k, 4.7% for AGIs $25k-50k, 1.9% for AGIs $50k-75k, 2.1% for AGIs $75k-100k, 0.7% for AGIs over 100k)
Total itemized deductions: $15,943 (20% of AGI, reported on 43.9% of returns)
Here:
$15,943
State:
$17,065
Here:
19.9% of AGI
State:
19.5% of AGI
(% of AGI for various income ranges: 14.8% for AGIs $10k-25k, 14.7% for AGIs $25k-50k, 14.4% for AGIs $50k-75k, 15.2% for AGIs $75k-100k, 11.9% for AGIs over 100k)
Charity contributions deductions: $2,924 (3% of AGI, reported on 37.6% of returns)
Here:
$2,924
State:
$3,550
Here:
3.4% of AGI
State:
3.8% of AGI
(% of AGI for various income ranges: 1.6% for AGIs $10k-25k, 1.6% for AGIs $25k-50k, 1.8% for AGIs $50k-75k, 2.6% for AGIs $75k-100k, 2.6% for AGIs over 100k)
Total tax: $6,868 (reported on 81.9% of returns)
46149:
$6,868
State:
$6,914
(% of AGI for various income ranges: 3.7% for AGIs below $10k, 4.6% for AGIs $10k-25k, 6.9% for AGIs $25k-50k, 8.4% for AGIs $50k-75k, 10.0% for AGIs $75k-100k, 16.8% for AGIs over 100k)
Earned income credit: $1,600 (reported on 8.3% of returns)
Here:
$1,600
State:
$1,685
Percentage of individuals using paid preparers for their 2004 taxes: 57.1%
Here:
57%
State:
59%
(% for various income ranges: 45.5% for AGIs below $10k, 56.3% for AGIs $10k-25k, 62.8% for AGIs $25k-50k, 63.6% for AGIs $50k-75k, 49.5% for AGIs $75k-100k, 61.1% for AGIs over 100k)
Household received Food Stamps/SNAP in the past 12 months: 13 Household did not receive Food Stamps/SNAP in the past 12 months: 790
Women who had a birth in the past 12 months: 140 (149 now married, 2 unmarried) Women who did not have a birth in the past 12 months: 469 (311 now married, 159 unmarried)
Housing units in zip code 46149 with a mortgage: 511 (33 second mortgage, 34 both second mortgage and home equity loan) Houses without a mortgage: 3
Median monthly owner costs for units with a mortgage: $1,476 Median monthly owner costs for units without a mortgage: $617
Residents with income below the poverty level in 2022:
This zip code:
3.0%
Whole state:
12.6%
Residents with income below 50% of the poverty level in 2022:
This zip code:
3.0%
Whole state:
6.3%
Median number of rooms in houses and condos:
Here:
6.8
State:
6.6
Median number of rooms in apartments:
Here:
4.8
State:
4.3
Notable locations in this zip code not listed on our city pages
Size of family households: 178 2-persons, 121 3-persons, 227 4-persons, 82 5-persons, 29 6-persons
Size of nonfamily households: 149 1-person, 11 2-persons
634 married couples with children.
24 single-parent households (9 men, 15 women).
98.4% of residents of 46149 zip code speak English at home.
0.5% of residents speak other Indo-European language at home (100% very well).
Foreign born population: 11 (0.5%) (100.0% of them are naturalized citizens)
This zip code:
0.5%
Whole state:
6.1%
41%American
16%German
15%English
3%Irish
3%Italian
2%European
2%Eastern European
Year of entry for the foreign-born population
02010 or later
82000 to 2009
01990 to 1999
9Before 1990
Facilities with environmental interests located in this zip code:
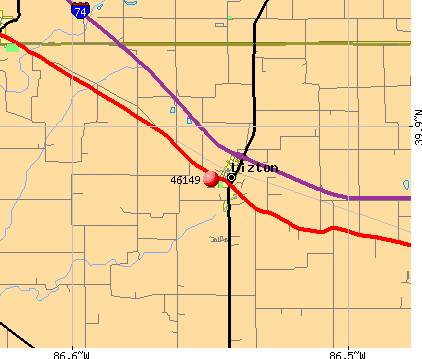
LIZTON MUNICIPAL STP (SR 39 & CR 800 N in LIZTON, IN)
STATE MASTER (Indiana facility tracking) - CRTK-1409, EPCRA National Pollutant Discharge Elimination System NON-MAJOR (Tracking pollutant discharge elimination systems) - permit Business SIC classification: SEWERAGE SYSTEMS Organizations: THOMAS W. MITCHELL #13048 (CONTACT/OPERATOR)
, LIZTON TOWN COUNCIL (CONTACT/OWNER)
Alternative names: TOWN OF LIZTON STP
LIZTON REST AREAS I 74 (I 74 EB, 3 MI E OF SR 75 in LIZTON, IN)
STATE MASTER (Indiana facility tracking) - IN-NPDES-IN0031518, National Pollutant Discharge Elimination System Permit National Pollutant Discharge Elimination System NON-MAJOR (Tracking pollutant discharge elimination systems) - permit Business SIC classification: REGULATION AND ADMINISTRATION OF TRANSPORTATION PROGRAMS Organizations: CRAIG LAGRANGE OIT (CONTACT/OPERATOR)
, LIZTON TOWN COUNCIL (CONTACT/OWNER)
Alternative names: LIZTON REST AREAS I-74T
AMOCO FERTILIZER PLT (W OF LIZTON NEAR RR TRACK in LIZTON, IN)
STATE MASTER (Indiana facility tracking) (Resource Conservation and Recovery Act (tracking hazardous waste))
PANHANDLE E PIPELINE CO DANVILLE M&R STN (6336 N CR 200 W in LIZTON, IN)
Conditionally Exempt Small Quantity Generators, less than 100 kg/month of hazardous waste (Resource Conservation and Recovery Act (tracking hazardous waste)) Organizations: PANHANDLE EASTERN PIPELINE CO. (CONTACT/OPERATOR)
, PANHANDLE EASTER PIPELINE CO (CONTACT/OWNER)
NORTHWEST HENDRICKS SCHOOL (7959 N SR 39 in LIZTON, IN)
STATE MASTER (Indiana facility tracking) COMPLIANCE ACTIVITY (Tracking inspections of insecticide, fungicide, and rodenticide, and toxic substances)
Housing units lacking complete plumbing facilities: 0.5% Housing units lacking complete kitchen facilities: 0.5%
41.0%Electricity
36.4%Bottled, tank, or LP gas
18.1%Utility gas
3.3%Other fuel
1.7%Fuel oil, kerosene, etc.
Population in 1990: 1,586. Population change in the 1990s: +189 (+11.9%).
Place of birth for U.S.-born residents:
This state: 1,988
Northeast: 8
Midwest: 126
South: 123
West: 91
65% of the 46149 zip code residents lived in the same house 5 years ago. Out of people who lived in different houses, 57% lived in this county. Out of people who lived in different counties, 50% lived in Indiana.
98% of the 46149 zip code residents lived in the same house 1 year ago. Out of people who lived in different houses, 120% moved from this county.
Private vs. public school enrollment:
Students in private schools in grades 1 to 8 (elementary and middle school): 35
Here:
16.6%
Indiana:
14.9%
Students in private schools in grades 9 to 12 (high school): 15
Here:
8.2%
Indiana:
11.4%
Students in private undergraduate colleges: 30
Here:
42.1%
Indiana:
22.3%
Occupation by median earnings in the past 12 months ($)
112,848Management occupations
78,944Health diagnosing and treating practitioners and other technical occupations
62,461Education, training, and library occupations
59,897Health technologists and technicians
53,588Material moving occupations
52,956Business and financial operations occupations
Companies with federal contracts located in this zip code:
SELF SERVICE MINI STORAGE (LINDNERSTR. 47 in OBERHAUSEN, ; small business) 10 employees, $944304 revenue. : $71,480 in 4 contractsfrom 2002 to 2003
$17,870 with Public Buildings Service for Lease or Rental of Facilities -- Office Buildings. Taking place in TN. Signed on 2003-09-15. Completion date: 2003-09-15.
$17,870, same as above.Signed on 2003-03-15. Completion date: 2003-03-15.
$17,870, same as above.Signed on 2002-12-15. Completion date: 2002-12-15.
$17,870, same as above.Signed on 2003-09-15. Completion date: 2003-09-15.
Top industries in this zip code by the number of employees in 2005:
Accommodation and Food Services: Food Service Contractors (20-49 employees: 1 establishment)
Finance and Insurance: Commercial Banking (20-49: 1)
Construction: Commercial and Institutional Building Construction (10-19: 1)
Construction: New Single-Family Housing Construction (except Operative Builders) (5-9: 1, 1-4: 2)
Construction: Plumbing, Heating, and Air-Conditioning Contractors (5-9: 1, 1-4: 1)
Other Services (except Public Administration): General Automotive Repair (5-9: 1)
Construction: Site Preparation Contractors (5-9: 1)
Fatal accident statistics in 2013:
Fatal accident count: 1
Vehicles involved in fatal accidents: 2
Fatal accidents caused by drunken drivers: 1
Fatalities: 2
Persons involved in fatal accidents: 3
Pedestrians involved in fatal accidents: 0
Fatal accident statistics in 2011:
Fatal accident count: 1
Vehicles involved in fatal accidents: 1
Fatal accidents caused by drunken drivers: 0
Fatalities: 2
Persons involved in fatal accidents: 3
Pedestrians involved in fatal accidents: 0
Home Mortgage Disclosure Act Aggregated Statistics For Year 2009 (Based on 2 partial tracts)
A) FHA, FSA/RHS & VA Home Purchase Loans
B) Conventional Home Purchase Loans
C) Refinancings
D) Home Improvement Loans
F) Non-occupant Loans on < 5 Family Dwellings (A B C & D)
G) Loans On Manufactured Home Dwelling (A B C & D)
Number
Average Value
Number
Average Value
Number
Average Value
Number
Average Value
Number
Average Value
Number
Average Value
LOANS ORIGINATED
7
$137,993
7
$165,021
66
$156,709
8
$73,798
4
$76,345
0
$0
APPLICATIONS APPROVED, NOT ACCEPTED
1
$108,120
1
$203,910
2
$150,560
0
$0
0
$0
0
$0
APPLICATIONS DENIED
3
$130,090
3
$105,273
21
$145,580
0
$0
2
$138,705
1
$107,640
APPLICATIONS WITHDRAWN
1
$110,960
1
$193,000
13
$165,751
0
$0
0
$0
0
$0
FILES CLOSED FOR INCOMPLETENESS
0
$0
0
$0
7
$163,396
0
$0
0
$0
0
$0
Aggregated Statistics For Year 2008 (Based on 2 partial tracts)
A) FHA, FSA/RHS & VA Home Purchase Loans
B) Conventional Home Purchase Loans
C) Refinancings
D) Home Improvement Loans
F) Non-occupant Loans on < 5 Family Dwellings (A B C & D)
G) Loans On Manufactured Home Dwelling (A B C & D)
Number
Average Value
Number
Average Value
Number
Average Value
Number
Average Value
Number
Average Value
Number
Average Value
LOANS ORIGINATED
8
$117,720
12
$160,398
31
$159,285
9
$34,142
6
$86,542
2
$104,800
APPLICATIONS APPROVED, NOT ACCEPTED
1
$179,250
1
$251,330
7
$129,863
1
$58,330
1
$121,400
0
$0
APPLICATIONS DENIED
0
$0
2
$233,545
18
$158,857
3
$76,503
0
$0
1
$13,750
APPLICATIONS WITHDRAWN
2
$87,965
1
$234,730
10
$156,201
1
$63,070
0
$0
1
$94,840
FILES CLOSED FOR INCOMPLETENESS
0
$0
1
$101,000
2
$163,360
1
$76,350
0
$0
0
$0
Aggregated Statistics For Year 2007 (Based on 2 partial tracts)
A) FHA, FSA/RHS & VA Home Purchase Loans
B) Conventional Home Purchase Loans
C) Refinancings
D) Home Improvement Loans
F) Non-occupant Loans on < 5 Family Dwellings (A B C & D)
G) Loans On Manufactured Home Dwelling (A B C & D)
Number
Average Value
Number
Average Value
Number
Average Value
Number
Average Value
Number
Average Value
Number
Average Value
LOANS ORIGINATED
4
$137,992
27
$143,823
36
$151,125
9
$35,670
7
$96,466
1
$62,120
APPLICATIONS APPROVED, NOT ACCEPTED
0
$0
5
$89,528
9
$140,152
1
$22,290
1
$96,260
0
$0
APPLICATIONS DENIED
1
$109,070
8
$88,439
34
$144,924
8
$24,718
3
$64,333
0
$0
APPLICATIONS WITHDRAWN
0
$0
5
$123,672
10
$161,513
1
$9,960
1
$77,770
0
$0
FILES CLOSED FOR INCOMPLETENESS
0
$0
1
$211,020
3
$138,783
0
$0
0
$0
0
$0
Aggregated Statistics For Year 2006 (Based on 2 partial tracts)
A) FHA, FSA/RHS & VA Home Purchase Loans
B) Conventional Home Purchase Loans
C) Refinancings
D) Home Improvement Loans
F) Non-occupant Loans on < 5 Family Dwellings (A B C & D)
G) Loans On Manufactured Home Dwelling (A B C & D)
Number
Average Value
Number
Average Value
Number
Average Value
Number
Average Value
Number
Average Value
Number
Average Value
LOANS ORIGINATED
4
$119,735
34
$154,966
37
$128,483
10
$39,122
7
$85,763
3
$100,530
APPLICATIONS APPROVED, NOT ACCEPTED
0
$0
6
$101,400
7
$158,857
0
$0
0
$0
0
$0
APPLICATIONS DENIED
0
$0
7
$95,517
25
$118,474
5
$71,320
2
$132,065
2
$112,150
APPLICATIONS WITHDRAWN
0
$0
2
$182,805
20
$142,900
1
$175,930
2
$89,150
0
$0
FILES CLOSED FOR INCOMPLETENESS
0
$0
0
$0
7
$169,424
0
$0
0
$0
0
$0
Aggregated Statistics For Year 2005 (Based on 2 partial tracts)
A) FHA, FSA/RHS & VA Home Purchase Loans
B) Conventional Home Purchase Loans
C) Refinancings
D) Home Improvement Loans
F) Non-occupant Loans on < 5 Family Dwellings (A B C & D)
G) Loans On Manufactured Home Dwelling (A B C & D)
Number
Average Value
Number
Average Value
Number
Average Value
Number
Average Value
Number
Average Value
Number
Average Value
LOANS ORIGINATED
3
$108,277
31
$120,692
47
$130,748
8
$64,372
3
$99,583
1
$79,190
APPLICATIONS APPROVED, NOT ACCEPTED
0
$0
3
$126,770
9
$115,547
4
$37,700
0
$0
0
$0
APPLICATIONS DENIED
1
$148,900
8
$122,225
34
$117,253
5
$74,734
1
$85,360
3
$91,837
APPLICATIONS WITHDRAWN
0
$0
3
$146,687
16
$156,812
2
$134,675
0
$0
0
$0
FILES CLOSED FOR INCOMPLETENESS
0
$0
2
$98,635
9
$172,029
1
$60,220
0
$0
0
$0
Aggregated Statistics For Year 2004 (Based on 2 partial tracts)
A) FHA, FSA/RHS & VA Home Purchase Loans
B) Conventional Home Purchase Loans
C) Refinancings
D) Home Improvement Loans
F) Non-occupant Loans on < 5 Family Dwellings (A B C & D)
G) Loans On Manufactured Home Dwelling (A B C & D)
Number
Average Value
Number
Average Value
Number
Average Value
Number
Average Value
Number
Average Value
Number
Average Value
LOANS ORIGINATED
5
$90,288
24
$119,755
65
$124,065
16
$39,803
5
$53,206
2
$46,470
APPLICATIONS APPROVED, NOT ACCEPTED
0
$0
3
$180,353
11
$146,915
2
$60,225
0
$0
0
$0
APPLICATIONS DENIED
1
$91,990
7
$74,179
37
$115,961
6
$76,188
0
$0
2
$64,255
APPLICATIONS WITHDRAWN
0
$0
0
$0
16
$119,676
1
$73,500
0
$0
0
$0
FILES CLOSED FOR INCOMPLETENESS
0
$0
1
$94,370
8
$130,761
0
$0
0
$0
0
$0
Aggregated Statistics For Year 2003 (Based on 2 partial tracts)
A) FHA, FSA/RHS & VA Home Purchase Loans
B) Conventional Home Purchase Loans
C) Refinancings
D) Home Improvement Loans
F) Non-occupant Loans on < 5 Family Dwellings (A B C & D)
Number
Average Value
Number
Average Value
Number
Average Value
Number
Average Value
Number
Average Value
LOANS ORIGINATED
9
$104,957
25
$145,978
128
$124,900
9
$29,190
8
$71,545
APPLICATIONS APPROVED, NOT ACCEPTED
0
$0
4
$104,442
14
$131,861
1
$20,390
0
$0
APPLICATIONS DENIED
0
$0
4
$85,950
43
$106,144
7
$24,861
0
$0
APPLICATIONS WITHDRAWN
0
$0
4
$129,458
18
$125,979
1
$18,020
0
$0
FILES CLOSED FOR INCOMPLETENESS
0
$0
0
$0
4
$124,478
1
$23,240
0
$0
Aggregated Statistics For Year 2002 (Based on 2 partial tracts)
A) FHA, FSA/RHS & VA Home Purchase Loans
B) Conventional Home Purchase Loans
C) Refinancings
D) Home Improvement Loans
F) Non-occupant Loans on < 5 Family Dwellings (A B C & D)
Number
Average Value
Number
Average Value
Number
Average Value
Number
Average Value
Number
Average Value
LOANS ORIGINATED
7
$103,240
26
$128,745
120
$120,490
12
$22,050
7
$71,197
APPLICATIONS APPROVED, NOT ACCEPTED
0
$0
3
$136,253
19
$105,872
1
$11,860
1
$83,460
APPLICATIONS DENIED
1
$101,000
3
$97,053
29
$93,777
4
$18,375
2
$43,150
APPLICATIONS WITHDRAWN
0
$0
3
$92,153
15
$103,313
0
$0
1
$134,670
FILES CLOSED FOR INCOMPLETENESS
0
$0
1
$165,020
6
$159,410
0
$0
0
$0
Aggregated Statistics For Year 2001 (Based on 2 partial tracts)
A) FHA, FSA/RHS & VA Home Purchase Loans
B) Conventional Home Purchase Loans
C) Refinancings
D) Home Improvement Loans
F) Non-occupant Loans on < 5 Family Dwellings (A B C & D)
Number
Average Value
Number
Average Value
Number
Average Value
Number
Average Value
Number
Average Value
LOANS ORIGINATED
11
$115,274
24
$124,952
91
$105,179
14
$27,910
4
$67,100
APPLICATIONS APPROVED, NOT ACCEPTED
1
$120,450
1
$173,560
16
$81,355
2
$27,265
1
$63,070
APPLICATIONS DENIED
0
$0
6
$91,678
38
$92,132
5
$12,044
2
$67,810
APPLICATIONS WITHDRAWN
0
$0
0
$0
13
$108,555
1
$57,850
0
$0
FILES CLOSED FOR INCOMPLETENESS
0
$0
0
$0
8
$107,880
0
$0
0
$0
Aggregated Statistics For Year 2000 (Based on 2 partial tracts)
A) FHA, FSA/RHS & VA Home Purchase Loans
B) Conventional Home Purchase Loans
C) Refinancings
D) Home Improvement Loans
F) Non-occupant Loans on < 5 Family Dwellings (A B C & D)
Number
Average Value
Number
Average Value
Number
Average Value
Number
Average Value
Number
Average Value
LOANS ORIGINATED
9
$93,207
29
$129,473
29
$86,844
15
$16,059
2
$87,255
APPLICATIONS APPROVED, NOT ACCEPTED
0
$0
7
$121,870
7
$79,259
3
$22,447
1
$124,710
APPLICATIONS DENIED
2
$105,270
8
$94,662
21
$83,662
5
$27,598
1
$69,230
APPLICATIONS WITHDRAWN
2
$110,250
1
$182,090
8
$71,426
1
$82,040
0
$0
FILES CLOSED FOR INCOMPLETENESS
0
$0
1
$83,460
1
$70,660
0
$0
0
$0
Aggregated Statistics For Year 1999 (Based on 1 partial tract)
A) FHA, FSA/RHS & VA Home Purchase Loans
B) Conventional Home Purchase Loans
C) Refinancings
D) Home Improvement Loans
F) Non-occupant Loans on < 5 Family Dwellings (A B C & D)
Detailed PMIC statistics for the following Tracts:2104.00
2002 - 2018 National Fire Incident Reporting System (NFIRS) incidents
Based on the data from the years 2002 - 2018 the average number of fire incidents per year is 20. The highest number of fire incidents - 49 took place in 2010, and the least - 6 in 2014. The data has an increasing trend.
When looking into fire subcategories, the most reports belonged to: Structure Fires (43.1%), and Outside Fires (34.1%).
Fire incident types reported to NFIRS in Zip Code 46149


 Nearest zip codes: 46167, 46165, 46147, 46122, 46112, 46052.


 Based on the data from the years 2002 - 2018 the average number of fire incidents per year is 20. The highest number of fire incidents - 49 took place in 2010, and the least - 6 in 2014. The data has an increasing trend.
 When looking into fire subcategories, the most reports belonged to: Structure Fires (43.1%), and Outside Fires (34.1%).