Estimated zip code population in 2022: 1,339 Zip code population in 2010: 1,068 Zip code population in 2000: 1,068
Houses and condos: 559 Renter-occupied apartments: 96
% of renters here:
17%
State:
29%
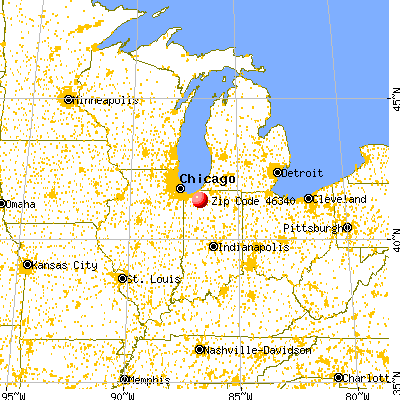
March 2022 cost of living index in zip code 46340: 85.8 (less than average, U.S. average is 100)
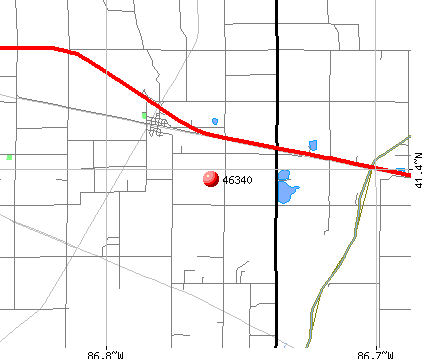
Land area: 32.9 sq. mi. Water area: 0.1 sq. mi.
Population density: 41 people per square mile
(very low).
OSM Map
General Map
Google Map
MSN Map
OSM Map
General Map
Google Map
MSN Map
OSM Map
General Map
Google Map
MSN Map
OSM Map
General Map
Google Map
MSN Map
Please wait while loading the map...
Real estate property taxes paid for housing units in 2022:
This zip code:
1.4% ($2,501)
Indiana:
0.7% ($1,467)
Median real estate property taxes paid for housing units with mortgages in 2022: $3,010 (1.8%) Median real estate property taxes paid for housing units with no mortgage in 2022: $1,455 (0.7%)
Business Search- 14 Million verified businesses
Males: 587
(43.9%)
Females: 751
(56.1%)
For population 25 years and over in 46340:
High school or higher: 79.0%
Bachelor's degree or higher: 16.2%
Graduate or professional degree: 5.2%
Mean travel time to work (commute): 37.7 minutes
For population 15 years and over in 46340:
Never married: 42.6%
Now married: 35.3%
Separated: 0.0%
Widowed: 2.3%
Divorced: 19.8%
Zip code 46340 compared to state average:
Unemployed percentage significantly below state average.
Black race population percentage significantly below state average.
Median age significantly above state average.
Foreign-born population percentage significantly below state average.
Renting percentage below state average.
Length of stay since moving in significantly above state average.
Number of college students significantly below state average.
Percentage of population with a bachelor's degree or higher below state average.
Estimated median house/condo value in 2022: $173,348
46340:
$173,348
Indiana:
$208,700
Median resident age:
This zip code:
56.2 years
Indiana median age:
38.2 years
Average household size:
This zip code:
2.4 people
Indiana:
2.4 people
Averages for the 2020 tax year for zip code 46340, filed in 2021:
Average Adjusted Gross Income (AGI) in 2020: $59,543 (Individual Income Tax Returns)
Here:
$59,543
State:
$64,978
Salary/wage: $53,653 (reported on 75.0% of returns)
Here:
$53,653
State:
$55,245
(% of AGI for various income ranges: 1054.6% for AGIs below $25k, 2900.0% for AGIs $25k-50k, 5362.2% for AGIs $50k-75k, 7598.3% for AGIs $75k-100k, 20976.0% for AGIs $100k-200k)
Taxable interest for individuals: $1,174 (reported on 31.7% of returns)
This zip code:
$1,174
Indiana:
$1,351
(% of AGI for various income ranges: 10.8% for AGIs below $25k, 56.0% for AGIs $25k-50k, 23.3% for AGIs $50k-75k, 30.0% for AGIs $75k-100k, 228.0% for AGIs $100k-200k)
Ordinary dividends: $1,655 (reported on 18.3% of returns)
Here:
$1,655
State:
$5,827
(% of AGI for various income ranges: 54.0% for AGIs $25k-50k, 56.7% for AGIs $50k-75k, 128.3% for AGIs $75k-100k)
Net capital gain/loss in AGI: +$5,944 (reported on 15.0% of returns)
Here:
+$5,944
State:
+$17,730
(% of AGI for various income ranges: 25.4% for AGIs below $25k, 151.1% for AGIs $50k-75k, 732.0% for AGIs $100k-200k)
Profit/loss from business: +$4,280 (reported on 8.3% of returns)
Here:
+$4,280
State:
+$12,144
(% of AGI for various income ranges: 41.5% for AGIs below $25k, 266.7% for AGIs $75k-100k)
Taxable individual retirement arrangement distribution: $20,317 (reported on 10.0% of returns)
46340:
$20,317
Indiana:
$18,302
(% of AGI for various income ranges: 513.0% for AGIs $25k-50k, 1176.7% for AGIs $75k-100k)
Earned income credit: $1,650 (reported on 10.0% of returns)
Here:
$1,650
State:
$2,298
(% of AGI for various income ranges: 76.2% for AGIs below $25k)
Percentage of individuals using paid preparers for their 2020 taxes: 93.3%
Here:
93%
State:
94%
(% for various income ranges: 94.4% for AGIs below $25k, 91.7% for AGIs $25k-50k, 100.0% for AGIs $50k-75k, 87.5% for AGIs $75k-100k, 90.9% for AGIs $100k-200k)
Averages for the 2012 tax year for zip code 46340, filed in 2013:
Average Adjusted Gross Income (AGI) in 2012: $55,130 (Individual Income Tax Returns)
Here:
$55,130
State:
$52,932
Salary/wage: $51,711 (reported on 78.6% of returns)
Here:
$51,711
State:
$45,173
(% of AGI for various income ranges: 66.2% for AGIs below $25k, 64.5% for AGIs $25k-50k, 75.7% for AGIs $50k-75k, 83.6% for AGIs $75k-100k, 71.2% for AGIs $100k-200k)
Taxable interest for individuals: $468 (reported on 33.9% of returns)
This zip code:
$468
Indiana:
$1,311
(% of AGI for various income ranges: 0.7% for AGIs below $25k, 0.4% for AGIs $25k-50k, 0.2% for AGIs $50k-75k, 0.1% for AGIs $75k-100k, 0.3% for AGIs $100k-200k)
Ordinary dividends: $1,667 (reported on 16.1% of returns)
Here:
$1,667
State:
$4,690
(% of AGI for various income ranges: 0.9% for AGIs $25k-50k, 0.2% for AGIs $50k-75k, 1.5% for AGIs $75k-100k)
Net capital gain/loss in AGI: +$967 (reported on 10.7% of returns)
Here:
+$967
State:
+$10,406
Profit/loss from business: +$7,657 (reported on 12.5% of returns)
Here:
+$7,657
State:
+$11,105
(% of AGI for various income ranges: 7.2% for AGIs below $25k, 3.0% for AGIs $25k-50k, 4.0% for AGIs $75k-100k)
Taxable individual retirement arrangement distribution: $7,500 (reported on 8.9% of returns)
46340:
$7,500
Indiana:
$13,841
Total itemized deductions: $17,125 (19% of AGI, reported on 28.6% of returns)
Here:
$17,125
State:
$20,913
Here:
18.8% of AGI
State:
18.2% of AGI
(% of AGI for various income ranges: 11.4% for AGIs $25k-50k, 8.4% for AGIs $50k-75k, 9.5% for AGIs $75k-100k, 9.6% for AGIs $100k-200k)
Charity contributions: $2,433 (reported on 21.4% of returns)
Here:
$2,433
State:
$4,697
(% of AGI for various income ranges: 1.5% for AGIs below $25k, 0.4% for AGIs $50k-75k, 0.9% for AGIs $75k-100k, 1.5% for AGIs $100k-200k)
Taxes paid: $6,438 (reported on 28.6% of returns)
46340:
$6,438
State:
$7,456
(% of AGI for various income ranges: 2.7% for AGIs $25k-50k, 2.8% for AGIs $50k-75k, 3.9% for AGIs $75k-100k, 4.3% for AGIs $100k-200k)
Earned income credit: $2,214 (reported on 12.5% of returns)
Here:
$2,214
State:
$2,265
(% of AGI for various income ranges: 7.2% for AGIs below $25k)
Percentage of individuals using paid preparers for their 2012 taxes: 57.1%
Here:
57%
State:
53%
(% for various income ranges: 50.0% for AGIs below $25k, 54.5% for AGIs $25k-50k, 66.7% for AGIs $50k-75k, 50.0% for AGIs $75k-100k, 71.4% for AGIs $100k-200k)
Averages for the 2004 tax year for zip code 46340, filed in 2005:
Average Adjusted Gross Income (AGI) in 2004: $44,167 (Individual Income Tax Returns)
Here:
$44,167
State:
$44,790
Salary/wage: $37,857 (reported on 84.6% of returns)
Here:
$37,857
State:
$39,615
(% of AGI for various income ranges: 101.0% for AGIs below $10k, 73.9% for AGIs $10k-25k, 75.1% for AGIs $25k-50k, 76.5% for AGIs $50k-75k, 87.9% for AGIs $75k-100k, 51.4% for AGIs over 100k)
Taxable interest for individuals: $1,210 (reported on 49.3% of returns)
This zip code:
$1,210
Indiana:
$1,535
(% of AGI for various income ranges: 3.2% for AGIs below $10k, 1.9% for AGIs $10k-25k, 1.0% for AGIs $25k-50k, 2.0% for AGIs $50k-75k, 0.7% for AGIs $75k-100k, 1.1% for AGIs over 100k)
Taxable dividends: $889 (reported on 18.9% of returns)
Here:
$889
State:
$2,998
(% of AGI for various income ranges: 3.4% for AGIs below $10k, 0.1% for AGIs $10k-25k, 0.2% for AGIs $25k-50k, 0.1% for AGIs $50k-75k, 0.2% for AGIs $75k-100k, 0.9% for AGIs over 100k)
Net capital gain/loss: +$3,162 (reported on 13.0% of returns)
Here:
+$3,162
State:
+$8,619
(% of AGI for various income ranges: -0.7% for AGIs below $10k, -0.0% for AGIs $25k-50k, 1.4% for AGIs $50k-75k, 2.4% for AGIs over 100k)
Profit/loss from business: +$10,676 (reported on 13.0% of returns)
Here:
+$10,676
State:
+$10,071
(% of AGI for various income ranges: 19.8% for AGIs below $10k, 5.2% for AGIs $25k-50k, 3.7% for AGIs $50k-75k, 4.0% for AGIs $75k-100k)
Profit/loss from farming: +$6,080 (reported on 4.4% of returns)
Here:
+$6,080
State:
-$2,212
IRA payment deduction: $3,769 (reported on 2.3% of returns)
46340:
$3,769
Indiana:
$2,840
Total itemized deductions: $13,505 (20% of AGI, reported on 32.3% of returns)
Here:
$13,505
State:
$17,065
Here:
19.6% of AGI
State:
19.5% of AGI
(% of AGI for various income ranges: 8.1% for AGIs $10k-25k, 12.0% for AGIs $25k-50k, 10.3% for AGIs $50k-75k, 10.0% for AGIs $75k-100k, 8.7% for AGIs over 100k)
Charity contributions deductions: $1,828 (3% of AGI, reported on 23.5% of returns)
Here:
$1,828
State:
$3,550
Here:
2.6% of AGI
State:
3.8% of AGI
(% of AGI for various income ranges: 1.3% for AGIs $25k-50k, 0.4% for AGIs $50k-75k, 1.3% for AGIs $75k-100k, 1.5% for AGIs over 100k)
Total tax: $5,926 (reported on 78.2% of returns)
46340:
$5,926
State:
$6,914
(% of AGI for various income ranges: 1.7% for AGIs below $10k, 5.0% for AGIs $10k-25k, 7.6% for AGIs $25k-50k, 9.8% for AGIs $50k-75k, 10.9% for AGIs $75k-100k, 16.1% for AGIs over 100k)
Earned income credit: $1,345 (reported on 9.6% of returns)
Here:
$1,345
State:
$1,685
Percentage of individuals using paid preparers for their 2004 taxes: 64.9%
Here:
65%
State:
59%
(% for various income ranges: 58.7% for AGIs below $10k, 66.9% for AGIs $10k-25k, 63.9% for AGIs $25k-50k, 72.1% for AGIs $50k-75k, 59.3% for AGIs $75k-100k, 67.6% for AGIs over 100k)
Size of family households: 116 2-persons, 124 3-persons, 69 4-persons, 14 5-persons
Size of nonfamily households: 86 1-person, 153 2-persons
53 married couples with children.
120 single-parent households (120 women).
99.2% of residents of 46340 zip code speak English at home.
Foreign born population: 0 (0.0%)
:
0.0%
Whole state:
6.1%
24%German
16%American
14%English
10%European
9%Irish
7%Russian
6%Polish
Facilities with environmental interests located in this zip code:
WALSH & KELLY, INC (14532 SOUTH STATE ROAD 39 in HANNA, IN)
AIR SYNTHETIC MINOR (AIRS/AFS) Business SIC classification: ASPHALT PAVING MIXTURES AND BLOCKS
Housing units lacking complete kitchen facilities: 0.5%
49.6%Utility gas
25.5%Other fuel
21.7%Bottled, tank, or LP gas
1.8%Electricity
1.8%Wood
Population in 1990: 941. Population change in the 1990s: +127 (+13.5%).
Place of birth for U.S.-born residents:
This state: 1,133
Midwest: 197
65% of the 46340 zip code residents lived in the same house 5 years ago. Out of people who lived in different houses, 69% lived in this county. Out of people who lived in different counties, 50% lived in Indiana.
91% of the 46340 zip code residents lived in the same house 1 year ago. Out of people who lived in different houses, 51% moved from this county. Out of people who lived in different houses, 37% moved from different county within same state. Out of people who lived in different houses, 11% moved from different state.
Private vs. public school enrollment:
Students in private schools in grades 1 to 8 (elementary and middle school):
Here:
0.0%
Indiana:
14.9%
Students in private schools in grades 9 to 12 (high school):
Here:
0.0%
Indiana:
11.4%
Students in private undergraduate colleges:
Here:
0.0%
Indiana:
22.3%
Occupation by median earnings in the past 12 months ($)
80,290Management occupations
50,956Office and administrative support occupations
36,727Construction and extraction occupations
27,739Food preparation and serving related occupations
Top industries in this zip code by the number of employees in 2005:
Construction: New Single-Family Housing Construction (except Operative Builders) (10-19 employees: 1 establishment)
Construction: Other Heavy and Civil Engineering Construction (10-19: 1)
Accommodation and Food Services: Full-Service Restaurants (10-19: 1)
Mining: Construction Sand and Gravel Mining (10-19: 1)
Administrative and Support and Waste Management and Remediation Services: Janitorial Services (10-19: 1)
Other Services (except Public Administration): General Automotive Repair (5-9: 1)
Construction: Electrical Contractors (5-9: 1)
Accommodation and Food Services: Drinking Places (Alcoholic Beverages) (1-4: 1)
Fatal accident statistics in 2011:
Fatal accident count: 1
Vehicles involved in fatal accidents: 2
Fatal accidents caused by drunken drivers: 0
Fatalities: 1
Persons involved in fatal accidents: 2
Pedestrians involved in fatal accidents: 0
Home Mortgage Disclosure Act Aggregated Statistics For Year 2009 (Based on 2 partial tracts)
A) FHA, FSA/RHS & VA Home Purchase Loans
B) Conventional Home Purchase Loans
C) Refinancings
D) Home Improvement Loans
F) Non-occupant Loans on < 5 Family Dwellings (A B C & D)
G) Loans On Manufactured Home Dwelling (A B C & D)
Number
Average Value
Number
Average Value
Number
Average Value
Number
Average Value
Number
Average Value
Number
Average Value
LOANS ORIGINATED
11
$128,000
8
$105,115
48
$130,732
5
$42,046
1
$97,910
4
$106,110
APPLICATIONS APPROVED, NOT ACCEPTED
1
$134,190
0
$0
6
$131,622
1
$6,960
0
$0
0
$0
APPLICATIONS DENIED
5
$124,350
2
$67,345
22
$115,146
4
$53,180
0
$0
2
$143,135
APPLICATIONS WITHDRAWN
0
$0
0
$0
10
$171,763
0
$0
0
$0
0
$0
FILES CLOSED FOR INCOMPLETENESS
0
$0
0
$0
2
$180,910
1
$121,270
0
$0
0
$0
Aggregated Statistics For Year 2008 (Based on 2 partial tracts)
A) FHA, FSA/RHS & VA Home Purchase Loans
B) Conventional Home Purchase Loans
C) Refinancings
D) Home Improvement Loans
G) Loans On Manufactured Home Dwelling (A B C & D)
Number
Average Value
Number
Average Value
Number
Average Value
Number
Average Value
Number
Average Value
LOANS ORIGINATED
11
$123,482
11
$126,555
34
$121,765
5
$51,588
4
$82,130
APPLICATIONS APPROVED, NOT ACCEPTED
2
$78,030
2
$123,505
3
$86,643
1
$20,870
1
$106,860
APPLICATIONS DENIED
1
$115,300
5
$160,432
18
$167,019
9
$50,362
2
$130,215
APPLICATIONS WITHDRAWN
0
$0
0
$0
10
$136,178
2
$21,620
1
$115,800
FILES CLOSED FOR INCOMPLETENESS
0
$0
0
$0
3
$189,027
0
$0
0
$0
Aggregated Statistics For Year 2007 (Based on 2 partial tracts)
A) FHA, FSA/RHS & VA Home Purchase Loans
B) Conventional Home Purchase Loans
C) Refinancings
D) Home Improvement Loans
F) Non-occupant Loans on < 5 Family Dwellings (A B C & D)
G) Loans On Manufactured Home Dwelling (A B C & D)
Number
Average Value
Number
Average Value
Number
Average Value
Number
Average Value
Number
Average Value
Number
Average Value
LOANS ORIGINATED
2
$142,890
23
$111,652
32
$118,441
9
$30,097
1
$128,230
3
$104,370
APPLICATIONS APPROVED, NOT ACCEPTED
0
$0
2
$124,250
6
$75,130
4
$20,502
0
$0
0
$0
APPLICATIONS DENIED
1
$87,970
5
$102,482
25
$108,088
9
$50,970
2
$60,135
1
$89,960
APPLICATIONS WITHDRAWN
0
$0
1
$94,930
8
$124,064
1
$37,280
0
$0
0
$0
FILES CLOSED FOR INCOMPLETENESS
0
$0
2
$90,950
3
$101,057
1
$45,230
0
$0
0
$0
Aggregated Statistics For Year 2006 (Based on 2 partial tracts)
A) FHA, FSA/RHS & VA Home Purchase Loans
B) Conventional Home Purchase Loans
C) Refinancings
D) Home Improvement Loans
F) Non-occupant Loans on < 5 Family Dwellings (A B C & D)
G) Loans On Manufactured Home Dwelling (A B C & D)
Number
Average Value
Number
Average Value
Number
Average Value
Number
Average Value
Number
Average Value
Number
Average Value
LOANS ORIGINATED
11
$107,759
24
$106,503
33
$84,565
8
$27,770
3
$83,497
5
$91,946
APPLICATIONS APPROVED, NOT ACCEPTED
0
$0
4
$73,805
9
$88,798
1
$17,890
0
$0
0
$0
APPLICATIONS DENIED
0
$0
12
$96,583
33
$98,873
8
$29,758
1
$75,540
3
$106,523
APPLICATIONS WITHDRAWN
1
$116,800
2
$99,895
15
$91,713
0
$0
0
$0
0
$0
FILES CLOSED FOR INCOMPLETENESS
0
$0
1
$120,770
7
$99,541
0
$0
0
$0
1
$147,110
Aggregated Statistics For Year 2005 (Based on 2 partial tracts)
A) FHA, FSA/RHS & VA Home Purchase Loans
B) Conventional Home Purchase Loans
C) Refinancings
D) Home Improvement Loans
F) Non-occupant Loans on < 5 Family Dwellings (A B C & D)
G) Loans On Manufactured Home Dwelling (A B C & D)
Number
Average Value
Number
Average Value
Number
Average Value
Number
Average Value
Number
Average Value
Number
Average Value
LOANS ORIGINATED
5
$140,950
26
$93,149
46
$90,854
9
$33,464
5
$71,866
7
$107,707
APPLICATIONS APPROVED, NOT ACCEPTED
0
$0
5
$123,852
7
$103,660
2
$29,820
0
$0
1
$68,090
APPLICATIONS DENIED
0
$0
6
$112,737
43
$96,996
5
$22,464
2
$82,005
5
$93,634
APPLICATIONS WITHDRAWN
0
$0
1
$69,080
15
$104,668
1
$208,240
0
$0
0
$0
FILES CLOSED FOR INCOMPLETENESS
0
$0
2
$160,285
2
$145,375
0
$0
0
$0
1
$121,270
Aggregated Statistics For Year 2004 (Based on 2 partial tracts)
A) FHA, FSA/RHS & VA Home Purchase Loans
B) Conventional Home Purchase Loans
C) Refinancings
D) Home Improvement Loans
F) Non-occupant Loans on < 5 Family Dwellings (A B C & D)
G) Loans On Manufactured Home Dwelling (A B C & D)


+$6,080
-$2,212
 Nearest zip codes: 46382, 46348, 46390, 46346, 46345, 46532.


