Estimated zip code population in 2022: 5,696 Zip code population in 2010: 5,667 Zip code population in 2000: 7,345
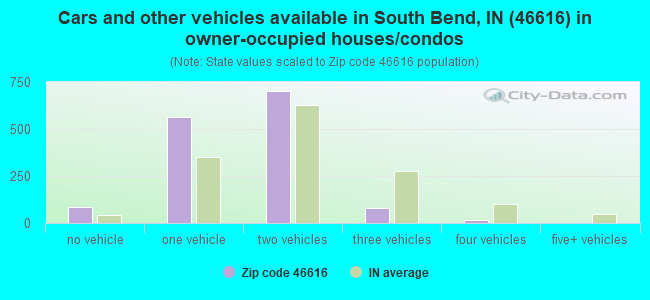
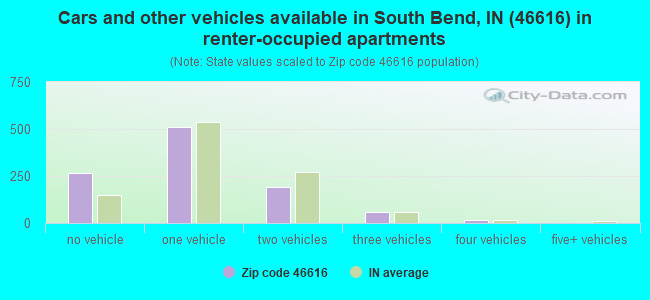
Houses and condos: 2,772 Renter-occupied apartments: 1,035
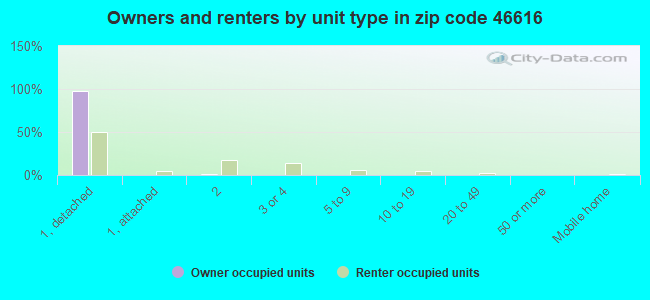
% of renters here:
42%
State:
29%
March 2022 cost of living index in zip code 46616: 84.4 (less than average, U.S. average is 100)
Land area: 1.5 sq. mi. Water area: 0.1 sq. mi.
Population density: 3,879 people per square mile
(average).
OSM Map
General Map
Google Map
MSN Map
OSM Map
General Map
Google Map
MSN Map
OSM Map
General Map
Google Map
MSN Map
OSM Map
General Map
Google Map
MSN Map
Please wait while loading the map...
Real estate property taxes paid for housing units in 2022:
This zip code:
1.0% ($1,283)
Indiana:
0.7% ($1,467)
Median real estate property taxes paid for housing units with mortgages in 2022: $1,349 (1.1%) Median real estate property taxes paid for housing units with no mortgage in 2022: $1,124 (1.0%)
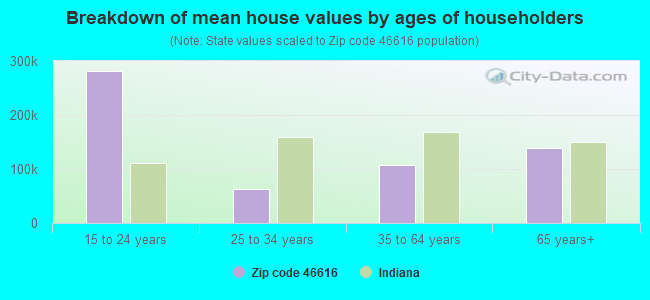
Estimated median house/condo value in 2022: $124,015
46616:
$124,015
Indiana:
$208,700
According to our research of Indiana and other state lists, there was 1 registered sex offender living in 46616 zip code as of May 16, 2024. The ratio of all residents to sex offenders in zip code 46616 is 5,742 to 1. The ratio of registered sex offenders to all residents in this zip code is much lower than the state average.
Median resident age:
This zip code:
33.7 years
Indiana median age:
38.2 years
Average household size:
This zip code:
2.3 people
Indiana:
2.4 people
Averages for the 2020 tax year for zip code 46616, filed in 2021:
Average Adjusted Gross Income (AGI) in 2020: $45,778 (Individual Income Tax Returns)
Here:
$45,778
State:
$64,978
Salary/wage: $40,915 (reported on 88.7% of returns)
Here:
$40,915
State:
$55,245
(% of AGI for various income ranges: 1085.1% for AGIs below $25k, 3702.5% for AGIs $25k-50k, 6693.8% for AGIs $50k-75k, 9205.7% for AGIs $75k-100k, 16441.8% for AGIs $100k-200k, 73805.0% for AGIs over 200k)
Taxable interest for individuals: $998 (reported on 18.7% of returns)
This zip code:
$998
Indiana:
$1,351
(% of AGI for various income ranges: 11.3% for AGIs below $25k, 9.2% for AGIs $25k-50k, 28.1% for AGIs $50k-75k, 27.9% for AGIs $75k-100k, 37.3% for AGIs $100k-200k, 980.0% for AGIs over 200k)
Ordinary dividends: $2,797 (reported on 11.0% of returns)
Here:
$2,797
State:
$5,827
(% of AGI for various income ranges: 11.2% for AGIs below $25k, 14.2% for AGIs $25k-50k, 20.4% for AGIs $50k-75k, 112.9% for AGIs $75k-100k, 169.1% for AGIs $100k-200k, 1260.0% for AGIs over 200k)
Net capital gain/loss in AGI: +$8,270 (reported on 9.5% of returns)
Here:
+$8,270
State:
+$17,730
(% of AGI for various income ranges: 4.8% for AGIs below $25k, 11.6% for AGIs $25k-50k, 73.1% for AGIs $50k-75k, 190.0% for AGIs $75k-100k, 423.6% for AGIs $100k-200k, 5865.0% for AGIs over 200k)
Profit/loss from business: +$8,149 (reported on 13.8% of returns)
Here:
+$8,149
State:
+$12,144
(% of AGI for various income ranges: 82.3% for AGIs below $25k, 118.5% for AGIs $25k-50k, 172.7% for AGIs $50k-75k, 252.9% for AGIs $75k-100k, 597.3% for AGIs $100k-200k)
Taxable individual retirement arrangement distribution: $12,927 (reported on 5.3% of returns)
46616:
$12,927
Indiana:
$18,302
(% of AGI for various income ranges: 30.4% for AGIs below $25k, 38.0% for AGIs $25k-50k, 137.7% for AGIs $50k-75k, 245.0% for AGIs $75k-100k, 590.0% for AGIs $100k-200k)
Total itemized deductions: $35,233 (reported on 2.1% of returns)
Here:
$35,233
State:
$35,601
(% of AGI for various income ranges: 809.3% for AGIs $75k-100k, 4905.0% for AGIs over 200k)
Charity contributions: $18,980 (reported on 1.8% of returns)
Here:
$18,980
State:
$15,596
(% of AGI for various income ranges: 862.7% for AGIs $100k-200k)
Taxes paid: $7,750 (reported on 2.1% of returns)
46616:
$7,750
State:
$7,542
(% of AGI for various income ranges: 167.1% for AGIs $75k-100k, 1155.0% for AGIs over 200k)
Earned income credit: $2,599 (reported on 28.3% of returns)
Here:
$2,599
State:
$2,298
(% of AGI for various income ranges: 144.9% for AGIs below $25k, 88.9% for AGIs $25k-50k)
Percentage of individuals using paid preparers for their 2020 taxes: 94.3%
Here:
94%
State:
94%
(% for various income ranges: 93.9% for AGIs below $25k, 94.6% for AGIs $25k-50k, 94.1% for AGIs $50k-75k, 94.7% for AGIs $75k-100k, 94.1% for AGIs $100k-200k, 100.0% for AGIs over 200k)
Averages for the 2012 tax year for zip code 46616, filed in 2013:
Average Adjusted Gross Income (AGI) in 2012: $34,765 (Individual Income Tax Returns)
Here:
$34,765
State:
$52,932
Salary/wage: $32,500 (reported on 86.7% of returns)
Here:
$32,500
State:
$45,173
(% of AGI for various income ranges: 76.7% for AGIs below $25k, 87.7% for AGIs $25k-50k, 86.4% for AGIs $50k-75k, 83.5% for AGIs $75k-100k, 71.5% for AGIs $100k-200k)
Taxable interest for individuals: $702 (reported on 22.1% of returns)
This zip code:
$702
Indiana:
$1,311
(% of AGI for various income ranges: 0.7% for AGIs below $25k, 0.3% for AGIs $25k-50k, 0.2% for AGIs $50k-75k, 0.2% for AGIs $75k-100k, 0.6% for AGIs $100k-200k)
Ordinary dividends: $3,360 (reported on 11.4% of returns)
Here:
$3,360
State:
$4,690
(% of AGI for various income ranges: 0.8% for AGIs below $25k, 0.5% for AGIs $25k-50k, 0.5% for AGIs $50k-75k, 0.9% for AGIs $75k-100k, 2.6% for AGIs $100k-200k)
Net capital gain/loss in AGI: +$331 (reported on 6.1% of returns)
Here:
+$331
State:
+$10,406
(% of AGI for various income ranges: 0.3% for AGIs $50k-75k)
Profit/loss from business: +$7,638 (reported on 14.8% of returns)
Here:
+$7,638
State:
+$11,105
(% of AGI for various income ranges: 10.2% for AGIs below $25k, 2.3% for AGIs $25k-50k, 0.8% for AGIs $50k-75k, 0.5% for AGIs $75k-100k, 2.2% for AGIs $100k-200k)
Taxable individual retirement arrangement distribution: $11,422 (reported on 6.8% of returns)
46616:
$11,422
Indiana:
$13,841
(% of AGI for various income ranges: 1.9% for AGIs below $25k, 1.6% for AGIs $25k-50k, 3.3% for AGIs $50k-75k, 3.6% for AGIs $100k-200k)
Total itemized deductions: $18,270 (23% of AGI, reported on 14.1% of returns)
Here:
$18,270
State:
$20,913
Here:
23.0% of AGI
State:
18.2% of AGI
(% of AGI for various income ranges: 3.4% for AGIs below $25k, 4.8% for AGIs $25k-50k, 7.0% for AGIs $50k-75k, 5.3% for AGIs $75k-100k, 15.0% for AGIs $100k-200k)
Charity contributions: $5,293 (reported on 10.6% of returns)
Here:
$5,293
State:
$4,697
(% of AGI for various income ranges: 0.3% for AGIs below $25k, 0.8% for AGIs $25k-50k, 1.1% for AGIs $50k-75k, 0.8% for AGIs $75k-100k, 4.5% for AGIs $100k-200k)
Taxes paid: $5,392 (reported on 14.1% of returns)
46616:
$5,392
State:
$7,456
(% of AGI for various income ranges: 0.5% for AGIs below $25k, 1.1% for AGIs $25k-50k, 1.9% for AGIs $50k-75k, 2.1% for AGIs $75k-100k, 5.0% for AGIs $100k-200k)
Earned income credit: $2,547 (reported on 32.3% of returns)
Here:
$2,547
State:
$2,265
(% of AGI for various income ranges: 10.6% for AGIs below $25k, 1.3% for AGIs $25k-50k)
Percentage of individuals using paid preparers for their 2012 taxes: 36.1%
Here:
36%
State:
53%
(% for various income ranges: 35.3% for AGIs below $25k, 33.8% for AGIs $25k-50k, 34.5% for AGIs $50k-75k, 38.5% for AGIs $75k-100k, 57.1% for AGIs $100k-200k)
Averages for the 2004 tax year for zip code 46616, filed in 2005:
Average Adjusted Gross Income (AGI) in 2004: $30,848 (Individual Income Tax Returns)
Here:
$30,848
State:
$44,790
Salary/wage: $29,371 (reported on 89.7% of returns)
Here:
$29,371
State:
$39,615
(% of AGI for various income ranges: 82.4% for AGIs below $10k, 86.4% for AGIs $10k-25k, 89.9% for AGIs $25k-50k, 89.1% for AGIs $50k-75k, 83.4% for AGIs $75k-100k, 70.7% for AGIs over 100k)
Taxable interest for individuals: $1,315 (reported on 30.7% of returns)
This zip code:
$1,315
Indiana:
$1,535
(% of AGI for various income ranges: 3.1% for AGIs below $10k, 2.0% for AGIs $10k-25k, 0.8% for AGIs $25k-50k, 0.7% for AGIs $50k-75k, 1.4% for AGIs $75k-100k, 1.9% for AGIs over 100k)
Taxable dividends: $1,632 (reported on 14.3% of returns)
Here:
$1,632
State:
$2,998
(% of AGI for various income ranges: 1.2% for AGIs below $10k, 0.6% for AGIs $10k-25k, 0.5% for AGIs $25k-50k, 0.4% for AGIs $50k-75k, 1.5% for AGIs $75k-100k, 1.3% for AGIs over 100k)
Net capital gain/loss: +$4,696 (reported on 10.0% of returns)
Here:
+$4,696
State:
+$8,619
(% of AGI for various income ranges: 1.0% for AGIs below $10k, 0.6% for AGIs $10k-25k, 0.5% for AGIs $25k-50k, 0.9% for AGIs $50k-75k, 0.4% for AGIs $75k-100k, 7.0% for AGIs over 100k)
Profit/loss from business: +$5,932 (reported on 10.3% of returns)
Here:
+$5,932
State:
+$10,071
(% of AGI for various income ranges: 6.1% for AGIs below $10k, 2.5% for AGIs $10k-25k, 0.6% for AGIs $25k-50k, 0.4% for AGIs $50k-75k, 2.4% for AGIs $75k-100k, 5.5% for AGIs over 100k)
IRA payment deduction: $2,642 (reported on 2.0% of returns)
46616:
$2,642
Indiana:
$2,840
Total itemized deductions: $13,719 (23% of AGI, reported on 21.1% of returns)
Here:
$13,719
State:
$17,065
Here:
22.7% of AGI
State:
19.5% of AGI
(% of AGI for various income ranges: 4.0% for AGIs below $10k, 5.4% for AGIs $10k-25k, 7.5% for AGIs $25k-50k, 11.2% for AGIs $50k-75k, 12.8% for AGIs $75k-100k, 14.2% for AGIs over 100k)
Charity contributions deductions: $3,013 (5% of AGI, reported on 16.9% of returns)
Here:
$3,013
State:
$3,550
Here:
4.7% of AGI
State:
3.8% of AGI
(% of AGI for various income ranges: 0.4% for AGIs below $10k, 0.5% for AGIs $10k-25k, 1.1% for AGIs $25k-50k, 1.4% for AGIs $50k-75k, 2.5% for AGIs $75k-100k, 4.2% for AGIs over 100k)
Total tax: $3,994 (reported on 65.3% of returns)
46616:
$3,994
State:
$6,914
(% of AGI for various income ranges: 1.6% for AGIs below $10k, 3.5% for AGIs $10k-25k, 7.0% for AGIs $25k-50k, 9.1% for AGIs $50k-75k, 10.2% for AGIs $75k-100k, 17.0% for AGIs over 100k)
Earned income credit: $1,870 (reported on 27.1% of returns)
Here:
$1,870
State:
$1,685
Percentage of individuals using paid preparers for their 2004 taxes: 50.5%
Here:
51%
State:
59%
(% for various income ranges: 52.2% for AGIs below $10k, 53.9% for AGIs $10k-25k, 46.0% for AGIs $25k-50k, 46.6% for AGIs $50k-75k, 52.6% for AGIs $75k-100k, 54.4% for AGIs over 100k)
Likely homosexual households (counted as self-reported same-sex unmarried-partner households)
Lesbian couples: 0.5% of all households
Gay men: 0.0% of all households
Household received Food Stamps/SNAP in the past 12 months: 488 Household did not receive Food Stamps/SNAP in the past 12 months: 1,994
Women who had a birth in the past 12 months: 102 (90 now married, 16 unmarried) Women who did not have a birth in the past 12 months: 1,327 (408 now married, 915 unmarried)
Housing units in zip code 46616 with a mortgage: 932 (92 second mortgage, 67 both second mortgage and home equity loan) Houses without a mortgage: 28
Median monthly owner costs for units with a mortgage: $1,086 Median monthly owner costs for units without a mortgage: $427
Residents with income below the poverty level in 2022:
This zip code:
17.2%
Whole state:
12.6%
Residents with income below 50% of the poverty level in 2022:
This zip code:
10.6%
Whole state:
6.3%
Median number of rooms in houses and condos:
Here:
6.8
State:
6.6
Median number of rooms in apartments:
Here:
5.5
State:
4.3
Notable locations in this zip code not listed on our city pages
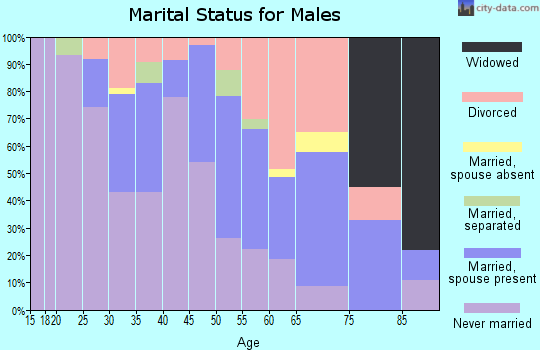
849 married couples with children.
409 single-parent households (38 men, 371 women).
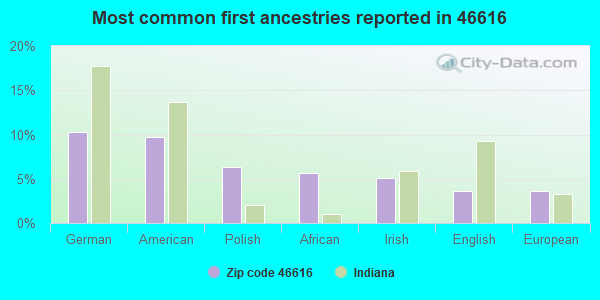
89.7% of residents of 46616 zip code speak English at home.
7.7% of residents speak Spanish at home (71% very well, 17% well, 12% not well).
1.8% of residents speak other Indo-European language at home (100% very well).
0.6% of residents speak Asian or Pacific Island language at home (40% very well, 43% not well, 17% not at all).
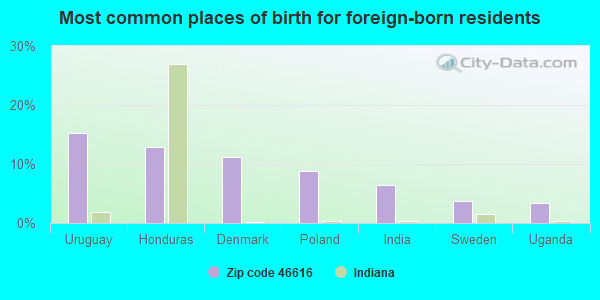
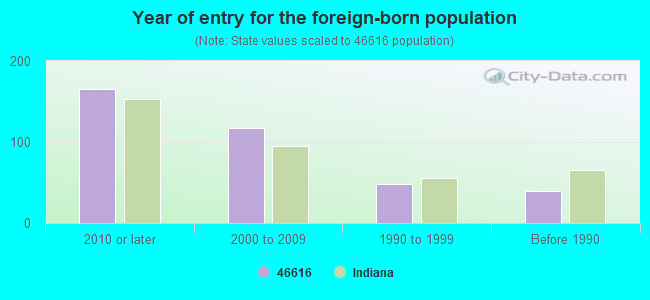
Foreign born population: 294 (5.2%) (40.6% of them are naturalized citizens)
Facilities with environmental interests located in this zip code:
BROWN ELEMENTARY SCHOOL (737 W BEALE ST in SOUTH BEND, IN)
STATE MASTER (Indiana facility tracking) - CRTK-8951, EPCRA (National Center for Education Statistics) - STATE ID-7521 Organizations: SOUTH BEND COMMUNITY SCH CORP (SCHOOL DISTRICT)
Alternative names: SOUTH BEND SCHOOL BROWN SCHOOL
CONCORD CUSTOM CLEANERS #140 (1506 PORTAGE AVE in SOUTH BEND, IN)
STATE MASTER (Indiana facility tracking) - UST-5677, UNDERGROUND STORAGE TANK PROGRAM (Resource Conservation and Recovery Act (tracking hazardous waste)) Organizations: BEGLEY CO (CONTACT/OWNER)
Alternative names: CONCORD CUSTOM CLEANERS 140
PORTAGE SUNOCO SERVICE STATION (1335 PORTAGE AVE in SOUTH BEND, IN)
STATE MASTER (Indiana facility tracking) - UST-22842, UNDERGROUND STORAGE TANK PROGRAM (Resource Conservation and Recovery Act (tracking hazardous waste))
AMOCO 259 (PORTAGE AVE AND KING ST in SOUTH BEND, IN)
STATE MASTER (Indiana facility tracking) Conditionally Exempt Small Quantity Generators, less than 100 kg/month of hazardous waste (Resource Conservation and Recovery Act (tracking hazardous waste)) - notification Organizations: AMOCO OIL COMPANY (CONTACT/OWNER)
LOUIES TUX SHOP (716 LINCOLNWAY W in SOUTH BEND, IN)
STATE MASTER (Indiana facility tracking) Conditionally Exempt Small Quantity Generators, less than 100 kg/month of hazardous waste (Resource Conservation and Recovery Act (tracking hazardous waste))
RIVERSIDE NORTH APARTMENTS (1671 N RIVERSIDE DRIVE in SOUTHBEND, IN)
COMPLIANCE ACTIVITY (Tracking inspections of insecticide, fungicide, and rodenticide, and toxic substances)
LINCOLNWAY MINIMART (705 LINCOLNWAY in SOUTH BEND, IN)
ENFORCEMENT/COMPLIANCE ACTIVITY (Integrated Compliance Information System)
Housing units lacking complete plumbing facilities: 1.7% Housing units lacking complete kitchen facilities: 1.3%
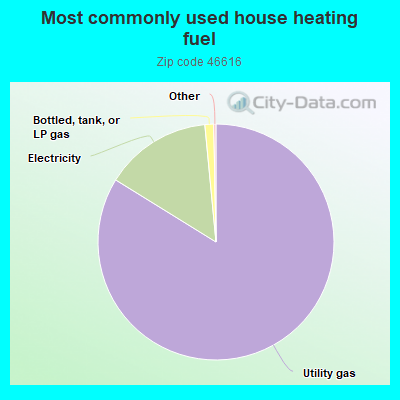
83.9%Utility gas
14.7%Electricity
1.2%Bottled, tank, or LP gas
Population in 1990: 8,132.
Place of birth for U.S.-born residents:
This state: 3,208
Northeast: 220
Midwest: 1,216
South: 354
West: 355
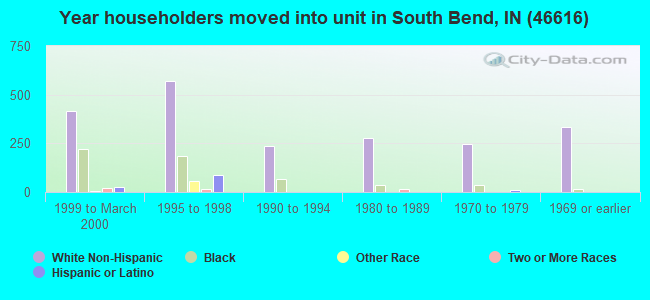
47% of the 46616 zip code residents lived in the same house 5 years ago. Out of people who lived in different houses, 65% lived in this county. Out of people who lived in different counties, 50% lived in Indiana.
81% of the 46616 zip code residents lived in the same house 1 year ago. Out of people who lived in different houses, 79% moved from this county. Out of people who lived in different houses, 4% moved from different county within same state. Out of people who lived in different houses, 12% moved from different state.
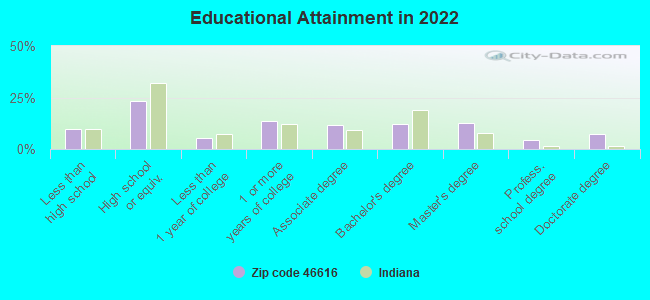
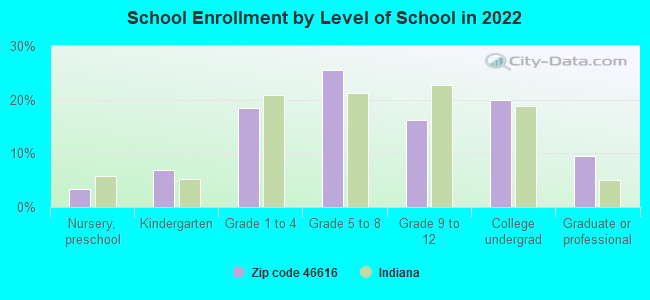
Private vs. public school enrollment:
Students in private schools in grades 1 to 8 (elementary and middle school): 178
Here:
32.0%
Indiana:
14.9%
Students in private schools in grades 9 to 12 (high school): 10
Here:
5.2%
Indiana:
11.4%
Students in private undergraduate colleges: 15
Here:
6.1%
Indiana:
22.3%
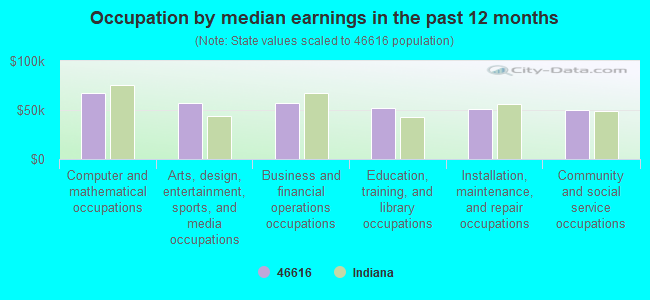
Occupation by median earnings in the past 12 months ($)
67,422Computer and mathematical occupations
57,051Arts, design, entertainment, sports, and media occupations
57,006Business and financial operations occupations
51,874Education, training, and library occupations
51,161Installation, maintenance, and repair occupations
50,213Community and social service occupations
Top industries in this zip code by the number of employees in 2005:
Health Care and Social Assistance: Offices of Physicians (except Mental Health Specialists) (20-49 employees: 1 establishment)
Health Care and Social Assistance: Other Community Housing Services (20-49: 1)
Other Services (except Public Administration): Cemeteries and Crematories (10-19: 1, 1-4: 1)
Educational Services: Fine Arts Schools (10-19: 1, 1-4: 1)
Finance and Insurance: Credit Unions (10-19: 1)
Other Services (except Public Administration): Funeral Homes and Funeral Services (10-19: 1)
Wholesale Trade: Tobacco and Tobacco Product Merchant Wholesalers (10-19: 1)
Wholesale Trade: Petroleum Bulk Stations and Terminals (10-19: 1)
Other Services (except Public Administration): Industrial Launderers (10-19: 1)
People in group quarters in 2010:
12 people in group homes intended for adults
People in group quarters in 2000:
14 people in homes for the mentally retarded
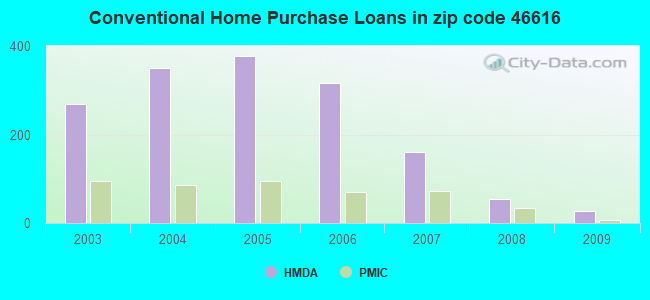
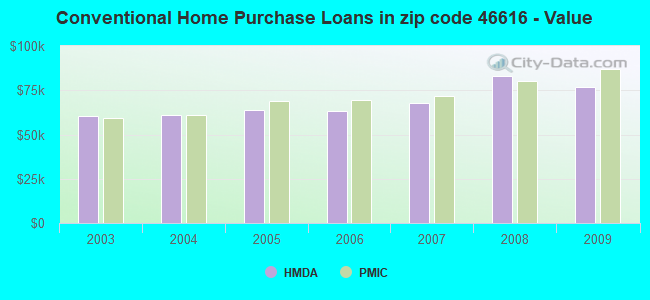
Home Mortgage Disclosure Act Aggregated Statistics For Year 2009 (Based on 10 partial tracts)
A) FHA, FSA/RHS & VA Home Purchase Loans
B) Conventional Home Purchase Loans
C) Refinancings
D) Home Improvement Loans
F) Non-occupant Loans on < 5 Family Dwellings (A B C & D)
Number
Average Value
Number
Average Value
Number
Average Value
Number
Average Value
Number
Average Value
LOANS ORIGINATED
38
$84,022
28
$76,665
112
$93,275
4
$6,870
13
$74,633
APPLICATIONS APPROVED, NOT ACCEPTED
4
$106,312
2
$49,665
13
$64,221
2
$14,265
0
$0
APPLICATIONS DENIED
4
$78,895
10
$38,697
63
$80,112
17
$22,268
4
$38,598
APPLICATIONS WITHDRAWN
0
$0
7
$65,323
32
$80,483
0
$0
4
$60,345
FILES CLOSED FOR INCOMPLETENESS
2
$193,935
0
$0
0
$0
1
$23,800
0
$0
Aggregated Statistics For Year 2008 (Based on 10 partial tracts)
A) FHA, FSA/RHS & VA Home Purchase Loans
B) Conventional Home Purchase Loans
C) Refinancings
D) Home Improvement Loans
E) Loans on Dwellings For 5+ Families
F) Non-occupant Loans on < 5 Family Dwellings (A B C & D)
Number
Average Value
Number
Average Value
Number
Average Value
Number
Average Value
Number
Average Value
Number
Average Value
LOANS ORIGINATED
44
$79,659
54
$83,181
75
$68,849
22
$40,935
4
$460,250
28
$61,200
APPLICATIONS APPROVED, NOT ACCEPTED
2
$95,315
4
$79,122
10
$83,052
2
$14,155
0
$0
2
$63,440
APPLICATIONS DENIED
12
$87,439
19
$52,743
67
$67,371
24
$23,474
0
$0
14
$51,304
APPLICATIONS WITHDRAWN
0
$0
4
$74,692
24
$80,756
0
$0
0
$0
2
$53,385
FILES CLOSED FOR INCOMPLETENESS
1
$107,080
3
$73,880
11
$93,024
0
$0
1
$780,510
1
$47,580
Aggregated Statistics For Year 2007 (Based on 10 partial tracts)
A) FHA, FSA/RHS & VA Home Purchase Loans
B) Conventional Home Purchase Loans
C) Refinancings
D) Home Improvement Loans
E) Loans on Dwellings For 5+ Families
F) Non-occupant Loans on < 5 Family Dwellings (A B C & D)
Number
Average Value
Number
Average Value
Number
Average Value
Number
Average Value
Number
Average Value
Number
Average Value
LOANS ORIGINATED
12
$87,333
161
$67,909
97
$55,950
32
$29,575
5
$741,808
85
$53,538
APPLICATIONS APPROVED, NOT ACCEPTED
3
$106,793
20
$70,628
13
$70,668
6
$12,587
0
$0
12
$64,023
APPLICATIONS DENIED
9
$66,104
71
$57,686
115
$57,592
50
$29,936
0
$0
65
$50,377
APPLICATIONS WITHDRAWN
3
$34,407
18
$83,374
36
$79,805
7
$23,033
0
$0
10
$87,671
FILES CLOSED FOR INCOMPLETENESS
0
$0
9
$45,536
14
$73,321
0
$0
0
$0
6
$53,195
Aggregated Statistics For Year 2006 (Based on 10 partial tracts)
A) FHA, FSA/RHS & VA Home Purchase Loans
B) Conventional Home Purchase Loans
C) Refinancings
D) Home Improvement Loans
E) Loans on Dwellings For 5+ Families
F) Non-occupant Loans on < 5 Family Dwellings (A B C & D)
G) Loans On Manufactured Home Dwelling (A B C & D)
Number
Average Value
Number
Average Value
Number
Average Value
Number
Average Value
Number
Average Value
Number
Average Value
Number
Average Value
LOANS ORIGINATED
25
$75,448
317
$63,390
127
$68,122
26
$21,954
1
$130,560
198
$55,272
0
$0
APPLICATIONS APPROVED, NOT ACCEPTED
1
$80,520
33
$58,198
57
$62,762
7
$36,894
0
$0
27
$52,464
0
$0
APPLICATIONS DENIED
4
$61,008
142
$67,130
202
$72,474
63
$41,669
0
$0
120
$66,489
2
$21,585
APPLICATIONS WITHDRAWN
2
$62,285
102
$67,228
87
$71,537
0
$0
0
$0
60
$59,361
0
$0
FILES CLOSED FOR INCOMPLETENESS
2
$63,060
18
$68,809
22
$79,618
1
$56,120
0
$0
13
$61,765
0
$0
Aggregated Statistics For Year 2005 (Based on 10 partial tracts)
A) FHA, FSA/RHS & VA Home Purchase Loans
B) Conventional Home Purchase Loans
C) Refinancings
D) Home Improvement Loans
E) Loans on Dwellings For 5+ Families
F) Non-occupant Loans on < 5 Family Dwellings (A B C & D)
Number
Average Value
Number
Average Value
Number
Average Value
Number
Average Value
Number
Average Value
Number
Average Value
LOANS ORIGINATED
23
$82,206
377
$63,855
170
$69,372
41
$26,571
3
$379,617
263
$58,169
APPLICATIONS APPROVED, NOT ACCEPTED
1
$92,800
30
$57,188
34
$82,381
8
$21,069
0
$0
14
$71,999
APPLICATIONS DENIED
0
$0
127
$71,691
215
$64,633
48
$28,212
0
$0
90
$63,924
APPLICATIONS WITHDRAWN
0
$0
64
$61,735
72
$79,481
7
$172,083
0
$0
50
$60,543
FILES CLOSED FOR INCOMPLETENESS
0
$0
23
$62,640
34
$69,438
3
$28,103
0
$0
20
$61,140
Aggregated Statistics For Year 2004 (Based on 10 partial tracts)
A) FHA, FSA/RHS & VA Home Purchase Loans
B) Conventional Home Purchase Loans
C) Refinancings
D) Home Improvement Loans
E) Loans on Dwellings For 5+ Families
F) Non-occupant Loans on < 5 Family Dwellings (A B C & D)
G) Loans On Manufactured Home Dwelling (A B C & D)
Number
Average Value
Number
Average Value
Number
Average Value
Number
Average Value
Number
Average Value
Number
Average Value
Number
Average Value
LOANS ORIGINATED
30
$82,328
351
$61,244
265
$61,512
30
$22,821
1
$241,530
273
$54,901
0
$0
APPLICATIONS APPROVED, NOT ACCEPTED
1
$120,780
56
$59,699
62
$61,914
7
$35,811
0
$0
51
$55,451
0
$0
APPLICATIONS DENIED
2
$106,830
81
$59,142
203
$68,591
33
$27,912
1
$166,570
65
$55,871
2
$32,280
APPLICATIONS WITHDRAWN
4
$58,622
46
$61,044
93
$61,183
9
$39,757
3
$2,855,117
30
$47,362
0
$0
FILES CLOSED FOR INCOMPLETENESS
0
$0
3
$60,527
17
$82,674
1
$12,240
0
$0
2
$67,100
0
$0
Aggregated Statistics For Year 2003 (Based on 10 partial tracts)
A) FHA, FSA/RHS & VA Home Purchase Loans
B) Conventional Home Purchase Loans
C) Refinancings
D) Home Improvement Loans
E) Loans on Dwellings For 5+ Families
F) Non-occupant Loans on < 5 Family Dwellings (A B C & D)
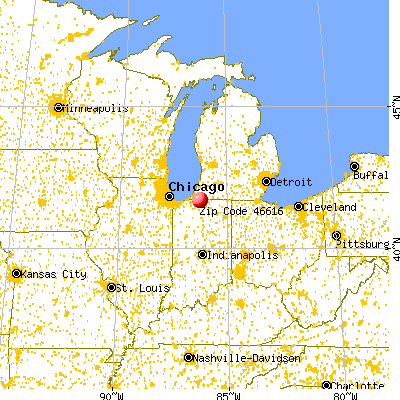


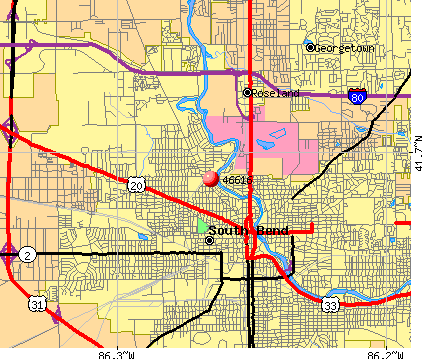 Nearest zip codes: 46556, 46601, 46617, 46613, 46637, 46615.