Estimated zip code population in 2022: 1,014 Zip code population in 2010: 1,381 Zip code population in 2000: 1,411
Houses and condos: 483 Renter-occupied apartments: 8
% of renters here:
2%
State:
29%
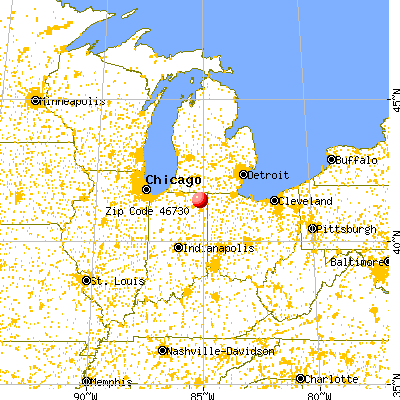
March 2022 cost of living index in zip code 46730: 86.0 (less than average, U.S. average is 100)
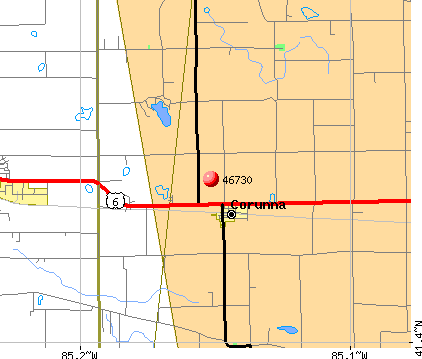
Land area: 28.0 sq. mi. Water area: 0.2 sq. mi.
Population density: 36 people per square mile
(very low).
OSM Map
General Map
Google Map
MSN Map
OSM Map
General Map
Google Map
MSN Map
OSM Map
General Map
Google Map
MSN Map
OSM Map
General Map
Google Map
MSN Map
Please wait while loading the map...
Real estate property taxes paid for housing units in 2022:
This zip code:
0.6% ($1,547)
Indiana:
0.7% ($1,467)
Median real estate property taxes paid for housing units with mortgages in 2022: $1,574 (0.5%) Median real estate property taxes paid for housing units with no mortgage in 2022: $1,532 (0.9%)
Business Search- 14 Million verified businesses
Males: 490
(48.4%)
Females: 523
(51.6%)
For population 25 years and over in 46730:
High school or higher: 97.5%
Bachelor's degree or higher: 23.8%
Graduate or professional degree: 5.8%
Unemployed: 0.3%
Mean travel time to work (commute): 36.9 minutes
For population 15 years and over in 46730:
Never married: 20.6%
Now married: 72.0%
Separated: 0.0%
Widowed: 3.2%
Divorced: 4.2%
Zip code 46730 compared to state average:
Unemployed percentage significantly below state average.
Black race population percentage significantly below state average.
Hispanic race population percentage significantly below state average.
Median age significantly above state average.
Foreign-born population percentage significantly below state average.
Renting percentage significantly below state average.
Length of stay since moving in significantly above state average.
Number of college students significantly below state average.
Estimated median house/condo value in 2022: $263,830
46730:
$263,830
Indiana:
$208,700
Median resident age:
This zip code:
49.1 years
Indiana median age:
38.2 years
Average household size:
This zip code:
2.4 people
Indiana:
2.4 people
Averages for the 2020 tax year for zip code 46730, filed in 2021:
Average Adjusted Gross Income (AGI) in 2020: $69,386 (Individual Income Tax Returns)
Here:
$69,386
State:
$64,978
Salary/wage: $54,865 (reported on 83.1% of returns)
Here:
$54,865
State:
$55,245
(% of AGI for various income ranges: 1164.7% for AGIs below $25k, 3102.3% for AGIs $25k-50k, 6171.2% for AGIs $50k-75k, 9188.3% for AGIs $75k-100k, 14331.7% for AGIs $100k-200k)
Taxable interest for individuals: $2,000 (reported on 32.3% of returns)
This zip code:
$2,000
Indiana:
$1,351
(% of AGI for various income ranges: 10.0% for AGIs below $25k, 10.8% for AGIs $25k-50k, 20.0% for AGIs $50k-75k, 15.0% for AGIs $75k-100k, 33.3% for AGIs $100k-200k)
Ordinary dividends: $3,775 (reported on 18.5% of returns)
Here:
$3,775
State:
$5,827
(% of AGI for various income ranges: 91.5% for AGIs $25k-50k, 46.7% for AGIs $75k-100k, 251.7% for AGIs $100k-200k)
Net capital gain/loss in AGI: +$26,900 (reported on 16.9% of returns)
Here:
+$26,900
State:
+$17,730
(% of AGI for various income ranges: 51.5% for AGIs $25k-50k, 145.0% for AGIs $75k-100k, 4675.0% for AGIs $100k-200k)
Profit/loss from business: +$8,300 (reported on 12.3% of returns)
Here:
+$8,300
State:
+$12,144
(% of AGI for various income ranges: 233.3% for AGIs below $25k, 271.2% for AGIs $50k-75k, 161.7% for AGIs $100k-200k)
Taxable individual retirement arrangement distribution: $18,233 (reported on 9.2% of returns)
46730:
$18,233
Indiana:
$18,302
(% of AGI for various income ranges: 348.5% for AGIs $25k-50k, 1068.3% for AGIs $75k-100k)
Total itemized deductions: $23,533 (reported on 4.6% of returns)
Here:
$23,533
State:
$35,601
(% of AGI for various income ranges: 1176.7% for AGIs $75k-100k)
Charity contributions: $10,600 (reported on 3.1% of returns)
Here:
$10,600
State:
$15,596
(% of AGI for various income ranges: 163.1% for AGIs $25k-50k)
Taxes paid: $6,933 (reported on 4.6% of returns)
46730:
$6,933
State:
$7,542
(% of AGI for various income ranges: 346.7% for AGIs $75k-100k)
Earned income credit: $2,262 (reported on 12.3% of returns)
Here:
$2,262
State:
$2,298
(% of AGI for various income ranges: 70.7% for AGIs below $25k, 57.7% for AGIs $25k-50k)
Percentage of individuals using paid preparers for their 2020 taxes: 96.9%
Here:
97%
State:
94%
(% for various income ranges: 95.0% for AGIs below $25k, 100.0% for AGIs $25k-50k, 100.0% for AGIs $50k-75k, 100.0% for AGIs $75k-100k, 88.9% for AGIs $100k-200k, 100.0% for AGIs over 200k)
Averages for the 2012 tax year for zip code 46730, filed in 2013:
Average Adjusted Gross Income (AGI) in 2012: $51,577 (Individual Income Tax Returns)
Here:
$51,577
State:
$52,932
Salary/wage: $45,081 (reported on 86.7% of returns)
Here:
$45,081
State:
$45,173
(% of AGI for various income ranges: 78.6% for AGIs below $25k, 79.2% for AGIs $25k-50k, 84.1% for AGIs $50k-75k, 90.4% for AGIs $75k-100k, 63.3% for AGIs $100k-200k)
Taxable interest for individuals: $890 (reported on 33.3% of returns)
This zip code:
$890
Indiana:
$1,311
(% of AGI for various income ranges: 1.9% for AGIs below $25k, 0.3% for AGIs $25k-50k, 0.5% for AGIs $50k-75k, 0.6% for AGIs $75k-100k, 0.4% for AGIs $100k-200k)
Ordinary dividends: $1,364 (reported on 18.3% of returns)
Here:
$1,364
State:
$4,690
(% of AGI for various income ranges: 2.2% for AGIs below $25k, 0.5% for AGIs $50k-75k, 0.5% for AGIs $100k-200k)
Net capital gain/loss in AGI: +$3,125 (reported on 13.3% of returns)
Here:
+$3,125
State:
+$10,406
(% of AGI for various income ranges: 2.3% for AGIs $100k-200k)
Profit/loss from business: +$3,860 (reported on 8.3% of returns)
Here:
+$3,860
State:
+$11,105
Taxable individual retirement arrangement distribution: $11,780 (reported on 8.3% of returns)
46730:
$11,780
Indiana:
$13,841
Total itemized deductions: $18,880 (18% of AGI, reported on 25.0% of returns)
Here:
$18,880
State:
$20,913
Here:
18.2% of AGI
State:
18.2% of AGI
(% of AGI for various income ranges: 8.6% for AGIs $25k-50k, 8.3% for AGIs $50k-75k, 9.6% for AGIs $75k-100k, 11.6% for AGIs $100k-200k)
Charity contributions: $3,855 (reported on 18.3% of returns)
Here:
$3,855
State:
$4,697
Taxes paid: $7,360 (reported on 25.0% of returns)
46730:
$7,360
State:
$7,456
(% of AGI for various income ranges: 2.0% for AGIs $25k-50k, 2.6% for AGIs $50k-75k, 3.3% for AGIs $75k-100k, 5.6% for AGIs $100k-200k)
Earned income credit: $2,500 (reported on 11.7% of returns)
Here:
$2,500
State:
$2,265
(% of AGI for various income ranges: 4.9% for AGIs below $25k, 1.0% for AGIs $25k-50k)
Percentage of individuals using paid preparers for their 2012 taxes: 60.0%
Here:
60%
State:
53%
(% for various income ranges: 56.5% for AGIs below $25k, 61.5% for AGIs $25k-50k, 54.5% for AGIs $50k-75k, 66.7% for AGIs $75k-100k, 71.4% for AGIs $100k-200k)
Averages for the 2004 tax year for zip code 46730, filed in 2005:
Average Adjusted Gross Income (AGI) in 2004: $39,850 (Individual Income Tax Returns)
Here:
$39,850
State:
$44,790
Salary/wage: $38,122 (reported on 90.7% of returns)
Here:
$38,122
State:
$39,615
(% of AGI for various income ranges: 144.2% for AGIs below $10k, 84.6% for AGIs $10k-25k, 84.1% for AGIs $25k-50k, 86.8% for AGIs $50k-75k, 85.8% for AGIs $75k-100k, 86.3% for AGIs over 100k)
Taxable interest for individuals: $876 (reported on 45.8% of returns)
This zip code:
$876
Indiana:
$1,535
(% of AGI for various income ranges: 10.1% for AGIs below $10k, 1.7% for AGIs $10k-25k, 0.9% for AGIs $25k-50k, 1.1% for AGIs $50k-75k, 0.4% for AGIs $75k-100k, 0.4% for AGIs over 100k)
Taxable dividends: $1,407 (reported on 19.4% of returns)
Here:
$1,407
State:
$2,998
(% of AGI for various income ranges: 3.8% for AGIs below $10k, 1.3% for AGIs $10k-25k, 0.2% for AGIs $25k-50k, 0.2% for AGIs $50k-75k, 1.4% for AGIs $75k-100k, 0.7% for AGIs over 100k)
Net capital gain/loss: +$1,278 (reported on 15.3% of returns)
Here:
+$1,278
State:
+$8,619
(% of AGI for various income ranges: -3.4% for AGIs below $10k, 0.3% for AGIs $10k-25k, 0.0% for AGIs $25k-50k, 0.1% for AGIs $50k-75k, 2.2% for AGIs $75k-100k)
Profit/loss from business: +$4,620 (reported on 11.2% of returns)
Here:
+$4,620
State:
+$10,071
(% of AGI for various income ranges: -0.3% for AGIs $10k-25k, 4.6% for AGIs $25k-50k, 0.4% for AGIs $50k-75k, 0.3% for AGIs $75k-100k)
Total itemized deductions: $14,985 (22% of AGI, reported on 31.0% of returns)
Here:
$14,985
State:
$17,065
Here:
22.0% of AGI
State:
19.5% of AGI
(% of AGI for various income ranges: 10.2% for AGIs $10k-25k, 9.3% for AGIs $25k-50k, 11.9% for AGIs $50k-75k, 12.8% for AGIs $75k-100k, 15.8% for AGIs over 100k)
Charity contributions deductions: $2,697 (4% of AGI, reported on 22.9% of returns)
Here:
$2,697
State:
$3,550
Here:
3.7% of AGI
State:
3.8% of AGI
(% of AGI for various income ranges: 4.8% for AGIs below $10k, 1.3% for AGIs $25k-50k, 1.2% for AGIs $50k-75k, 1.6% for AGIs $75k-100k, 3.0% for AGIs over 100k)
Total tax: $4,524 (reported on 76.9% of returns)
46730:
$4,524
State:
$6,914
(% of AGI for various income ranges: 2.7% for AGIs below $10k, 3.9% for AGIs $10k-25k, 6.5% for AGIs $25k-50k, 9.2% for AGIs $50k-75k, 9.7% for AGIs $75k-100k, 13.8% for AGIs over 100k)
Earned income credit: $1,485 (reported on 10.7% of returns)
Here:
$1,485
State:
$1,685
Percentage of individuals using paid preparers for their 2004 taxes: 60.7%
Here:
61%
State:
59%
(% for various income ranges: 57.0% for AGIs below $10k, 59.0% for AGIs $10k-25k, 62.2% for AGIs $25k-50k, 60.0% for AGIs $50k-75k, 66.7% for AGIs $75k-100k, 64.3% for AGIs over 100k)
Household received Food Stamps/SNAP in the past 12 months: 5 Household did not receive Food Stamps/SNAP in the past 12 months: 417
Women who did not have a birth in the past 12 months: 186 (118 now married, 68 unmarried)
Housing units in zip code 46730 with a mortgage: 275 (54 second mortgage, 55 both second mortgage and home equity loan) Median monthly owner costs for units with a mortgage: $1,313 Median monthly owner costs for units without a mortgage: $607
Residents with income below the poverty level in 2022:
This zip code:
2.1%
Whole state:
12.6%
Residents with income below 50% of the poverty level in 2022:
This zip code:
1.1%
Whole state:
6.3%
Median number of rooms in houses and condos:
Here:
7.5
State:
6.6
Median number of rooms in apartments:
Here:
5.2
State:
4.3
Notable locations in this zip code not listed on our city pages
In group quarters: 4 (-1 institutionalized population)
Size of family households: 210 2-persons, 64 3-persons, 58 5-persons
Size of nonfamily households: 40 1-person, 50 2-persons
179 married couples with children.
0 single-parent households ().
98.6% of residents of 46730 zip code speak English at home.
0.1% of residents speak Spanish at home (100% very well).
2.0% of residents speak other language at home (100% very well).
Foreign born population: 9 (0.9%) (100.0% of them are naturalized citizens)
This zip code:
0.9%
Whole state:
6.1%
39%German
32%American
15%English
3%Irish
2%Polish
2%Italian
1%Dutch
Year of entry for the foreign-born population
02010 or later
02000 to 2009
01990 to 1999
21Before 1990
Facilities with environmental interests located in this zip code:
CORUNNA MUNICIPAL WWTP (102 N BRIDGE ST in CORUNNA, IN)
STATE MASTER (Indiana facility tracking) National Pollutant Discharge Elimination System NON-MAJOR (Tracking pollutant discharge elimination systems) - permit Business SIC classification: SEWERAGE SYSTEMS Organizations: PAUL WARFIELD 15314 042004 (CONTACT/OPERATOR)
, CORUNNA MUNICIPAL STP (CONTACT/OWNER)
Alternative names: CORUNNA MUNICIPAL STP
Housing units lacking complete plumbing facilities: 9.0% Housing units lacking complete kitchen facilities: 4.6%
51.1%Bottled, tank, or LP gas
25.0%Electricity
10.5%Utility gas
7.1%Fuel oil, kerosene, etc.
7.1%Wood
Population in 1990: 2,373.
Place of birth for U.S.-born residents:
This state: 831
Northeast: 13
Midwest: 77
South: 31
West: 33
65% of the 46730 zip code residents lived in the same house 5 years ago. Out of people who lived in different houses, 46% lived in this county. Out of people who lived in different counties, 50% lived in Indiana.
99% of the 46730 zip code residents lived in the same house 1 year ago. Out of people who lived in different houses, 117% moved from different county within same state. Out of people who lived in different houses, 17% moved from different state.
Private vs. public school enrollment:
Students in private schools in grades 1 to 8 (elementary and middle school):
Here:
0.0%
Indiana:
14.9%
Students in private schools in grades 9 to 12 (high school): 5
Here:
16.5%
Indiana:
11.4%
Students in private undergraduate colleges:
Here:
0.0%
Indiana:
22.3%
Occupation by median earnings in the past 12 months ($)
158,918Transportation occupations
84,500Production occupations
73,717Health diagnosing and treating practitioners and other technical occupations
64,311Health technologists and technicians
62,246Business and financial operations occupations
60,937Architecture and engineering occupations
Top industries in this zip code by the number of employees in 2005:
Home Mortgage Disclosure Act Aggregated Statistics For Year 2003 (Based on 4 partial tracts)
A) FHA, FSA/RHS & VA Home Purchase Loans
B) Conventional Home Purchase Loans
C) Refinancings
D) Home Improvement Loans
F) Non-occupant Loans on < 5 Family Dwellings (A B C & D)
Number
Average Value
Number
Average Value
Number
Average Value
Number
Average Value
Number
Average Value
LOANS ORIGINATED
6
$78,443
43
$107,284
221
$96,540
10
$41,904
12
$62,295
APPLICATIONS APPROVED, NOT ACCEPTED
1
$68,460
3
$91,200
20
$92,324
1
$25,960
3
$57,120
APPLICATIONS DENIED
1
$119,190
13
$59,510
73
$89,821
9
$27,806
2
$69,640
APPLICATIONS WITHDRAWN
0
$0
2
$72,080
48
$84,801
0
$0
1
$26,960
FILES CLOSED FOR INCOMPLETENESS
0
$0
2
$55,410
6
$103,357
1
$204,980
1
$44,850
Detailed HMDA statistics for the following Tracts:0201.00
, 0202.00
Private Mortgage Insurance Companies Aggregated Statistics For Year 2003 (Based on 4 partial tracts)
A) Conventional Home Purchase Loans
B) Refinancings
C) Non-occupant Loans on < 5 Family Dwellings (A & B)
Number
Average Value
Number
Average Value
Number
Average Value
LOANS ORIGINATED
9
$99,196
19
$106,958
0
$0
APPLICATIONS APPROVED, NOT ACCEPTED
2
$82,535
4
$112,495
0
$0
APPLICATIONS DENIED
0
$0
0
$0
0
$0
APPLICATIONS WITHDRAWN
0
$0
2
$114,295
1
$35,740
FILES CLOSED FOR INCOMPLETENESS
0
$0
0
$0
0
$0
Detailed PMIC statistics for the following Tracts:0201.00
, 0202.00
2003 - 2018 National Fire Incident Reporting System (NFIRS) incidents
Based on the data from the years 2003 - 2018 the average number of fires per year is 12. The highest number of reported fire incidents - 30 took place in 2005, and the least - 0 in 2014. The data has a declining trend.
When looking into fire subcategories, the most reports belonged to: Outside Fires (53.0%), and Structure Fires (29.5%).
Fire incident types reported to NFIRS in Zip Code 46730


 Nearest zip codes: 46747, 46705, 46755, 46793, 46738, 46786.


 Based on the data from the years 2003 - 2018 the average number of fires per year is 12. The highest number of reported fire incidents - 30 took place in 2005, and the least - 0 in 2014. The data has a declining trend.
 When looking into fire subcategories, the most reports belonged to: Outside Fires (53.0%), and Structure Fires (29.5%).