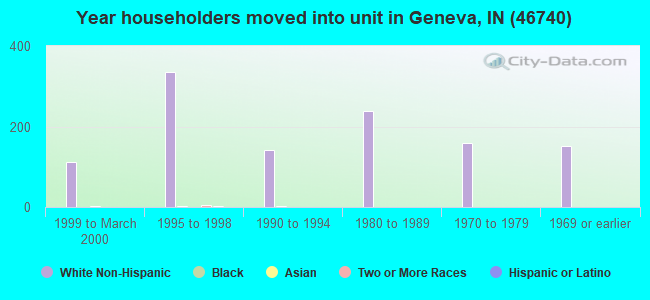
Estimated zip code population in 2022: 4,618 Zip code population in 2010: 4,060 Zip code population in 2000: 3,708
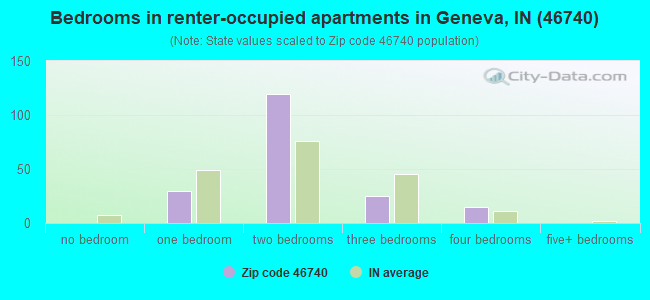
Houses and condos: 1,368 Renter-occupied apartments: 188
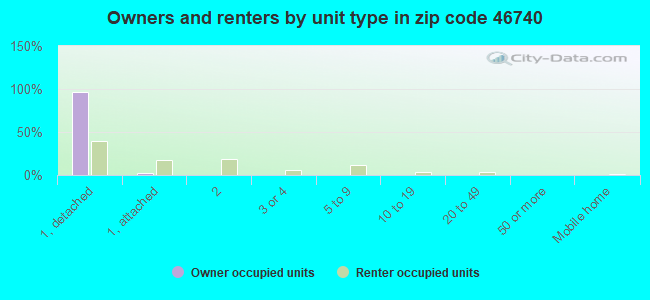
% of renters here:
15%
State:
29%
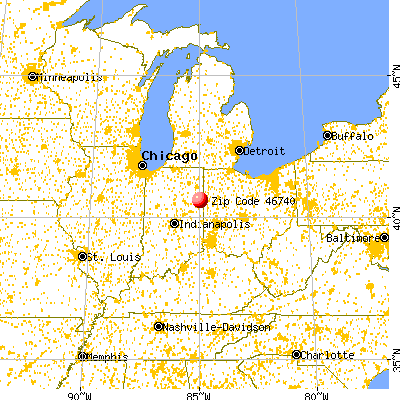
March 2022 cost of living index in zip code 46740: 85.0 (less than average, U.S. average is 100)
Land area: 61.6 sq. mi. Water area: 0.5 sq. mi.
Population density: 75 people per square mile
(very low).
OSM Map
General Map
Google Map
MSN Map
OSM Map
General Map
Google Map
MSN Map
OSM Map
General Map
Google Map
MSN Map
OSM Map
General Map
Google Map
MSN Map
Please wait while loading the map...
Real estate property taxes paid for housing units in 2022:
This zip code:
0.7% ($1,403)
Indiana:
0.7% ($1,467)
Median real estate property taxes paid for housing units with mortgages in 2022: $1,621 (0.7%) Median real estate property taxes paid for housing units with no mortgage in 2022: $833 (0.7%)
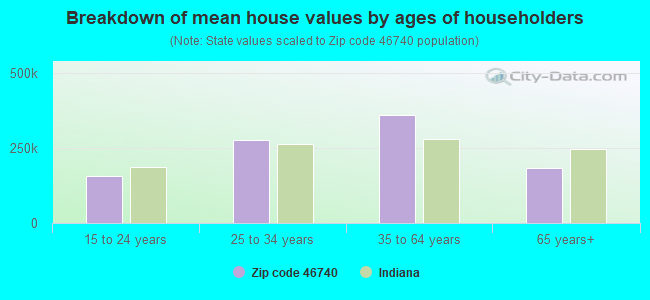
Estimated median house/condo value in 2022: $188,580
46740:
$188,580
Indiana:
$208,700
Median resident age:
This zip code:
22.9 years
Indiana median age:
38.2 years
Average household size:
This zip code:
3.6 people
Indiana:
2.4 people
Averages for the 2020 tax year for zip code 46740, filed in 2021:
Average Adjusted Gross Income (AGI) in 2020: $48,315 (Individual Income Tax Returns)
Here:
$48,315
State:
$64,978
Salary/wage: $39,380 (reported on 59.2% of returns)
Here:
$39,380
State:
$55,245
(% of AGI for various income ranges: 1149.6% for AGIs below $25k, 3926.1% for AGIs $25k-50k, 6881.8% for AGIs $50k-75k, 9936.2% for AGIs $75k-100k, 15333.3% for AGIs $100k-200k)
Taxable interest for individuals: $2,116 (reported on 23.6% of returns)
This zip code:
$2,116
Indiana:
$1,351
(% of AGI for various income ranges: 38.4% for AGIs below $25k, 25.7% for AGIs $25k-50k, 59.1% for AGIs $50k-75k, 85.0% for AGIs $75k-100k, 545.0% for AGIs $100k-200k)
Ordinary dividends: $3,775 (reported on 10.2% of returns)
Here:
$3,775
State:
$5,827
(% of AGI for various income ranges: 21.6% for AGIs below $25k, 8.7% for AGIs $25k-50k, 22.7% for AGIs $50k-75k, 98.8% for AGIs $75k-100k, 710.0% for AGIs $100k-200k)
Net capital gain/loss in AGI: +$19,400 (reported on 9.6% of returns)
Here:
+$19,400
State:
+$17,730
(% of AGI for various income ranges: 4.4% for AGIs below $25k, 22.6% for AGIs $25k-50k, 146.4% for AGIs $50k-75k, 285.0% for AGIs $75k-100k, 4096.7% for AGIs $100k-200k)
Profit/loss from business: +$29,443 (reported on 36.9% of returns)
Here:
+$29,443
State:
+$12,144
(% of AGI for various income ranges: 1013.6% for AGIs below $25k, 2927.8% for AGIs $25k-50k, 3215.5% for AGIs $50k-75k, 2445.0% for AGIs $75k-100k, 3860.0% for AGIs $100k-200k)
Taxable individual retirement arrangement distribution: $13,469 (reported on 8.3% of returns)
46740:
$13,469
Indiana:
$18,302
(% of AGI for various income ranges: 86.0% for AGIs below $25k, 220.4% for AGIs $25k-50k, 1286.2% for AGIs $75k-100k)
Total itemized deductions: $44,175 (reported on 2.5% of returns)
Here:
$44,175
State:
$35,601
(% of AGI for various income ranges: 2945.0% for AGIs $100k-200k)
Charity contributions: $19,267 (reported on 1.9% of returns)
Here:
$19,267
State:
$15,596
(% of AGI for various income ranges: 963.3% for AGIs $100k-200k)
Taxes paid: $7,025 (reported on 2.5% of returns)
46740:
$7,025
State:
$7,542
(% of AGI for various income ranges: 468.3% for AGIs $100k-200k)
Earned income credit: $2,033 (reported on 11.5% of returns)
Here:
$2,033
State:
$2,298
(% of AGI for various income ranges: 70.8% for AGIs below $25k, 82.2% for AGIs $25k-50k)
Percentage of individuals using paid preparers for their 2020 taxes: 90.4%
Here:
90%
State:
94%
(% for various income ranges: 89.5% for AGIs below $25k, 90.2% for AGIs $25k-50k, 90.9% for AGIs $50k-75k, 92.9% for AGIs $75k-100k, 90.9% for AGIs $100k-200k, 100.0% for AGIs over 200k)
Averages for the 2012 tax year for zip code 46740, filed in 2013:
Average Adjusted Gross Income (AGI) in 2012: $37,694 (Individual Income Tax Returns)
Here:
$37,694
State:
$52,932
Salary/wage: $34,775 (reported on 61.8% of returns)
Here:
$34,775
State:
$45,173
(% of AGI for various income ranges: 42.0% for AGIs below $25k, 64.5% for AGIs $25k-50k, 73.5% for AGIs $50k-75k, 64.4% for AGIs $75k-100k, 36.4% for AGIs $100k-200k)
Taxable interest for individuals: $1,145 (reported on 26.4% of returns)
This zip code:
$1,145
Indiana:
$1,311
(% of AGI for various income ranges: 1.2% for AGIs below $25k, 0.6% for AGIs $25k-50k, 0.8% for AGIs $50k-75k, 0.6% for AGIs $75k-100k, 0.9% for AGIs $100k-200k)
Ordinary dividends: $1,650 (reported on 12.5% of returns)
Here:
$1,650
State:
$4,690
(% of AGI for various income ranges: 1.0% for AGIs below $25k, 0.4% for AGIs $25k-50k, 0.2% for AGIs $50k-75k, 0.1% for AGIs $75k-100k, 0.9% for AGIs $100k-200k)
Net capital gain/loss in AGI: +$2,940 (reported on 10.4% of returns)
Here:
+$2,940
State:
+$10,406
(% of AGI for various income ranges: 0.1% for AGIs below $25k, 2.0% for AGIs $50k-75k, 1.8% for AGIs $100k-200k)
Profit/loss from business: +$17,825 (reported on 30.6% of returns)
Here:
+$17,825
State:
+$11,105
(% of AGI for various income ranges: 37.8% for AGIs below $25k, 17.1% for AGIs $25k-50k, 14.1% for AGIs $50k-75k, 3.0% for AGIs $100k-200k)
Taxable individual retirement arrangement distribution: $6,967 (reported on 10.4% of returns)
46740:
$6,967
Indiana:
$13,841
(% of AGI for various income ranges: 3.0% for AGIs below $25k, 1.4% for AGIs $25k-50k, 2.2% for AGIs $50k-75k, 4.4% for AGIs $75k-100k)
Total itemized deductions: $18,906 (22% of AGI, reported on 12.5% of returns)
Here:
$18,906
State:
$20,913
Here:
21.8% of AGI
State:
18.2% of AGI
(% of AGI for various income ranges: 5.8% for AGIs below $25k, 4.2% for AGIs $25k-50k, 4.7% for AGIs $50k-75k, 7.7% for AGIs $75k-100k, 10.2% for AGIs $100k-200k)
Charity contributions: $5,267 (reported on 8.3% of returns)
Here:
$5,267
State:
$4,697
(% of AGI for various income ranges: 0.6% for AGIs $25k-50k, 0.6% for AGIs $50k-75k, 1.6% for AGIs $75k-100k, 3.1% for AGIs $100k-200k)
Taxes paid: $5,333 (reported on 12.5% of returns)
46740:
$5,333
State:
$7,456
(% of AGI for various income ranges: 0.5% for AGIs below $25k, 0.7% for AGIs $25k-50k, 1.1% for AGIs $50k-75k, 2.6% for AGIs $75k-100k, 4.2% for AGIs $100k-200k)
Earned income credit: $2,167 (reported on 16.7% of returns)
Here:
$2,167
State:
$2,265
(% of AGI for various income ranges: 4.3% for AGIs below $25k, 1.0% for AGIs $25k-50k)
Percentage of individuals using paid preparers for their 2012 taxes: 75.7%
Here:
76%
State:
53%
(% for various income ranges: 76.1% for AGIs below $25k, 74.4% for AGIs $25k-50k, 75.0% for AGIs $50k-75k, 75.0% for AGIs $75k-100k, 83.3% for AGIs $100k-200k)
Averages for the 2004 tax year for zip code 46740, filed in 2005:
Average Adjusted Gross Income (AGI) in 2004: $31,264 (Individual Income Tax Returns)
Here:
$31,264
State:
$44,790
Salary/wage: $31,199 (reported on 69.0% of returns)
Here:
$31,199
State:
$39,615
(% of AGI for various income ranges: 72.4% for AGIs below $10k, 52.1% for AGIs $10k-25k, 72.3% for AGIs $25k-50k, 81.2% for AGIs $50k-75k, 70.6% for AGIs $75k-100k, 54.0% for AGIs over 100k)
Taxable interest for individuals: $1,462 (reported on 40.9% of returns)
This zip code:
$1,462
Indiana:
$1,535
(% of AGI for various income ranges: 9.4% for AGIs below $10k, 2.0% for AGIs $10k-25k, 1.9% for AGIs $25k-50k, 2.2% for AGIs $50k-75k, 1.1% for AGIs $75k-100k, 0.3% for AGIs over 100k)
Taxable dividends: $1,364 (reported on 13.7% of returns)
Here:
$1,364
State:
$2,998
(% of AGI for various income ranges: 2.8% for AGIs below $10k, 0.7% for AGIs $10k-25k, 0.5% for AGIs $25k-50k, 0.2% for AGIs $50k-75k, 0.7% for AGIs $75k-100k, 1.0% for AGIs over 100k)
Net capital gain/loss: +$3,110 (reported on 11.6% of returns)
Here:
+$3,110
State:
+$8,619
(% of AGI for various income ranges: -0.8% for AGIs below $10k, 1.0% for AGIs $10k-25k, 0.4% for AGIs $25k-50k, 1.7% for AGIs $50k-75k, 2.6% for AGIs $75k-100k, 1.3% for AGIs over 100k)
Profit/loss from business: +$15,231 (reported on 30.2% of returns)
Here:
+$15,231
State:
+$10,071
(% of AGI for various income ranges: 46.4% for AGIs below $10k, 36.0% for AGIs $10k-25k, 14.6% for AGIs $25k-50k, 5.4% for AGIs $50k-75k, 11.0% for AGIs $75k-100k, 2.1% for AGIs over 100k)
IRA payment deduction: $2,786 (reported on 1.0% of returns)
46740:
$2,786
Indiana:
$2,840
Total itemized deductions: $15,296 (23% of AGI, reported on 14.3% of returns)
Here:
$15,296
State:
$17,065
Here:
23.4% of AGI
State:
19.5% of AGI
(% of AGI for various income ranges: 7.0% for AGIs $10k-25k, 5.1% for AGIs $25k-50k, 6.7% for AGIs $50k-75k, 7.8% for AGIs $75k-100k, 13.7% for AGIs over 100k)
Charity contributions deductions: $4,614 (6% of AGI, reported on 10.2% of returns)
Here:
$4,614
State:
$3,550
Here:
6.2% of AGI
State:
3.8% of AGI
(% of AGI for various income ranges: 0.7% for AGIs $10k-25k, 0.7% for AGIs $25k-50k, 1.5% for AGIs $50k-75k, 2.1% for AGIs $75k-100k, 4.5% for AGIs over 100k)
Total tax: $3,929 (reported on 61.5% of returns)
46740:
$3,929
State:
$6,914
(% of AGI for various income ranges: 1.9% for AGIs below $10k, 3.2% for AGIs $10k-25k, 5.8% for AGIs $25k-50k, 7.9% for AGIs $50k-75k, 11.0% for AGIs $75k-100k, 17.1% for AGIs over 100k)
Earned income credit: $1,581 (reported on 12.6% of returns)
Here:
$1,581
State:
$1,685
Percentage of individuals using paid preparers for their 2004 taxes: 78.4%
Here:
78%
State:
59%
(% for various income ranges: 69.0% for AGIs below $10k, 81.8% for AGIs $10k-25k, 80.1% for AGIs $25k-50k, 82.9% for AGIs $50k-75k, 76.4% for AGIs $75k-100k, 82.9% for AGIs over 100k)
Household received Food Stamps/SNAP in the past 12 months: 72 Household did not receive Food Stamps/SNAP in the past 12 months: 1,199
Women who had a birth in the past 12 months: 81 (75 now married, 9 unmarried) Women who did not have a birth in the past 12 months: 638 (324 now married, 314 unmarried)
Housing units in zip code 46740 with a mortgage: 636 (208 second mortgage, 206 both second mortgage and home equity loan) Houses without a mortgage: 44
Median monthly owner costs for units with a mortgage: $1,125 Median monthly owner costs for units without a mortgage: $425
Residents with income below the poverty level in 2022:
This zip code:
13.9%
Whole state:
12.6%
Residents with income below 50% of the poverty level in 2022:
This zip code:
3.6%
Whole state:
6.3%
Median number of rooms in houses and condos:
Here:
7.0
State:
6.6
Median number of rooms in apartments:
Here:
4.2
State:
4.3
Notable locations in this zip code not listed on our city pages
In group quarters: 70 (-1 institutionalized population)
Size of family households: 406 2-persons, 170 3-persons, 126 4-persons, 72 5-persons, 6 6-persons, 250 7-or-more-persons
Size of nonfamily households: 220 1-person, 24 2-persons
1,663 married couples with children.
224 single-parent households (119 men, 105 women).
53.1% of residents of 46740 zip code speak English at home.
3.2% of residents speak Spanish at home (35% very well, 4% well, 58% not well, 3% not at all).
52.4% of residents speak other Indo-European language at home (42% very well, 51% well, 7% not well).
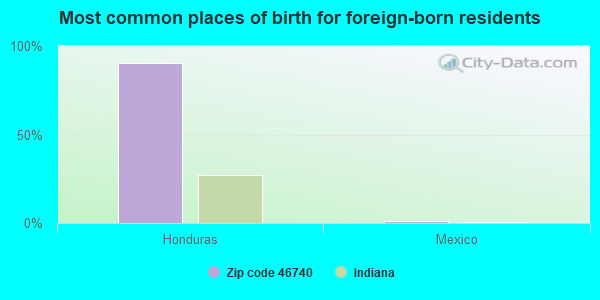
Foreign born population: 95 (2.1%) (15.4% of them are naturalized citizens)
This zip code:
2.1%
Whole state:
6.1%
91%Honduras
1%Mexico
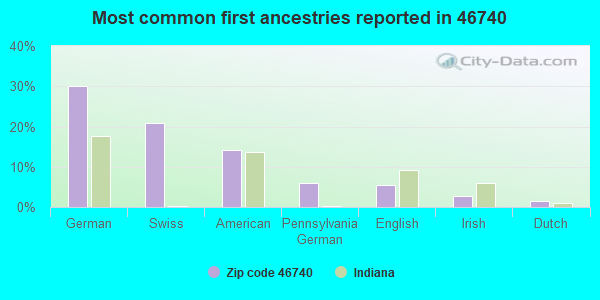
30%German
21%Swiss
14%American
6%Pennsylvania German
5%English
3%Irish
1%Dutch
Year of entry for the foreign-born population
872010 or later
142000 to 2009
01990 to 1999
3Before 1990
Facilities with environmental interests located in this zip code:
RED GOLD GENEVA (705 WILLIAMS ST in GENEVA, IN)
AIR MINOR (AIRS/AFS) STATE MASTER (Indiana facility tracking) - ACES-OP-00100038, AIR PROGRAM, CRTK-3038, EPCRA, UST-6297, UNDERGROUND STORAGE TANK PROGRAM National Pollutant Discharge Elimination System NON-MAJOR (Tracking pollutant discharge elimination systems) - permit Business SIC classification: CANNED FRUITS, VEGETABLES, PRESERVES, JAMS, AND JELLIES Organizations: ED HANKES (CONTACT/OPERATOR)
, MR BRIAN REICHART (CONTACT/OWNER)
Alternative names: TOMATO PRODUCTS, INC., TOMATO PRODUCTS, INC. GENEVA
AMISHVILLE USA INC (844 E. 900 S. in GENEVA, IN)
STATE MASTER (Indiana facility tracking) National Pollutant Discharge Elimination System NON-MAJOR (Tracking pollutant discharge elimination systems) - permit Business SIC classification: AMUSEMENT AND RECREATION SERVICES Organizations: WILLIAM BROCK OWNER (CONTACT/OPERATOR)
Alternative names: AMISHVILLE, U.S.A., AMISHVILLE USA, INC. WWTP
CDM INC (710 US 27 N in GENEVA, IN)
STATE MASTER (Indiana facility tracking) Conditionally Exempt Small Quantity Generators, less than 100 kg/month of hazardous waste (Resource Conservation and Recovery Act (tracking hazardous waste)) - notification Organizations: BICKEL WAYNE J AND PHYLLIS A (CONTACT/OWNER)
Housing units lacking complete plumbing facilities: 22.9% Housing units lacking complete kitchen facilities: 25.2%
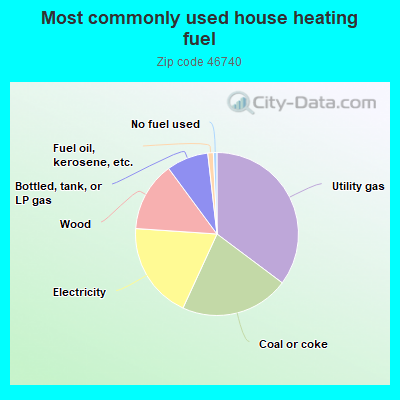
35.2%Utility gas
21.6%Coal or coke
19.2%Electricity
13.8%Wood
8.3%Bottled, tank, or LP gas
1.1%Fuel oil, kerosene, etc.
0.7%No fuel used
Population in 1990: 3,676. Population change in the 1990s: +32 (+0.9%).
Place of birth for U.S.-born residents:
This state: 4,010
Northeast: 24
Midwest: 351
South: 98
West: 8
63% of the 46740 zip code residents lived in the same house 5 years ago. Out of people who lived in different houses, 72% lived in this county. Out of people who lived in different counties, 50% lived in Indiana.
95% of the 46740 zip code residents lived in the same house 1 year ago. Out of people who lived in different houses, 54% moved from this county. Out of people who lived in different houses, 18% moved from different county within same state. Out of people who lived in different houses, 36% moved from different state.
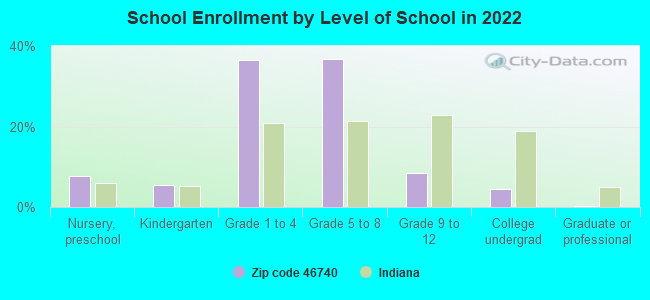
Private vs. public school enrollment:
Students in private schools in grades 1 to 8 (elementary and middle school): 356
Here:
33.1%
Indiana:
14.9%
Students in private schools in grades 9 to 12 (high school): 6
Here:
5.0%
Indiana:
11.4%
Students in private undergraduate colleges: 33
Here:
49.7%
Indiana:
22.3%
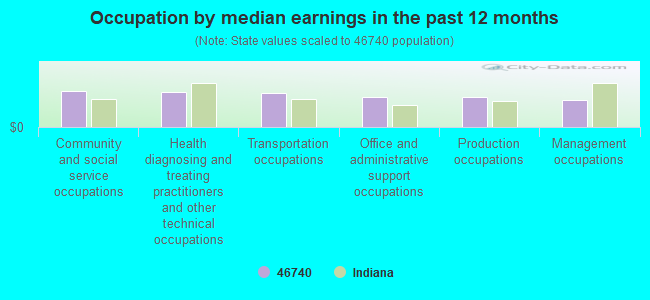
Occupation by median earnings in the past 12 months ($)
51,666Community and social service occupations
50,750Health diagnosing and treating practitioners and other technical occupations
48,204Transportation occupations
43,256Office and administrative support occupations
43,140Production occupations
38,663Management occupations
Companies with federal contracts located in this zip code:
C D M, INC (710 N MAIN ST in GENEVA, IN; small business)
$21,700 with Navy for Bars and Rods. Signed on 2006-05-08. Completion date: 2006-06-13.
Top industries in this zip code by the number of employees in 2005:
Finance and Insurance: Commercial Banking (20-49 employees: 1 establishment)
Construction: Commercial and Institutional Building Construction (10-19: 2)
Accommodation and Food Services: Full-Service Restaurants (10-19: 1, 5-9: 1)
Other Services (except Public Administration): Religious Organizations (5-9: 1, 1-4: 1)
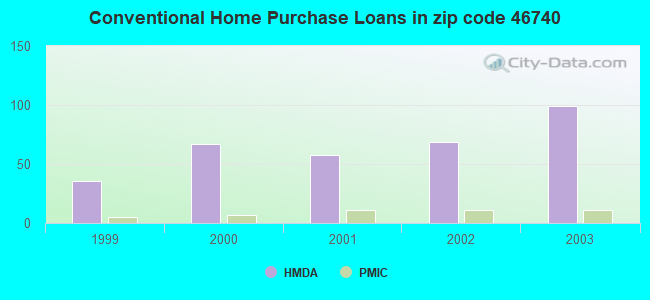
Home Mortgage Disclosure Act Aggregated Statistics For Year 2003 (Based on 2 partial tracts)
A) FHA, FSA/RHS & VA Home Purchase Loans
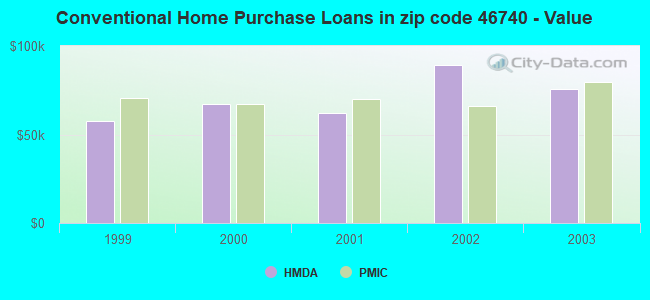
B) Conventional Home Purchase Loans
C) Refinancings
D) Home Improvement Loans
F) Non-occupant Loans on < 5 Family Dwellings (A B C & D)
Number
Average Value
Number
Average Value
Number
Average Value
Number
Average Value
Number
Average Value
LOANS ORIGINATED
1
$51,390
99
$75,727
244
$75,142
25
$35,159
12
$54,798
APPLICATIONS APPROVED, NOT ACCEPTED
3
$79,947
7
$92,057
16
$63,666
1
$14,500
0
$0
APPLICATIONS DENIED
0
$0
13
$74,608
65
$68,444
13
$23,214
0
$0
APPLICATIONS WITHDRAWN
0
$0
5
$117,548
42
$90,646
0
$0
1
$44,810
FILES CLOSED FOR INCOMPLETENESS
1
$57,980
3
$25,037
8
$120,744
1
$59,300
0
$0
Aggregated Statistics For Year 2002 (Based on 2 partial tracts)
A) FHA, FSA/RHS & VA Home Purchase Loans
B) Conventional Home Purchase Loans
C) Refinancings
D) Home Improvement Loans
E) Loans on Dwellings For 5+ Families
F) Non-occupant Loans on < 5 Family Dwellings (A B C & D)
Number
Average Value
Number
Average Value
Number
Average Value
Number
Average Value
Number
Average Value
Number
Average Value
LOANS ORIGINATED
5
$73,270
69
$89,439
208
$75,381
8
$19,602
3
$128,267
11
$76,313
APPLICATIONS APPROVED, NOT ACCEPTED
0
$0
3
$80,827
20
$67,866
3
$10,983
0
$0
0
$0
APPLICATIONS DENIED
3
$47,000
12
$105,204
55
$60,715
17
$10,232
0
$0
4
$8,565
APPLICATIONS WITHDRAWN
0
$0
3
$86,097
34
$71,781
1
$39,530
0
$0
1
$97,520
FILES CLOSED FOR INCOMPLETENESS
0
$0
4
$129,145
11
$82,542
0
$0
0
$0
0
$0
Aggregated Statistics For Year 2001 (Based on 2 partial tracts)
A) FHA, FSA/RHS & VA Home Purchase Loans
B) Conventional Home Purchase Loans
C) Refinancings
D) Home Improvement Loans
F) Non-occupant Loans on < 5 Family Dwellings (A B C & D)
Number
Average Value
Number
Average Value
Number
Average Value
Number
Average Value
Number
Average Value
LOANS ORIGINATED
3
$52,273
58
$61,914
194
$76,154
13
$8,718
9
$44,073
APPLICATIONS APPROVED, NOT ACCEPTED
0
$0
8
$58,148
14
$76,526
7
$5,836
0
$0
APPLICATIONS DENIED
0
$0
16
$58,889
40
$60,652
11
$7,667
1
$65,890
APPLICATIONS WITHDRAWN
0
$0
1
$51,390
17
$99,222
1
$13,180
1
$51,390
FILES CLOSED FOR INCOMPLETENESS
0
$0
0
$0
5
$85,394
0
$0
0
$0
Aggregated Statistics For Year 2000 (Based on 2 partial tracts)
A) FHA, FSA/RHS & VA Home Purchase Loans
B) Conventional Home Purchase Loans
C) Refinancings
D) Home Improvement Loans
F) Non-occupant Loans on < 5 Family Dwellings (A B C & D)
Number
Average Value
Number
Average Value
Number
Average Value
Number
Average Value
Number
Average Value
LOANS ORIGINATED
4
$62,925
67
$67,385
67
$60,737
28
$15,155
14
$29,933
APPLICATIONS APPROVED, NOT ACCEPTED
0
$0
5
$162,090
9
$55,640
8
$17,296
0
$0
APPLICATIONS DENIED
3
$65,010
11
$60,738
37
$58,339
11
$12,699
0
$0
APPLICATIONS WITHDRAWN
1
$80,390
1
$31,630
29
$52,030
0
$0
1
$51,390
FILES CLOSED FOR INCOMPLETENESS
0
$0
0
$0
1
$177,900
0
$0
0
$0
Aggregated Statistics For Year 1999 (Based on 1 partial tract)
A) FHA, FSA/RHS & VA Home Purchase Loans
B) Conventional Home Purchase Loans
C) Refinancings
D) Home Improvement Loans
F) Non-occupant Loans on < 5 Family Dwellings (A B C & D)
Detailed PMIC statistics for the following Tracts:0307.00
2002 - 2018 National Fire Incident Reporting System (NFIRS) incidents
Based on the data from the years 2002 - 2018 the average number of fires per year is 11. The highest number of reported fire incidents - 21 took place in 2008, and the least - 3 in 2014. The data has a rising trend.
When looking into fire subcategories, the most reports belonged to: Structure Fires (59.1%), and Outside Fires (19.4%).
Fire incident types reported to NFIRS in Zip Code 46740


 Nearest zip codes: 47326, 46711, 46772, 47371, 47369, 46759.


 Based on the data from the years 2002 - 2018 the average number of fires per year is 11. The highest number of reported fire incidents - 21 took place in 2008, and the least - 3 in 2014. The data has a rising trend.
 When looking into fire subcategories, the most reports belonged to: Structure Fires (59.1%), and Outside Fires (19.4%).