Estimated zip code population in 2022: 4,482 Zip code population in 2010: 4,036 Zip code population in 2000: 4,106
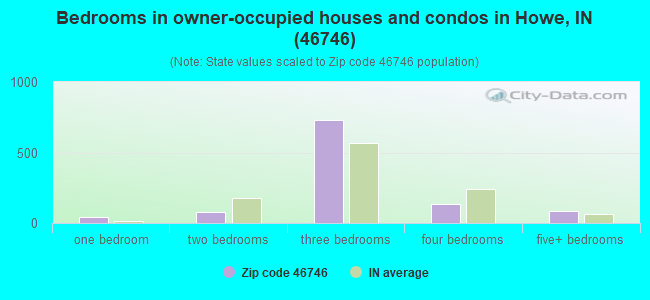
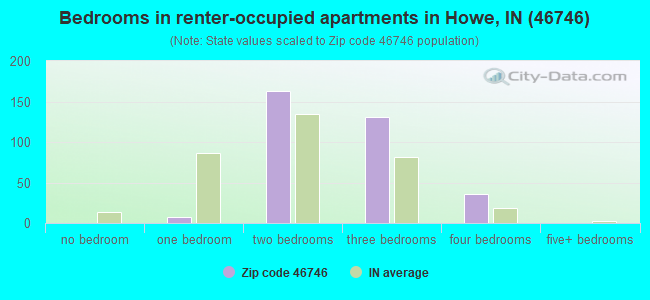
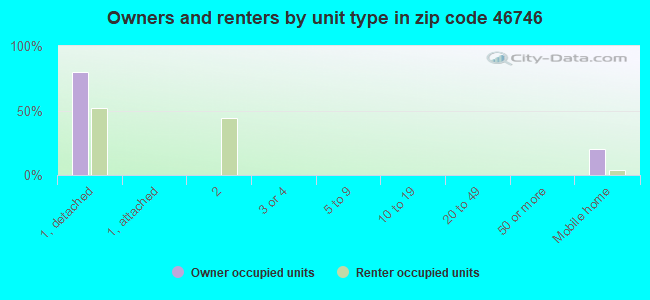
Houses and condos: 1,626 Renter-occupied apartments: 340
% of renters here:
24%
State:
29%
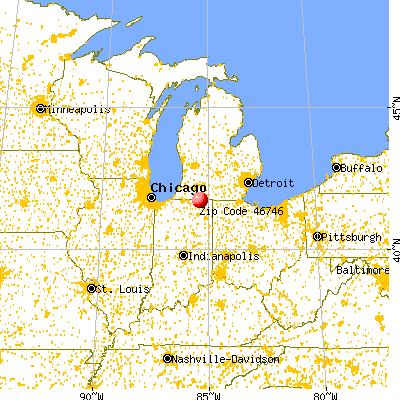
March 2022 cost of living index in zip code 46746: 85.1 (less than average, U.S. average is 100)
Land area: 73.6 sq. mi. Water area: 0.9 sq. mi.
Population density: 61 people per square mile
(very low).
OSM Map
General Map
Google Map
MSN Map
OSM Map
General Map
Google Map
MSN Map
OSM Map
General Map
Google Map
MSN Map
OSM Map
General Map
Google Map
MSN Map
Please wait while loading the map...
Real estate property taxes paid for housing units in 2022:
This zip code:
0.3% ($602)
Indiana:
0.7% ($1,467)
Median real estate property taxes paid for housing units with mortgages in 2022: $515 (0.3%) Median real estate property taxes paid for housing units with no mortgage in 2022: $770 (0.5%)
Business Search- 14 Million verified businesses
Males: 2,231
(49.8%)
Females: 2,251
(50.2%)
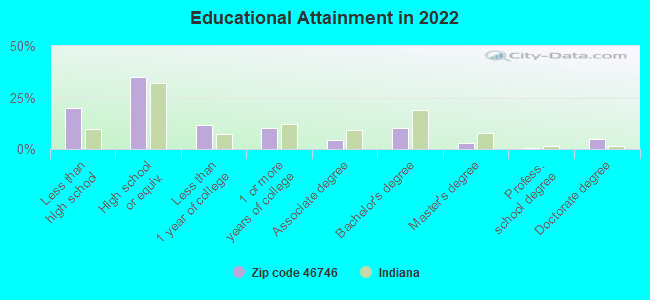
For population 25 years and over in 46746:
High school or higher: 78.6%
Bachelor's degree or higher: 18.6%
Graduate or professional degree: 8.4%
Unemployed: 4.0%
Mean travel time to work (commute): 23.3 minutes
For population 15 years and over in 46746:
Never married: 34.1%
Now married: 48.0%
Separated: 2.8%
Widowed: 3.4%
Divorced: 11.7%
Zip code 46746 compared to state average:
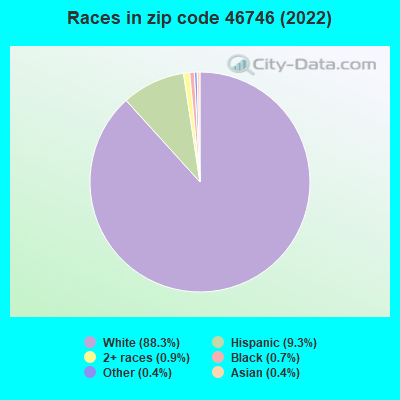
Black race population percentage significantly below state average.
Median age below state average.
Length of stay since moving in significantly below state average.
Percentage of population with a bachelor's degree or higher below state average.
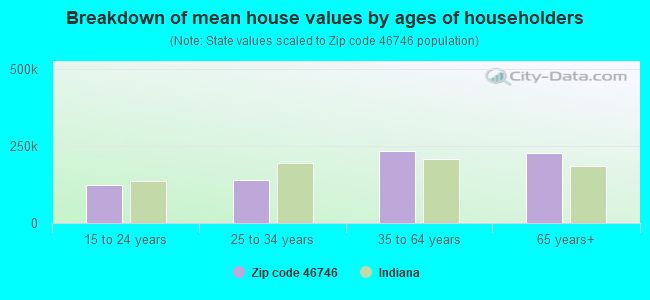
Estimated median house/condo value in 2022: $180,055
46746:
$180,055
Indiana:
$208,700
According to our research of Indiana and other state lists, there was 1 registered sex offender living in 46746 zip code as of May 28, 2024. The ratio of all residents to sex offenders in zip code 46746 is 4,324 to 1. The ratio of registered sex offenders to all residents in this zip code is much lower than the state average.
Median resident age:
This zip code:
32.1 years
Indiana median age:
38.2 years
Average household size:
This zip code:
3.1 people
Indiana:
2.4 people
Averages for the 2020 tax year for zip code 46746, filed in 2021:
Average Adjusted Gross Income (AGI) in 2020: $55,402 (Individual Income Tax Returns)
Here:
$55,402
State:
$64,978
Salary/wage: $48,748 (reported on 82.9% of returns)
Here:
$48,748
State:
$55,245
(% of AGI for various income ranges: 1093.2% for AGIs below $25k, 4092.7% for AGIs $25k-50k, 6692.3% for AGIs $50k-75k, 9820.0% for AGIs $75k-100k, 16394.2% for AGIs $100k-200k)
Taxable interest for individuals: $804 (reported on 25.1% of returns)
This zip code:
$804
Indiana:
$1,351
(% of AGI for various income ranges: 12.2% for AGIs below $25k, 17.8% for AGIs $25k-50k, 20.4% for AGIs $50k-75k, 29.3% for AGIs $75k-100k, 80.8% for AGIs $100k-200k)
Ordinary dividends: $3,368 (reported on 13.4% of returns)
Here:
$3,368
State:
$5,827
(% of AGI for various income ranges: 34.9% for AGIs below $25k, 27.3% for AGIs $25k-50k, 59.2% for AGIs $50k-75k, 96.0% for AGIs $75k-100k, 250.0% for AGIs $100k-200k)
Net capital gain/loss in AGI: +$6,426 (reported on 12.3% of returns)
Here:
+$6,426
State:
+$17,730
(% of AGI for various income ranges: 0.2% for AGIs below $25k, 14.9% for AGIs $25k-50k, 96.2% for AGIs $50k-75k, 200.0% for AGIs $75k-100k, 726.7% for AGIs $100k-200k)
Profit/loss from business: +$11,331 (reported on 15.5% of returns)
Here:
+$11,331
State:
+$12,144
(% of AGI for various income ranges: 130.7% for AGIs below $25k, 160.0% for AGIs $25k-50k, 392.7% for AGIs $50k-75k, 291.3% for AGIs $75k-100k, 583.3% for AGIs $100k-200k)
Taxable individual retirement arrangement distribution: $17,367 (reported on 9.6% of returns)
46746:
$17,367
Indiana:
$18,302
(% of AGI for various income ranges: 104.9% for AGIs below $25k, 84.1% for AGIs $25k-50k, 160.8% for AGIs $50k-75k, 290.7% for AGIs $75k-100k, 1275.8% for AGIs $100k-200k)
Total itemized deductions: $36,320 (reported on 2.7% of returns)
Here:
$36,320
State:
$35,601
(% of AGI for various income ranges: 1513.3% for AGIs $100k-200k)
Charity contributions: $15,700 (reported on 2.1% of returns)
Here:
$15,700
State:
$15,596
(% of AGI for various income ranges: 523.3% for AGIs $100k-200k)
Taxes paid: $6,733 (reported on 3.2% of returns)
46746:
$6,733
State:
$7,542
(% of AGI for various income ranges: 336.7% for AGIs $100k-200k)
Earned income credit: $2,188 (reported on 13.4% of returns)
Here:
$2,188
State:
$2,298
(% of AGI for various income ranges: 76.1% for AGIs below $25k, 63.5% for AGIs $25k-50k)
Percentage of individuals using paid preparers for their 2020 taxes: 91.4%
Here:
91%
State:
94%
(% for various income ranges: 87.9% for AGIs below $25k, 91.8% for AGIs $25k-50k, 91.4% for AGIs $50k-75k, 95.2% for AGIs $75k-100k, 95.2% for AGIs $100k-200k, 100.0% for AGIs over 200k)
Averages for the 2012 tax year for zip code 46746, filed in 2013:
Average Adjusted Gross Income (AGI) in 2012: $44,485 (Individual Income Tax Returns)
Here:
$44,485
State:
$52,932
Salary/wage: $36,629 (reported on 85.5% of returns)
Here:
$36,629
State:
$45,173
(% of AGI for various income ranges: 72.9% for AGIs below $25k, 81.7% for AGIs $25k-50k, 81.1% for AGIs $50k-75k, 74.0% for AGIs $75k-100k, 50.1% for AGIs $100k-200k)
Taxable interest for individuals: $1,286 (reported on 25.4% of returns)
This zip code:
$1,286
Indiana:
$1,311
(% of AGI for various income ranges: 1.1% for AGIs below $25k, 1.1% for AGIs $25k-50k, 0.5% for AGIs $50k-75k, 0.4% for AGIs $75k-100k, 0.7% for AGIs $100k-200k)
Ordinary dividends: $3,317 (reported on 16.8% of returns)
Here:
$3,317
State:
$4,690
(% of AGI for various income ranges: 1.3% for AGIs below $25k, 1.1% for AGIs $25k-50k, 0.8% for AGIs $50k-75k, 0.9% for AGIs $75k-100k, 1.8% for AGIs $100k-200k)
Net capital gain/loss in AGI: +$5,774 (reported on 13.3% of returns)
Here:
+$5,774
State:
+$10,406
(% of AGI for various income ranges: 0.6% for AGIs below $25k, 1.1% for AGIs $25k-50k, 0.4% for AGIs $50k-75k, 0.5% for AGIs $75k-100k, 4.3% for AGIs $100k-200k)
Profit/loss from business: +$5,796 (reported on 15.6% of returns)
Here:
+$5,796
State:
+$11,105
(% of AGI for various income ranges: 7.8% for AGIs below $25k, 3.3% for AGIs $25k-50k, 1.4% for AGIs $50k-75k, 0.3% for AGIs $100k-200k)
Taxable individual retirement arrangement distribution: $12,115 (reported on 11.6% of returns)
46746:
$12,115
Indiana:
$13,841
(% of AGI for various income ranges: 3.5% for AGIs below $25k, 2.5% for AGIs $25k-50k, 3.4% for AGIs $50k-75k, 4.8% for AGIs $75k-100k, 2.5% for AGIs $100k-200k)
Total itemized deductions: $18,329 (20% of AGI, reported on 17.9% of returns)
Here:
$18,329
State:
$20,913
Here:
19.6% of AGI
State:
18.2% of AGI
(% of AGI for various income ranges: 8.8% for AGIs below $25k, 5.4% for AGIs $25k-50k, 5.5% for AGIs $50k-75k, 9.0% for AGIs $75k-100k, 9.2% for AGIs $100k-200k)
Charity contributions: $5,210 (reported on 11.6% of returns)
Here:
$5,210
State:
$4,697
(% of AGI for various income ranges: 0.5% for AGIs below $25k, 0.7% for AGIs $25k-50k, 1.0% for AGIs $50k-75k, 1.3% for AGIs $75k-100k, 2.5% for AGIs $100k-200k)
Taxes paid: $5,742 (reported on 17.9% of returns)
46746:
$5,742
State:
$7,456
(% of AGI for various income ranges: 0.8% for AGIs below $25k, 1.4% for AGIs $25k-50k, 1.5% for AGIs $50k-75k, 2.7% for AGIs $75k-100k, 4.1% for AGIs $100k-200k)
Earned income credit: $2,264 (reported on 19.1% of returns)
Here:
$2,264
State:
$2,265
(% of AGI for various income ranges: 6.0% for AGIs below $25k, 1.3% for AGIs $25k-50k)
Percentage of individuals using paid preparers for their 2012 taxes: 65.9%
Here:
66%
State:
53%
(% for various income ranges: 62.0% for AGIs below $25k, 65.3% for AGIs $25k-50k, 69.0% for AGIs $50k-75k, 69.2% for AGIs $75k-100k, 81.8% for AGIs $100k-200k)
Averages for the 2004 tax year for zip code 46746, filed in 2005:
Average Adjusted Gross Income (AGI) in 2004: $39,423 (Individual Income Tax Returns)
Here:
$39,423
State:
$44,790
Salary/wage: $34,615 (reported on 87.1% of returns)
Here:
$34,615
State:
$39,615
(% of AGI for various income ranges: 131.2% for AGIs below $10k, 78.8% for AGIs $10k-25k, 88.3% for AGIs $25k-50k, 82.8% for AGIs $50k-75k, 75.4% for AGIs $75k-100k, 45.0% for AGIs over 100k)
Taxable interest for individuals: $1,459 (reported on 38.7% of returns)
This zip code:
$1,459
Indiana:
$1,535
(% of AGI for various income ranges: 9.1% for AGIs below $10k, 1.9% for AGIs $10k-25k, 0.7% for AGIs $25k-50k, 1.4% for AGIs $50k-75k, 1.7% for AGIs $75k-100k, 1.4% for AGIs over 100k)
Taxable dividends: $2,727 (reported on 18.8% of returns)
Here:
$2,727
State:
$2,998
(% of AGI for various income ranges: 8.2% for AGIs below $10k, 0.7% for AGIs $10k-25k, 0.5% for AGIs $25k-50k, 0.7% for AGIs $50k-75k, 1.5% for AGIs $75k-100k, 2.7% for AGIs over 100k)
Net capital gain/loss: +$6,705 (reported on 15.7% of returns)
Here:
+$6,705
State:
+$8,619
(% of AGI for various income ranges: -1.5% for AGIs below $10k, 1.4% for AGIs $10k-25k, 1.0% for AGIs $25k-50k, 1.7% for AGIs $50k-75k, 1.4% for AGIs $75k-100k, 8.7% for AGIs over 100k)
Profit/loss from business: +$5,593 (reported on 14.4% of returns)
Here:
+$5,593
State:
+$10,071
(% of AGI for various income ranges: 6.1% for AGIs below $10k, 4.6% for AGIs $10k-25k, 2.0% for AGIs $25k-50k, 1.7% for AGIs $50k-75k, 1.3% for AGIs $75k-100k, 1.5% for AGIs over 100k)
IRA payment deduction: $2,604 (reported on 2.8% of returns)
46746:
$2,604
Indiana:
$2,840
Total itemized deductions: $14,599 (21% of AGI, reported on 22.9% of returns)
Here:
$14,599
State:
$17,065
Here:
21.5% of AGI
State:
19.5% of AGI
(% of AGI for various income ranges: 7.9% for AGIs $10k-25k, 6.5% for AGIs $25k-50k, 9.1% for AGIs $50k-75k, 10.5% for AGIs $75k-100k, 9.7% for AGIs over 100k)
Charity contributions deductions: $3,284 (5% of AGI, reported on 17.1% of returns)
Here:
$3,284
State:
$3,550
Here:
4.5% of AGI
State:
3.8% of AGI
(% of AGI for various income ranges: 0.9% for AGIs $10k-25k, 0.9% for AGIs $25k-50k, 1.5% for AGIs $50k-75k, 1.6% for AGIs $75k-100k, 2.2% for AGIs over 100k)
Total tax: $4,872 (reported on 73.5% of returns)
46746:
$4,872
State:
$6,914
(% of AGI for various income ranges: 3.2% for AGIs below $10k, 4.0% for AGIs $10k-25k, 6.1% for AGIs $25k-50k, 8.5% for AGIs $50k-75k, 10.6% for AGIs $75k-100k, 16.0% for AGIs over 100k)
Earned income credit: $1,620 (reported on 12.6% of returns)
Here:
$1,620
State:
$1,685
Percentage of individuals using paid preparers for their 2004 taxes: 67.5%
Here:
68%
State:
59%
(% for various income ranges: 59.5% for AGIs below $10k, 67.7% for AGIs $10k-25k, 69.8% for AGIs $25k-50k, 68.2% for AGIs $50k-75k, 75.2% for AGIs $75k-100k, 75.4% for AGIs over 100k)
Household received Food Stamps/SNAP in the past 12 months: 37 Household did not receive Food Stamps/SNAP in the past 12 months: 1,364
Women who had a birth in the past 12 months: 85 (0 now married, 72 unmarried) Women who did not have a birth in the past 12 months: 954 (421 now married, 533 unmarried)
Housing units in zip code 46746 with a mortgage: 767 (29 second mortgage, 29 both second mortgage and home equity loan) Median monthly owner costs for units with a mortgage: $1,020 Median monthly owner costs for units without a mortgage: $369
Residents with income below the poverty level in 2022:
This zip code:
1.6%
Whole state:
12.6%
Residents with income below 50% of the poverty level in 2022:
This zip code:
0.6%
Whole state:
6.3%
Median number of rooms in houses and condos:
Here:
6.7
State:
6.6
Median number of rooms in apartments:
Here:
5.4
State:
4.3
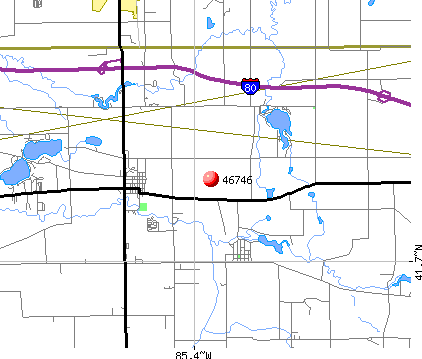
Notable locations in this zip code not listed on our city pages
Notable locations in zip code 46746: Cedar Lake Golf Club (A), Howe-Lagrange Tollgate (B), Howe Volunteer Fire Department (C). Display/hide their locations on the map
Churches in zip code 46746 include: Ontario Community Church (A), Saint Marks Episcopal Church (B), Pretty Prairie Church (C), English Prairie Church (D). Display/hide their locations on the map
Cemeteries: Bontrager Cemetery (1), Riverside Cemetery (2), Ontario Cemetery (3), Eagle Cemetery (4), K of P Cemetery (5), Oaklawn Cemetery (6). Display/hide their locations on the map
Lakes and reservoirs: Meteer Lake (A), Cedar Lake (B), Fennell Lake (C), Lane Lake (D), Still Lake (E), Donaldson Lake (F), Twin Lakes (G), Duff Lake (H). Display/hide their locations on the map
In group quarters: 104 (-1 institutionalized population)
Size of family households: 455 2-persons, 192 3-persons, 239 4-persons, 68 5-persons, 73 6-persons, 53 7-or-more-persons
Size of nonfamily households: 262 1-person, 58 2-persons
612 married couples with children.
269 single-parent households (145 men, 124 women).
71.3% of residents of 46746 zip code speak English at home.
11.1% of residents speak Spanish at home (53% very well, 15% well, 32% not well).
21.1% of residents speak other Indo-European language at home (80% very well, 19% well, 1% not well).
0.3% of residents speak Asian or Pacific Island language at home (100% very well).
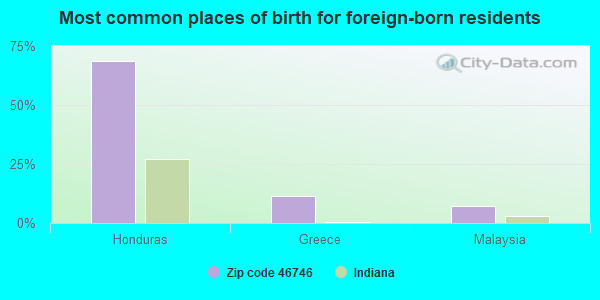
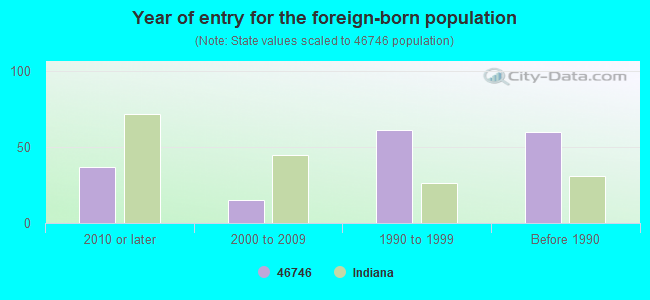
Foreign born population: 189 (4.2%) (83.0% of them are naturalized citizens)
This zip code:
4.2%
Whole state:
6.1%
69%Honduras
11%Greece
7%Malaysia
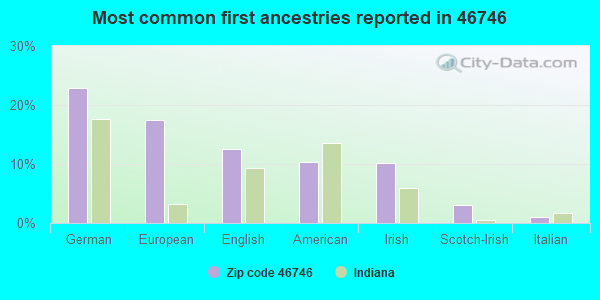
23%German
18%European
13%English
10%American
10%Irish
3%Scotch-Irish
1%Italian
Year of entry for the foreign-born population
372010 or later
152000 to 2009
611990 to 1999
60Before 1990
Facilities with environmental interests located in this zip code:
MULTI PLEX INC (6505 N SR 9 in HOWE, IN)
STATE MASTER (Indiana facility tracking) - UST-10025, UNDERGROUND STORAGE TANK PROGRAM Conditionally Exempt Small Quantity Generators, less than 100 kg/month of hazardous waste (Resource Conservation and Recovery Act (tracking hazardous waste)) TRI REPORTER (Tracking of toxic chemicals releasing facilities) Business SIC classification: MOTOR VEHICLE PARTS AND ACCESSORIES Business NAICS classification: ALL OTHER MOTOR VEHICLE PARTS MANUFACTURING. Organizations: DAVIS INDUSTRIES (CONTACT/OWNER)
, TESMA INT'L (CONTACT/OWNER)
, TESMA AUTOMOTIVE GROUP, INC (CONTACT/OWNER)
, MAGNA POWERTRAIN (CONTACT/OWNER)
MICHIANA LAMINATED PRODUCTS, INC. (7130 N CR 50 E in HOWE, IN)
AIR MINOR (AIRS/AFS) STATE MASTER (Indiana facility tracking) - ACES-OP-08700010, AIR PROGRAM Business SIC classification: WOOD OFFICE AND STORE FIXTURES, PARTITIONS, SHELVING, AND LOCKERS
LIMA-BRIGHTON ELEMENTARY (MARKET & 3RD STS in HOWE, IN)
(National Center for Education Statistics) - STATE ID-3745 Organizations: LAKELAND SCHOOL CORPORATION (SCHOOL DISTRICT)
OGG PROPERTY (CO RD 400 NE OF CO RD 900E in HOWE, IN)
STATE MASTER (Indiana facility tracking) (Resource Conservation and Recovery Act (tracking hazardous waste))
BAYER CORP HOWE RESEARCH FARM (RTE 2 HWY 9 in HOWE, IN)
STATE MASTER (Indiana facility tracking) Conditionally Exempt Small Quantity Generators, less than 100 kg/month of hazardous waste (Resource Conservation and Recovery Act (tracking hazardous waste)) - notification Organizations: BAYER CORPORATION (CONTACT/OWNER)
HANSELMAN METALS INC (C O RD 400 N AND 100 E in HOWE, IN)
STATE MASTER (Indiana facility tracking) TRANSPORTER (Resource Conservation and Recovery Act (tracking hazardous waste)) Organizations: HANSELMAN BRUCE E (CONTACT/OWNER)
MULTI PLEX INC (STATE RD 9 NORTH in HOWE, IL)
Small Quantity Generators, between 100 kg and 1000 kg of hazardous waste/month (Resource Conservation and Recovery Act (tracking hazardous waste)) - notification Organizations: DAVIS INDUSTRIES (CONTACT/OWNER)
SKYLINE HOWE (7805 N. STATE RD. 9 in HOWE, IN)
STATE MASTER (Indiana facility tracking) CRITERIA AND HAZARDOUS AIR POLLUTANT INVENTORY (Inventory of air pollution sources) TRI REPORTER (Tracking of toxic chemicals releasing facilities) Business SIC classification: MOBILE HOMES Business NAICS classification: MANUFACTURED HOME (MOBILE HOME) MANUFACTURING. Alternative names: SKYLINE HOWE DOUBLE WIDE
Housing units lacking complete kitchen facilities: 3.2%
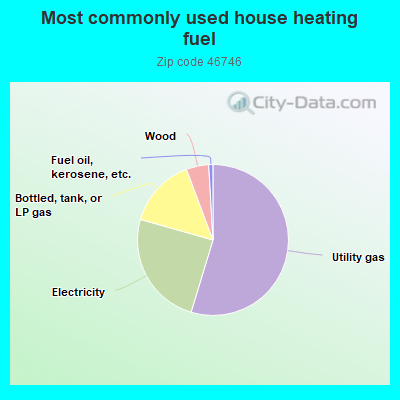
54.7%Utility gas
24.7%Electricity
14.9%Bottled, tank, or LP gas
4.8%Wood
0.9%Fuel oil, kerosene, etc.
Population in 1990: 6,040.
Place of birth for U.S.-born residents:
This state: 2,325
Northeast: 7
Midwest: 1,619
South: 183
West: 176
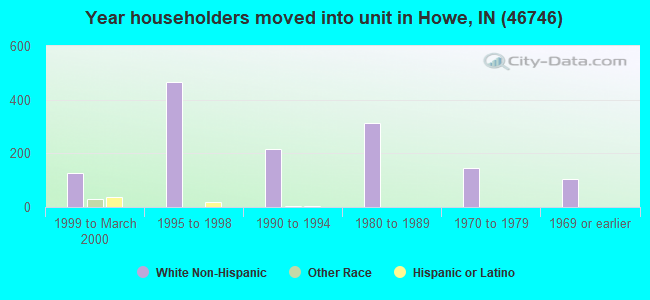
58% of the 46746 zip code residents lived in the same house 5 years ago. Out of people who lived in different houses, 54% lived in this county. Out of people who lived in different counties, 50% lived in Indiana.
90% of the 46746 zip code residents lived in the same house 1 year ago. Out of people who lived in different houses, 71% moved from this county. Out of people who lived in different houses, 29% moved from different state.
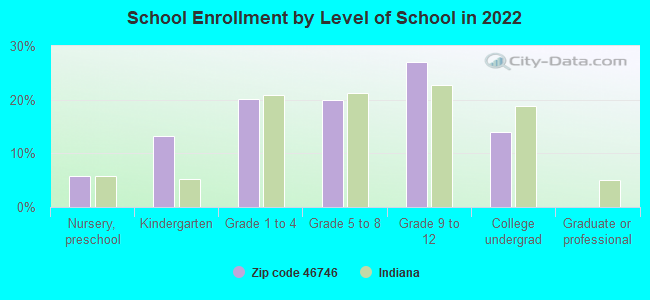
Private vs. public school enrollment:
Students in private schools in grades 1 to 8 (elementary and middle school): 34
Here:
8.4%
Indiana:
14.9%
Students in private schools in grades 9 to 12 (high school): 23
Here:
8.3%
Indiana:
11.4%
Students in private undergraduate colleges: 63
Here:
42.9%
Indiana:
22.3%
Occupation by median earnings in the past 12 months ($)
63,333Transportation occupations
60,410Business and financial operations occupations
58,182Construction and extraction occupations
53,709Material moving occupations
51,590Management occupations
44,995Installation, maintenance, and repair occupations
Top industries in this zip code by the number of employees in 2005:
Accommodation and Food Services: Limited-Service Restaurants (50-99 employees: 2 establishments)
Educational Services: Elementary and Secondary Schools (50-99: 1)
Health Care and Social Assistance: Services for the Elderly and Persons with Disabilities (50-99: 1)
Accommodation and Food Services: Hotels (except Casino Hotels) and Motels (10-19: 2, 5-9: 1, 1-4: 2)
People in group quarters in 2010:
112 people in college/university student housing
24 people in residential treatment centers for juveniles (non-correctional)
14 people in workers' group living quarters and job corps centers
4 people in group homes intended for adults
Fatal accident statistics in 2014:
Fatal accident count: 2
Vehicles involved in fatal accidents: 5
Fatal accidents caused by drunken drivers: 0
Fatalities: 2
Persons involved in fatal accidents: 9
Pedestrians involved in fatal accidents: 0
Fatal accident statistics in 2013:
Fatal accident count: 2
Vehicles involved in fatal accidents: 2
Fatal accidents caused by drunken drivers: 1
Fatalities: 2
Persons involved in fatal accidents: 3
Pedestrians involved in fatal accidents: 0
2002 - 2018 National Fire Incident Reporting System (NFIRS) incidents
Based on the data from the years 2002 - 2018 the average number of fires per year is 16. The highest number of reported fire incidents - 31 took place in 2005, and the least - 0 in 2016. The data has a declining trend.
When looking into fire subcategories, the most reports belonged to: Outside Fires (42.4%), and Structure Fires (40.1%).
Fire incident types reported to NFIRS in Zip Code 46746


 Nearest zip codes: 46771, 46761, 49030, 49091, 46795, 46776.


 Based on the data from the years 2002 - 2018 the average number of fires per year is 16. The highest number of reported fire incidents - 31 took place in 2005, and the least - 0 in 2016. The data has a declining trend.
 When looking into fire subcategories, the most reports belonged to: Outside Fires (42.4%), and Structure Fires (40.1%).