Estimated zip code population in 2022: 2,035 Zip code population in 2010: 2,236 Zip code population in 2000: 2,667
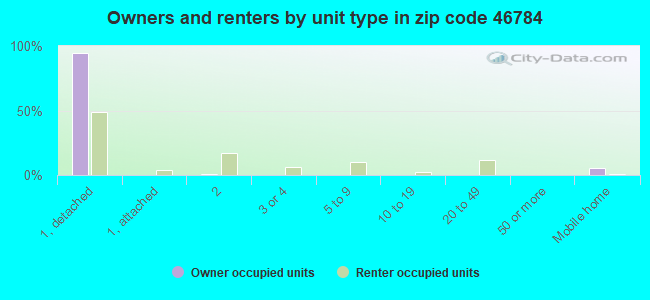
Houses and condos: 1,346 Renter-occupied apartments: 102
% of renters here:
12%
State:
29%
March 2022 cost of living index in zip code 46784: 85.7 (less than average, U.S. average is 100)
Land area: 13.3 sq. mi. Water area: 1.8 sq. mi.
Population density: 153 people per square mile
(very low).
OSM Map
General Map
Google Map
MSN Map
OSM Map
General Map
Google Map
MSN Map
OSM Map
General Map
Google Map
MSN Map
OSM Map
General Map
Google Map
MSN Map
Please wait while loading the map...
Real estate property taxes paid for housing units in 2022:
This zip code:
0.6% ($1,316)
Indiana:
0.7% ($1,467)
Median real estate property taxes paid for housing units with mortgages in 2022: $1,364 (0.6%) Median real estate property taxes paid for housing units with no mortgage in 2022: $1,200 (0.7%)
Business Search- 14 Million verified businesses
Males: 1,040
(51.1%)
Females: 994
(48.9%)
For population 25 years and over in 46784:
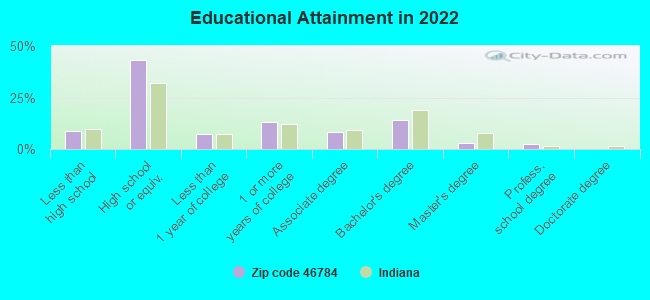
High school or higher: 90.3%
Bachelor's degree or higher: 19.2%
Graduate or professional degree: 5.5%
Unemployed: 2.6%
Mean travel time to work (commute): 28.0 minutes
For population 15 years and over in 46784:
Never married: 21.8%
Now married: 59.9%
Separated: 0.6%
Widowed: 5.1%
Divorced: 12.6%
Zip code 46784 compared to state average:
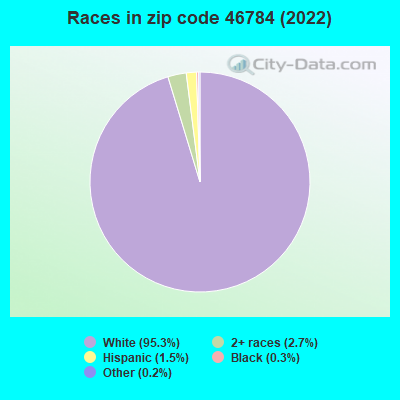
Black race population percentage significantly below state average.
Hispanic race population percentage significantly below state average.
Median age significantly above state average.
Foreign-born population percentage significantly below state average.
Renting percentage significantly below state average.
Length of stay since moving in significantly above state average.
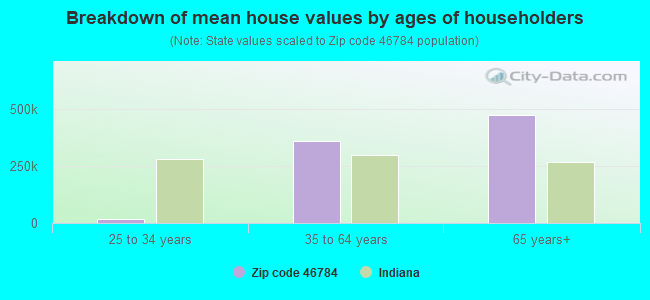
Estimated median house/condo value in 2022: $212,337
46784:
$212,337
Indiana:
$208,700
Median resident age:
This zip code:
51.5 years
Indiana median age:
38.2 years
Average household size:
This zip code:
2.3 people
Indiana:
2.4 people
Averages for the 2020 tax year for zip code 46784, filed in 2021:
Average Adjusted Gross Income (AGI) in 2020: $70,901 (Individual Income Tax Returns)
Here:
$70,901
State:
$64,978
Salary/wage: $58,375 (reported on 79.3% of returns)
Here:
$58,375
State:
$55,245
(% of AGI for various income ranges: 1057.2% for AGIs below $25k, 3387.9% for AGIs $25k-50k, 6362.3% for AGIs $50k-75k, 8946.7% for AGIs $75k-100k, 13197.0% for AGIs $100k-200k)
Taxable interest for individuals: $1,666 (reported on 34.2% of returns)
This zip code:
$1,666
Indiana:
$1,351
(% of AGI for various income ranges: 18.0% for AGIs below $25k, 23.2% for AGIs $25k-50k, 16.2% for AGIs $50k-75k, 70.0% for AGIs $75k-100k, 68.0% for AGIs $100k-200k)
Ordinary dividends: $5,025 (reported on 21.6% of returns)
Here:
$5,025
State:
$5,827
(% of AGI for various income ranges: 29.2% for AGIs below $25k, 39.5% for AGIs $25k-50k, 65.4% for AGIs $50k-75k, 68.9% for AGIs $75k-100k, 184.0% for AGIs $100k-200k)
Net capital gain/loss in AGI: +$9,576 (reported on 18.9% of returns)
Here:
+$9,576
State:
+$17,730
(% of AGI for various income ranges: 6.4% for AGIs below $25k, 35.3% for AGIs $25k-50k, 10.8% for AGIs $50k-75k, 85.6% for AGIs $75k-100k, 351.0% for AGIs $100k-200k)
Profit/loss from business: +$13,153 (reported on 13.5% of returns)
Here:
+$13,153
State:
+$12,144
(% of AGI for various income ranges: 102.0% for AGIs below $25k, 170.5% for AGIs $25k-50k, 380.8% for AGIs $50k-75k, 899.0% for AGIs $100k-200k)
Taxable individual retirement arrangement distribution: $19,000 (reported on 12.6% of returns)
46784:
$19,000
Indiana:
$18,302
(% of AGI for various income ranges: 100.8% for AGIs below $25k, 250.0% for AGIs $25k-50k, 683.3% for AGIs $75k-100k, 1318.0% for AGIs $100k-200k)
Total itemized deductions: $35,740 (reported on 4.5% of returns)
Here:
$35,740
State:
$35,601
(% of AGI for various income ranges: 1086.7% for AGIs $75k-100k)
Charity contributions: $9,175 (reported on 3.6% of returns)
Here:
$9,175
State:
$15,596
(% of AGI for various income ranges: 38.9% for AGIs $25k-50k)
Taxes paid: $8,200 (reported on 5.4% of returns)
46784:
$8,200
State:
$7,542
(% of AGI for various income ranges: 301.1% for AGIs $75k-100k)
Earned income credit: $2,200 (reported on 11.7% of returns)
Here:
$2,200
State:
$2,298
(% of AGI for various income ranges: 71.6% for AGIs below $25k, 56.3% for AGIs $25k-50k)
Percentage of individuals using paid preparers for their 2020 taxes: 91.0%
Here:
91%
State:
94%
(% for various income ranges: 91.7% for AGIs below $25k, 91.7% for AGIs $25k-50k, 94.1% for AGIs $50k-75k, 84.6% for AGIs $75k-100k, 93.3% for AGIs $100k-200k, 83.3% for AGIs over 200k)
Averages for the 2012 tax year for zip code 46784, filed in 2013:
Average Adjusted Gross Income (AGI) in 2012: $49,849 (Individual Income Tax Returns)
Here:
$49,849
State:
$52,932
Salary/wage: $42,792 (reported on 82.7% of returns)
Here:
$42,792
State:
$45,173
(% of AGI for various income ranges: 60.9% for AGIs below $25k, 78.0% for AGIs $25k-50k, 77.6% for AGIs $50k-75k, 74.5% for AGIs $75k-100k, 73.7% for AGIs $100k-200k, 52.6% for AGIs over 200k)
Taxable interest for individuals: $964 (reported on 34.6% of returns)
This zip code:
$964
Indiana:
$1,311
(% of AGI for various income ranges: 1.1% for AGIs below $25k, 0.4% for AGIs $25k-50k, 0.6% for AGIs $50k-75k, 0.9% for AGIs $75k-100k, 1.3% for AGIs $100k-200k)
Ordinary dividends: $3,450 (reported on 19.2% of returns)
Here:
$3,450
State:
$4,690
(% of AGI for various income ranges: 1.2% for AGIs below $25k, 1.4% for AGIs $25k-50k, 0.3% for AGIs $50k-75k, 0.9% for AGIs $75k-100k, 3.8% for AGIs $100k-200k)
Net capital gain/loss in AGI: +$2,983 (reported on 11.5% of returns)
Here:
+$2,983
State:
+$10,406
(% of AGI for various income ranges: 0.2% for AGIs $25k-50k, 1.5% for AGIs $75k-100k, 2.1% for AGIs $100k-200k)
Profit/loss from business: +$7,491 (reported on 10.6% of returns)
Here:
+$7,491
State:
+$11,105
(% of AGI for various income ranges: 5.8% for AGIs below $25k, 3.9% for AGIs $25k-50k, 1.3% for AGIs $75k-100k)
Taxable individual retirement arrangement distribution: $12,350 (reported on 13.5% of returns)
46784:
$12,350
Indiana:
$13,841
(% of AGI for various income ranges: 5.7% for AGIs below $25k, 5.6% for AGIs $25k-50k, 9.0% for AGIs $75k-100k)
Total itemized deductions: $19,828 (20% of AGI, reported on 24.0% of returns)
Here:
$19,828
State:
$20,913
Here:
20.2% of AGI
State:
18.2% of AGI
(% of AGI for various income ranges: 7.8% for AGIs below $25k, 7.1% for AGIs $25k-50k, 10.1% for AGIs $50k-75k, 9.4% for AGIs $75k-100k, 11.7% for AGIs $100k-200k, 11.0% for AGIs over 200k)
Charity contributions: $3,272 (reported on 17.3% of returns)
Here:
$3,272
State:
$4,697
(% of AGI for various income ranges: 1.0% for AGIs $25k-50k, 1.0% for AGIs $50k-75k, 1.6% for AGIs $75k-100k, 2.4% for AGIs $100k-200k)
Taxes paid: $7,372 (reported on 24.0% of returns)
46784:
$7,372
State:
$7,456
(% of AGI for various income ranges: 1.3% for AGIs below $25k, 2.2% for AGIs $25k-50k, 2.6% for AGIs $50k-75k, 3.3% for AGIs $75k-100k, 5.0% for AGIs $100k-200k, 6.3% for AGIs over 200k)
Earned income credit: $2,058 (reported on 18.3% of returns)
Here:
$2,058
State:
$2,265
(% of AGI for various income ranges: 5.5% for AGIs below $25k, 1.2% for AGIs $25k-50k)
Percentage of individuals using paid preparers for their 2012 taxes: 63.5%
Here:
63%
State:
53%
(% for various income ranges: 60.0% for AGIs below $25k, 62.1% for AGIs $25k-50k, 60.0% for AGIs $50k-75k, 72.7% for AGIs $75k-100k, 100.0% for AGIs $100k-200k)
Averages for the 2004 tax year for zip code 46784, filed in 2005:
Average Adjusted Gross Income (AGI) in 2004: $39,285 (Individual Income Tax Returns)
Here:
$39,285
State:
$44,790
Salary/wage: $35,882 (reported on 87.5% of returns)
Here:
$35,882
State:
$39,615
(% of AGI for various income ranges: 93.8% for AGIs below $10k, 71.3% for AGIs $10k-25k, 85.1% for AGIs $25k-50k, 85.4% for AGIs $50k-75k, 82.1% for AGIs $75k-100k, 65.3% for AGIs over 100k)
Taxable interest for individuals: $990 (reported on 41.8% of returns)
This zip code:
$990
Indiana:
$1,535
(% of AGI for various income ranges: 2.7% for AGIs below $10k, 2.4% for AGIs $10k-25k, 1.0% for AGIs $25k-50k, 0.7% for AGIs $50k-75k, 0.6% for AGIs $75k-100k, 1.1% for AGIs over 100k)
Taxable dividends: $2,021 (reported on 19.7% of returns)
Here:
$2,021
State:
$2,998
(% of AGI for various income ranges: 1.7% for AGIs below $10k, 1.1% for AGIs $10k-25k, 0.9% for AGIs $25k-50k, 0.5% for AGIs $50k-75k, 0.7% for AGIs $75k-100k, 2.1% for AGIs over 100k)
Net capital gain/loss: +$1,394 (reported on 13.5% of returns)
Here:
+$1,394
State:
+$8,619
(% of AGI for various income ranges: -1.6% for AGIs below $10k, -0.5% for AGIs $10k-25k, 0.4% for AGIs $25k-50k, 0.7% for AGIs $50k-75k, 0.3% for AGIs $75k-100k, 1.1% for AGIs over 100k)
Profit/loss from business: +$5,419 (reported on 10.9% of returns)
Here:
+$5,419
State:
+$10,071
(% of AGI for various income ranges: 2.5% for AGIs below $10k, 2.8% for AGIs $10k-25k, 3.2% for AGIs $25k-50k, 0.1% for AGIs $50k-75k, 1.8% for AGIs $75k-100k)
IRA payment deduction: $2,364 (reported on 1.9% of returns)
46784:
$2,364
Indiana:
$2,840
Total itemized deductions: $15,248 (22% of AGI, reported on 29.3% of returns)
Here:
$15,248
State:
$17,065
Here:
21.8% of AGI
State:
19.5% of AGI
(% of AGI for various income ranges: 10.9% for AGIs $10k-25k, 8.6% for AGIs $25k-50k, 12.5% for AGIs $50k-75k, 15.8% for AGIs $75k-100k, 11.1% for AGIs over 100k)
Charity contributions deductions: $2,071 (3% of AGI, reported on 22.7% of returns)
Here:
$2,071
State:
$3,550
Here:
2.8% of AGI
State:
3.8% of AGI
(% of AGI for various income ranges: 1.1% for AGIs $10k-25k, 0.8% for AGIs $25k-50k, 1.4% for AGIs $50k-75k, 1.3% for AGIs $75k-100k, 1.6% for AGIs over 100k)
Total tax: $4,899 (reported on 73.5% of returns)
46784:
$4,899
State:
$6,914
(% of AGI for various income ranges: 2.0% for AGIs below $10k, 3.6% for AGIs $10k-25k, 6.3% for AGIs $25k-50k, 7.9% for AGIs $50k-75k, 9.9% for AGIs $75k-100k, 18.3% for AGIs over 100k)
Earned income credit: $1,464 (reported on 14.2% of returns)
Here:
$1,464
State:
$1,685
Percentage of individuals using paid preparers for their 2004 taxes: 61.4%
Here:
61%
State:
59%
(% for various income ranges: 49.6% for AGIs below $10k, 58.8% for AGIs $10k-25k, 64.9% for AGIs $25k-50k, 66.0% for AGIs $50k-75k, 68.8% for AGIs $75k-100k, 72.5% for AGIs over 100k)
Household received Food Stamps/SNAP in the past 12 months: 36 Household did not receive Food Stamps/SNAP in the past 12 months: 835
Women who had a birth in the past 12 months: 51 (46 now married, 7 unmarried) Women who did not have a birth in the past 12 months: 357 (171 now married, 185 unmarried)
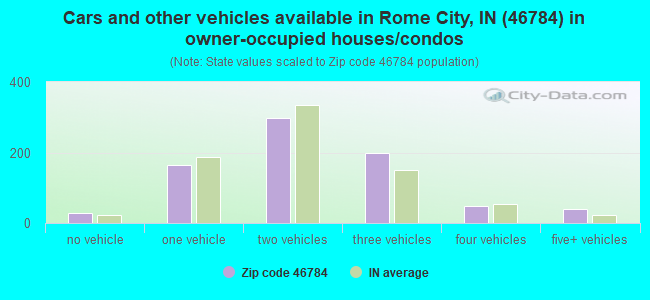
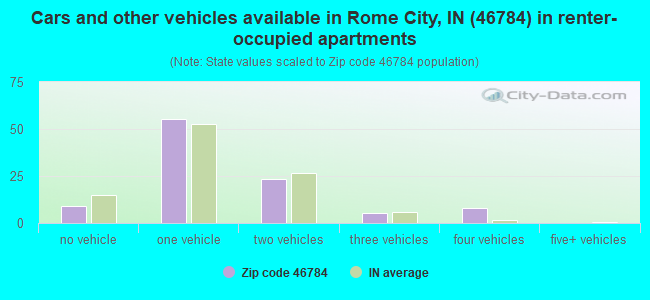
Housing units in zip code 46784 with a mortgage: 485 (46 second mortgage, 30 both second mortgage and home equity loan) Median monthly owner costs for units with a mortgage: $1,297 Median monthly owner costs for units without a mortgage: $527
Residents with income below the poverty level in 2022:
This zip code:
7.6%
Whole state:
12.6%
Residents with income below 50% of the poverty level in 2022:
This zip code:
3.3%
Whole state:
6.3%
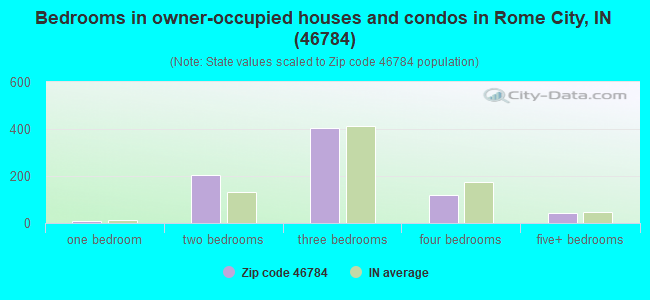
Median number of rooms in houses and condos:
Here:
6.2
State:
6.6
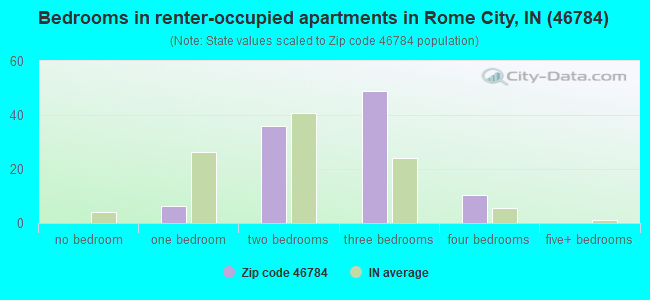
Median number of rooms in apartments:
Here:
5.8
State:
4.3
Notable locations in this zip code not listed on our city pages
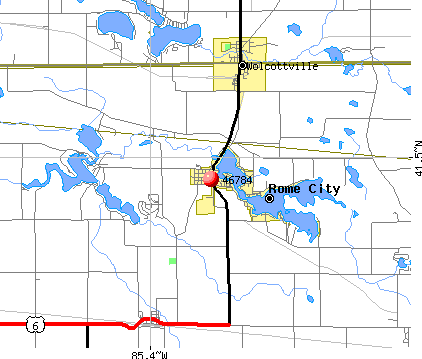
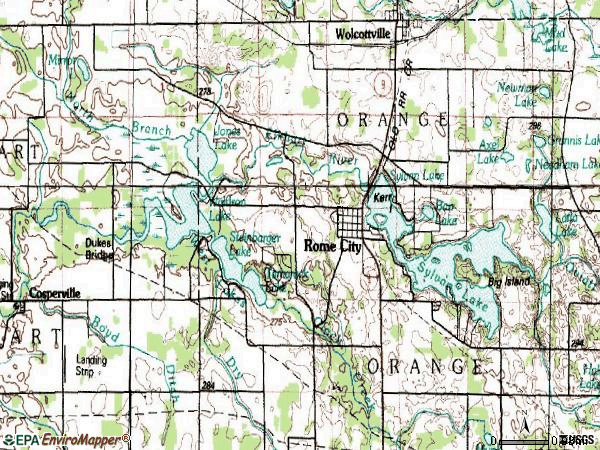
Lakes: Newman Lake (A), Needham Lake (B), Moore Lake (C), Mirror Lake (D), Latta Lake (E), Axel Lake (F), Tamarack Lake (G), Steinbarger Lake (H). Display/hide their locations on the map
Size of family households: 334 2-persons, 165 3-persons, 46 4-persons, 44 5-persons, 12 6-persons
Size of nonfamily households: 230 1-person, 43 2-persons
173 married couples with children.
51 single-parent households (7 men, 44 women).
91.7% of residents of 46784 zip code speak English at home.
0.6% of residents speak Spanish at home (100% very well).
8.5% of residents speak other Indo-European language at home (100% very well).
0.2% of residents speak other language at home (100% not at all).
Foreign born population: 0 (0.0%)
:
0.0%
Whole state:
6.1%
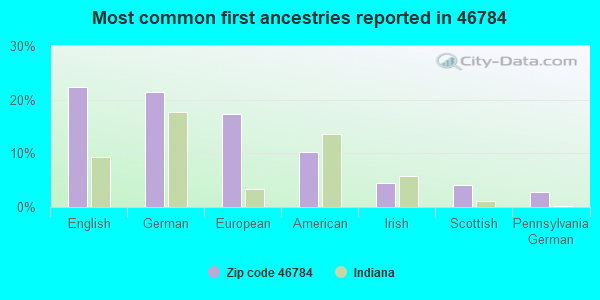
22%English
21%German
17%European
10%American
4%Irish
4%Scottish
3%Pennsylvania German
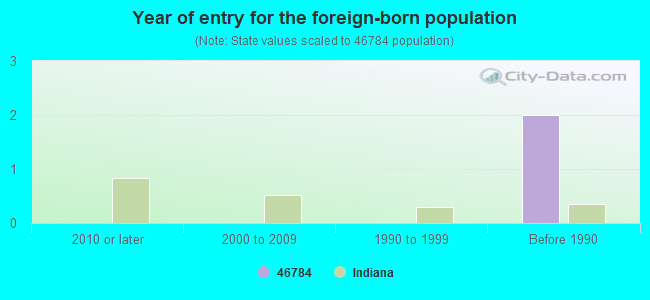
Year of entry for the foreign-born population
02010 or later
02000 to 2009
01990 to 1999
2Before 1990
Facilities with environmental interests located in this zip code:
ROME CITY ELEM & MIDDLE SCH (W JEFFERSON ST in ROME CITY, IN)
(National Center for Education Statistics) - STATE ID-6465 Organizations: EAST NOBLE SCHOOL CORP (SCHOOL DISTRICT)
ROME CITY WWTP (10410 N 150 E in ROME CITY, IN)
STATE MASTER (Indiana facility tracking) National Pollutant Discharge Elimination System NON-MAJOR (Tracking pollutant discharge elimination systems) - permit Business SIC classification: SEWERAGE SYSTEMS Organizations: WADE BRINKMAN (CONTACT/OPERATOR)
, TOWN COUNCIL PRESIDENT (CONTACT/OWNER)
Alternative names: ROME CITY MUNICIPAL STP
Housing units lacking complete plumbing facilities: 5.1%
66.3%Utility gas
17.7%Bottled, tank, or LP gas
12.0%Electricity
3.7%Wood
0.6%Coal or coke
Population in 1990: 3,040.
Place of birth for U.S.-born residents:
This state: 1,591
Northeast: 25
Midwest: 228
South: 155
West: 15
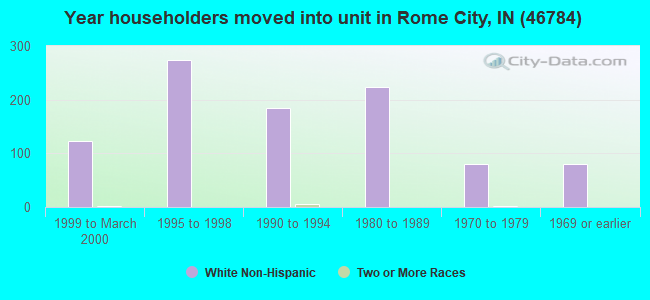
63% of the 46784 zip code residents lived in the same house 5 years ago. Out of people who lived in different houses, 57% lived in this county. Out of people who lived in different counties, 50% lived in Indiana.
88% of the 46784 zip code residents lived in the same house 1 year ago. Out of people who lived in different houses, 28% moved from this county. Out of people who lived in different houses, 67% moved from different county within same state. Out of people who lived in different houses, 5% moved from different state.
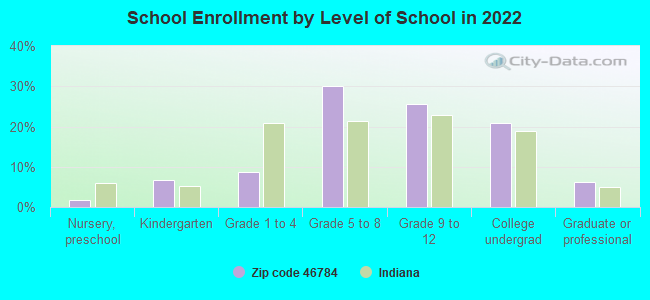
Private vs. public school enrollment:
Students in private schools in grades 1 to 8 (elementary and middle school): 22
Here:
23.5%
Indiana:
14.9%
Students in private schools in grades 9 to 12 (high school): 10
Here:
17.4%
Indiana:
11.4%
Students in private undergraduate colleges:
Here:
1.9%
Indiana:
22.3%
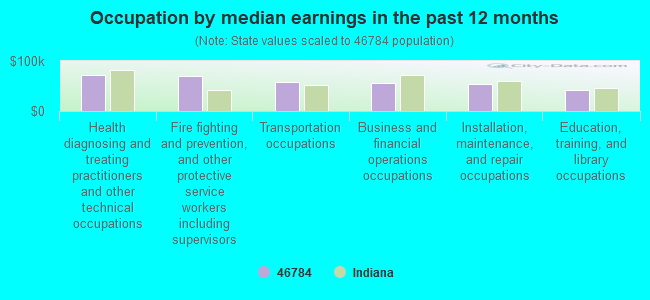
Occupation by median earnings in the past 12 months ($)
72,642Health diagnosing and treating practitioners and other technical occupations
70,719Fire fighting and prevention, and other protective service workers including supervisors
57,389Transportation occupations
55,095Business and financial operations occupations
54,815Installation, maintenance, and repair occupations
42,047Education, training, and library occupations
Top industries in this zip code by the number of employees in 2005:
Wholesale Trade: Other Grocery and Related Products Merchant Wholesalers (20-49 employees: 1 establishment)
Administrative and Support and Waste Management and Remediation Services: Landscaping Services (10-19: 1, 5-9: 1, 1-4: 1)
Accommodation and Food Services: Full-Service Restaurants (10-19: 1, 1-4: 2)
Construction: Masonry Contractors (10-19: 1)
Professional, Scientific, and Technical Services: Veterinary Services (5-9: 1)
Fatal accident statistics in 2010:
Fatal accident count: 1
Vehicles involved in fatal accidents: 2
Fatal accidents caused by drunken drivers: 0
Fatalities: 1
Persons involved in fatal accidents: 3
Pedestrians involved in fatal accidents: 0
2002 - 2018 National Fire Incident Reporting System (NFIRS) incidents
Based on the data from the years 2002 - 2018 the average number of fire incidents per year is 10. The highest number of reported fires - 28 took place in 2008, and the least - 0 in 2016. The data has a dropping trend.
When looking into fire subcategories, the most incidents belonged to: Structure Fires (41.9%), and Outside Fires (41.9%).
Fire incident types reported to NFIRS in Zip Code 46784


 Nearest zip codes: 46795, 46794, 46786, 46755, 46761, 46701.
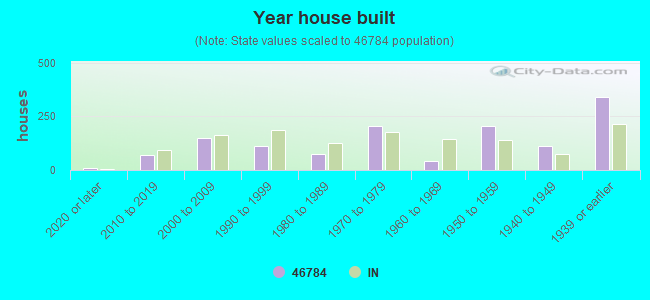


 Based on the data from the years 2002 - 2018 the average number of fire incidents per year is 10. The highest number of reported fires - 28 took place in 2008, and the least - 0 in 2016. The data has a dropping trend.
 When looking into fire subcategories, the most incidents belonged to: Structure Fires (41.9%), and Outside Fires (41.9%).