Estimated zip code population in 2022: 1,152 Zip code population in 2010: 1,329 Zip code population in 2000: 1,379
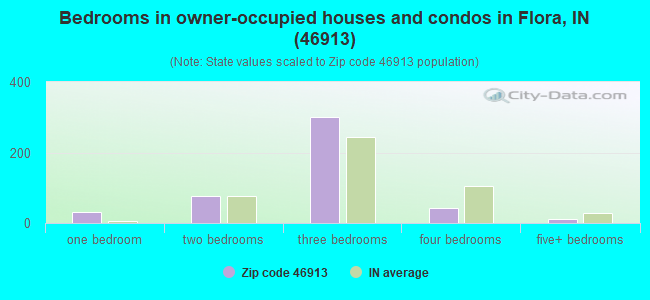
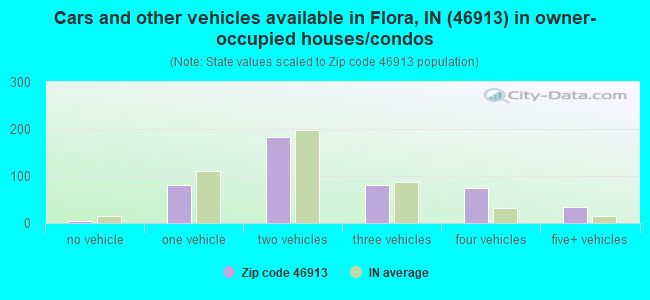
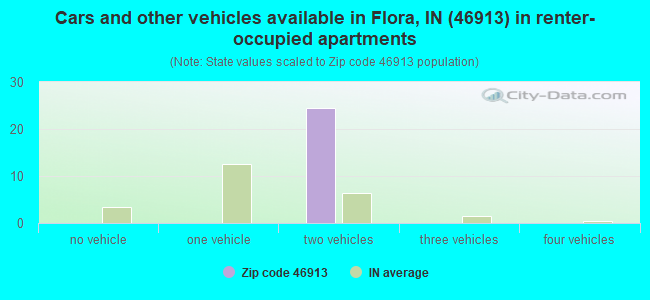
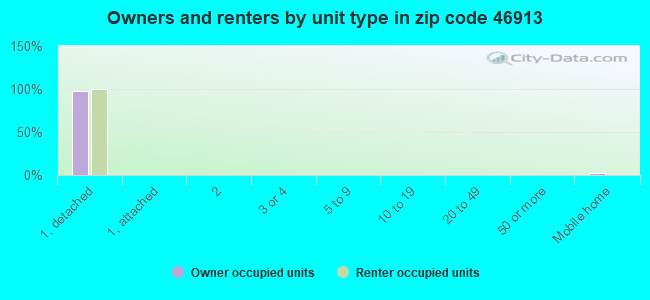
Houses and condos: 517 Renter-occupied apartments: 25
% of renters here:
5%
State:
29%
March 2022 cost of living index in zip code 46913: 82.7 (low, U.S. average is 100)
Land area: 32.9 sq. mi. Water area: 0.0 sq. mi.
Population density: 35 people per square mile
(very low).
OSM Map
General Map
Google Map
MSN Map
OSM Map
General Map
Google Map
MSN Map
OSM Map
General Map
Google Map
MSN Map
OSM Map
General Map
Google Map
MSN Map
Please wait while loading the map...
Real estate property taxes paid for housing units in 2022:
This zip code:
0.6% ($1,113)
Indiana:
0.7% ($1,467)
Median real estate property taxes paid for housing units with mortgages in 2022: $1,352 (0.7%) Median real estate property taxes paid for housing units with no mortgage in 2022: $798 (0.6%)
Business Search- 14 Million verified businesses
Males: 677
(58.8%)
Females: 475
(41.2%)
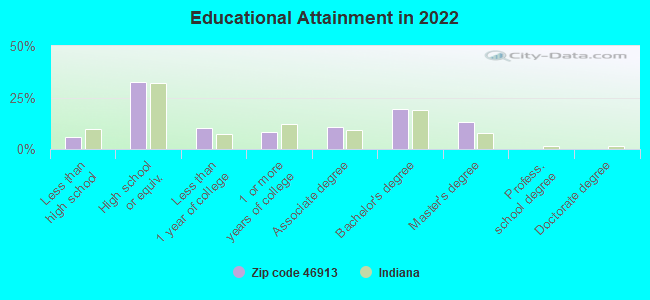
For population 25 years and over in 46913:
High school or higher: 94.6%
Bachelor's degree or higher: 32.5%
Graduate or professional degree: 13.2%
Unemployed: 1.6%
Mean travel time to work (commute): 28.6 minutes
For population 15 years and over in 46913:
Never married: 16.6%
Now married: 65.2%
Separated: 0.0%
Widowed: 11.0%
Divorced: 7.1%
Zip code 46913 compared to state average:
Unemployed percentage below state average.
Black race population percentage significantly below state average.
Hispanic race population percentage significantly below state average.
Foreign-born population percentage significantly below state average.
Renting percentage significantly below state average.
Length of stay since moving in significantly above state average.
Estimated median house/condo value in 2022: $184,488
46913:
$184,488
Indiana:
$208,700
Median resident age:
This zip code:
40.6 years
Indiana median age:
38.2 years
Average household size:
This zip code:
2.4 people
Indiana:
2.4 people
Averages for the 2020 tax year for zip code 46913, filed in 2021:
Average Adjusted Gross Income (AGI) in 2020: $65,297 (Individual Income Tax Returns)
Here:
$65,297
State:
$64,978
Salary/wage: $55,663 (reported on 81.0% of returns)
Here:
$55,663
State:
$55,245
(% of AGI for various income ranges: 971.5% for AGIs below $25k, 3171.0% for AGIs $25k-50k, 6313.3% for AGIs $50k-75k, 7351.7% for AGIs $75k-100k, 17326.2% for AGIs $100k-200k)
Taxable interest for individuals: $767 (reported on 33.3% of returns)
This zip code:
$767
Indiana:
$1,351
(% of AGI for various income ranges: 12.3% for AGIs below $25k, 27.0% for AGIs $25k-50k, 56.7% for AGIs $50k-75k, 16.7% for AGIs $75k-100k, 71.2% for AGIs $100k-200k)
Ordinary dividends: $2,275 (reported on 19.0% of returns)
Here:
$2,275
State:
$5,827
(% of AGI for various income ranges: 45.0% for AGIs $25k-50k, 135.6% for AGIs $50k-75k, 132.5% for AGIs $100k-200k)
Net capital gain/loss in AGI: +$2,980 (reported on 15.9% of returns)
Here:
+$2,980
State:
+$17,730
(% of AGI for various income ranges: 16.9% for AGIs below $25k, 88.9% for AGIs $50k-75k, 245.0% for AGIs $100k-200k)
Profit/loss from business: +$6,662 (reported on 12.7% of returns)
Here:
+$6,662
State:
+$12,144
(% of AGI for various income ranges: 83.8% for AGIs below $25k, 203.3% for AGIs $50k-75k, 301.2% for AGIs $100k-200k)
Taxable individual retirement arrangement distribution: $9,857 (reported on 11.1% of returns)
46913:
$9,857
Indiana:
$18,302
(% of AGI for various income ranges: 142.3% for AGIs below $25k, 267.8% for AGIs $50k-75k, 330.0% for AGIs $100k-200k)
Total itemized deductions: $21,733 (reported on 4.8% of returns)
Here:
$21,733
State:
$35,601
(% of AGI for various income ranges: 815.0% for AGIs $100k-200k)
Taxes paid: $6,400 (reported on 4.8% of returns)
46913:
$6,400
State:
$7,542
(% of AGI for various income ranges: 240.0% for AGIs $100k-200k)
Earned income credit: $2,043 (reported on 11.1% of returns)
Here:
$2,043
State:
$2,298
(% of AGI for various income ranges: 63.8% for AGIs below $25k, 60.0% for AGIs $25k-50k)
Percentage of individuals using paid preparers for their 2020 taxes: 95.2%
Here:
95%
State:
94%
(% for various income ranges: 89.5% for AGIs below $25k, 100.0% for AGIs $25k-50k, 100.0% for AGIs $50k-75k, 85.7% for AGIs $75k-100k, 100.0% for AGIs $100k-200k)
Averages for the 2012 tax year for zip code 46913, filed in 2013:
Average Adjusted Gross Income (AGI) in 2012: $60,267 (Individual Income Tax Returns)
Here:
$60,267
State:
$52,932
Salary/wage: $45,298 (reported on 87.3% of returns)
Here:
$45,298
State:
$45,173
(% of AGI for various income ranges: 70.3% for AGIs below $25k, 69.2% for AGIs $25k-50k, 77.1% for AGIs $50k-75k, 75.3% for AGIs $75k-100k, 93.8% for AGIs $100k-200k)
Taxable interest for individuals: $1,259 (reported on 34.9% of returns)
This zip code:
$1,259
Indiana:
$1,311
(% of AGI for various income ranges: 1.2% for AGIs below $25k, 0.8% for AGIs $25k-50k, 0.4% for AGIs $50k-75k, 0.1% for AGIs $75k-100k, 1.8% for AGIs $100k-200k)
Ordinary dividends: $1,982 (reported on 17.5% of returns)
Here:
$1,982
State:
$4,690
(% of AGI for various income ranges: 0.6% for AGIs $25k-50k, 1.0% for AGIs $50k-75k, 1.2% for AGIs $100k-200k)
Net capital gain/loss in AGI: +$3,275 (reported on 12.7% of returns)
Here:
+$3,275
State:
+$10,406
(% of AGI for various income ranges: 2.9% for AGIs $100k-200k)
Profit/loss from business: +$5,012 (reported on 12.7% of returns)
Here:
+$5,012
State:
+$11,105
(% of AGI for various income ranges: 3.4% for AGIs below $25k, 4.1% for AGIs $25k-50k, 1.5% for AGIs $75k-100k)
Taxable individual retirement arrangement distribution: $9,817 (reported on 9.5% of returns)
46913:
$9,817
Indiana:
$13,841
Total itemized deductions: $18,344 (17% of AGI, reported on 28.6% of returns)
Here:
$18,344
State:
$20,913
Here:
16.8% of AGI
State:
18.2% of AGI
(% of AGI for various income ranges: 17.9% for AGIs below $25k, 7.4% for AGIs $50k-75k, 9.5% for AGIs $75k-100k, 17.8% for AGIs $100k-200k)
Charity contributions: $3,857 (reported on 22.2% of returns)
Here:
$3,857
State:
$4,697
(% of AGI for various income ranges: 1.5% for AGIs $50k-75k, 1.7% for AGIs $75k-100k, 3.2% for AGIs $100k-200k)
Taxes paid: $6,478 (reported on 28.6% of returns)
46913:
$6,478
State:
$7,456
(% of AGI for various income ranges: 3.0% for AGIs below $25k, 1.9% for AGIs $50k-75k, 2.9% for AGIs $75k-100k, 7.8% for AGIs $100k-200k)
Earned income credit: $2,062 (reported on 12.7% of returns)
Here:
$2,062
State:
$2,265
(% of AGI for various income ranges: 5.7% for AGIs below $25k, 0.8% for AGIs $25k-50k)
Percentage of individuals using paid preparers for their 2012 taxes: 61.9%
Here:
62%
State:
53%
(% for various income ranges: 57.9% for AGIs below $25k, 53.3% for AGIs $25k-50k, 63.6% for AGIs $50k-75k, 62.5% for AGIs $75k-100k, 100.0% for AGIs $100k-200k)
Averages for the 2004 tax year for zip code 46913, filed in 2005:
Average Adjusted Gross Income (AGI) in 2004: $48,627 (Individual Income Tax Returns)
Here:
$48,627
State:
$44,790
Salary/wage: $41,619 (reported on 88.5% of returns)
Here:
$41,619
State:
$39,615
(% of AGI for various income ranges: 107.1% for AGIs below $10k, 64.8% for AGIs $10k-25k, 73.8% for AGIs $25k-50k, 84.0% for AGIs $50k-75k, 81.3% for AGIs $75k-100k, 67.3% for AGIs over 100k)
Taxable interest for individuals: $1,761 (reported on 52.3% of returns)
This zip code:
$1,761
Indiana:
$1,535
(% of AGI for various income ranges: 7.1% for AGIs below $10k, 3.7% for AGIs $10k-25k, 1.9% for AGIs $25k-50k, 1.1% for AGIs $50k-75k, 2.1% for AGIs $75k-100k, 1.8% for AGIs over 100k)
Taxable dividends: $1,088 (reported on 22.5% of returns)
Here:
$1,088
State:
$2,998
(% of AGI for various income ranges: 1.9% for AGIs $10k-25k, 0.4% for AGIs $25k-50k, 0.1% for AGIs $50k-75k, 0.2% for AGIs $75k-100k, 0.9% for AGIs over 100k)
Net capital gain/loss: +$1,703 (reported on 16.6% of returns)
Here:
+$1,703
State:
+$8,619
(% of AGI for various income ranges: -2.1% for AGIs below $10k, -0.3% for AGIs $10k-25k, -0.1% for AGIs $25k-50k, -0.1% for AGIs $50k-75k, -0.0% for AGIs $75k-100k, 2.3% for AGIs over 100k)
Profit/loss from business: +$5,547 (reported on 17.4% of returns)
Here:
+$5,547
State:
+$10,071
(% of AGI for various income ranges: 12.8% for AGIs $10k-25k, 4.9% for AGIs $25k-50k, 0.7% for AGIs $50k-75k, 0.8% for AGIs $75k-100k, -0.3% for AGIs over 100k)
Profit/loss from farming: +$1,500 (reported on 4.3% of returns)
Here:
+$1,500
State:
-$2,212
IRA payment deduction: $3,765 (reported on 2.8% of returns)
46913:
$3,765
Indiana:
$2,840
Total itemized deductions: $16,030 (20% of AGI, reported on 32.7% of returns)
Here:
$16,030
State:
$17,065
Here:
20.3% of AGI
State:
19.5% of AGI
(% of AGI for various income ranges: 12.7% for AGIs $10k-25k, 9.1% for AGIs $25k-50k, 8.4% for AGIs $50k-75k, 12.3% for AGIs $75k-100k, 12.8% for AGIs over 100k)
Charity contributions deductions: $3,429 (4% of AGI, reported on 28.0% of returns)
Here:
$3,429
State:
$3,550
Here:
4.2% of AGI
State:
3.8% of AGI
(% of AGI for various income ranges: 2.3% for AGIs $10k-25k, 1.5% for AGIs $25k-50k, 1.0% for AGIs $50k-75k, 1.8% for AGIs $75k-100k, 3.2% for AGIs over 100k)
Total tax: $6,198 (reported on 81.6% of returns)
46913:
$6,198
State:
$6,914
(% of AGI for various income ranges: 3.4% for AGIs below $10k, 5.0% for AGIs $10k-25k, 7.2% for AGIs $25k-50k, 8.2% for AGIs $50k-75k, 10.6% for AGIs $75k-100k, 15.6% for AGIs over 100k)
Earned income credit: $1,711 (reported on 6.2% of returns)
Here:
$1,711
State:
$1,685
Percentage of individuals using paid preparers for their 2004 taxes: 65.5%
Here:
65%
State:
59%
(% for various income ranges: 48.1% for AGIs below $10k, 69.6% for AGIs $10k-25k, 69.9% for AGIs $25k-50k, 66.1% for AGIs $50k-75k, 75.4% for AGIs $75k-100k, 64.5% for AGIs over 100k)
Household received Food Stamps/SNAP in the past 12 months: 0 Household did not receive Food Stamps/SNAP in the past 12 months: 479
Women who had a birth in the past 12 months: 70 (76 now married, 0 unmarried) Women who did not have a birth in the past 12 months: 166 (100 now married, 66 unmarried)
Housing units in zip code 46913 with a mortgage: 255 (38 second mortgage, 39 both second mortgage and home equity loan) Houses without a mortgage: 57
Median monthly owner costs for units with a mortgage: $1,335 Median monthly owner costs for units without a mortgage: $379
Residents with income below the poverty level in 2022:
This zip code:
5.3%
Whole state:
12.6%
Residents with income below 50% of the poverty level in 2022:
This zip code:
4.7%
Whole state:
6.3%
Median number of rooms in houses and condos:
Here:
7.1
State:
6.6
Notable locations in this zip code not listed on our city pages
Size of family households: 150 2-persons, 103 3-persons, 22 4-persons, 44 5-persons, 10 6-persons
Size of nonfamily households: 125 1-person, 24 2-persons
243 married couples with children.
24 single-parent households (24 men).
99.1% of residents of 46913 zip code speak English at home.
0.5% of residents speak other Indo-European language at home (100% well).
Foreign born population: 0 (0.0%)
:
0.0%
Whole state:
6.1%
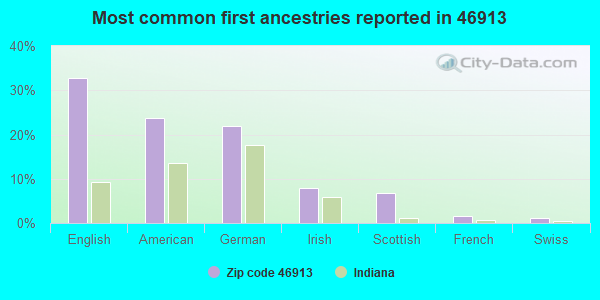
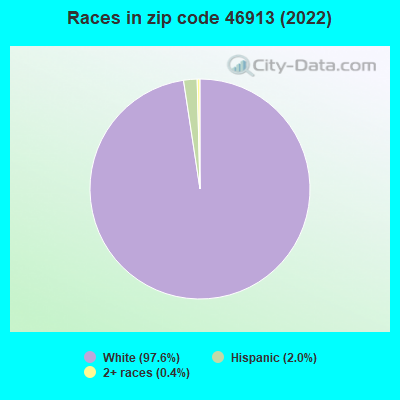
33%English
24%American
22%German
8%Irish
7%Scottish
1%French
1%Swiss
Facilities with environmental interests located in this zip code:
BRINGHURST PLANT FOOD (1921 S SR 75 in BRINGHURST, IN)
STATE MASTER (Indiana facility tracking) - CRTK-4418, EPCRA STATE MASTER (Indiana facility tracking) - CRTK-9455, EPCRA COMPLIANCE ACTIVITY (Tracking inspections of insecticide, fungicide, and rodenticide, and toxic substances) HAZARDOUS WASTE BIENNIAL REPORTER (Resource Conservation and Recovery Act (tracking hazardous waste)) (Resource Conservation and Recovery Act (tracking hazardous waste)) Organizations: TERRA INTERNATIONAL INC (CONTACT/OWNER)
Alternative names: TERRA INTERNATIONAL INC
Housing units lacking complete kitchen facilities: 1.7%
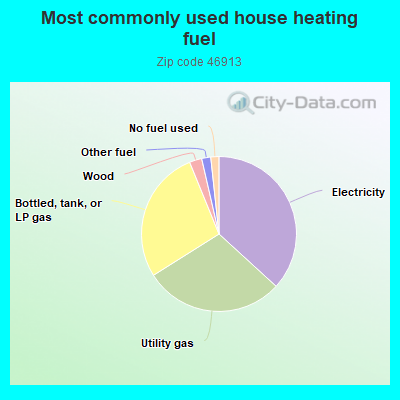
37.0%Electricity
29.4%Utility gas
27.9%Bottled, tank, or LP gas
2.6%Wood
1.9%Other fuel
1.7%No fuel used
Population in 1990: 212. Population change in the 1990s: +1,167 (+550.5%).
Place of birth for U.S.-born residents:
This state: 936
Northeast: 10
Midwest: 137
South: 36
West: 24
70% of the 46913 zip code residents lived in the same house 5 years ago. Out of people who lived in different houses, 48% lived in this county. Out of people who lived in different counties, 50% lived in Indiana.
99% of the 46913 zip code residents lived in the same house 1 year ago. Out of people who lived in different houses, 50% moved from this county. Out of people who lived in different houses, 100% moved from different county within same state.
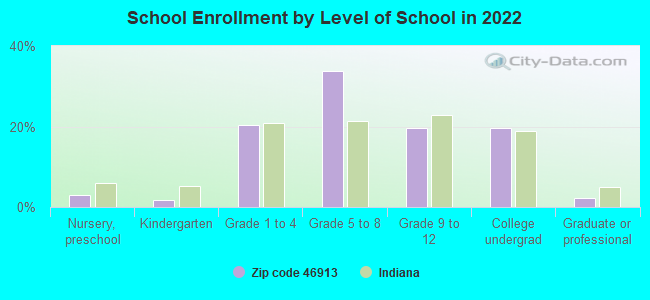
Private vs. public school enrollment:
Students in private schools in grades 1 to 8 (elementary and middle school): 8
Here:
5.7%
Indiana:
14.9%
Students in private schools in grades 9 to 12 (high school): 9
Here:
16.6%
Indiana:
11.4%
Students in private undergraduate colleges: 10
Here:
19.3%
Indiana:
22.3%
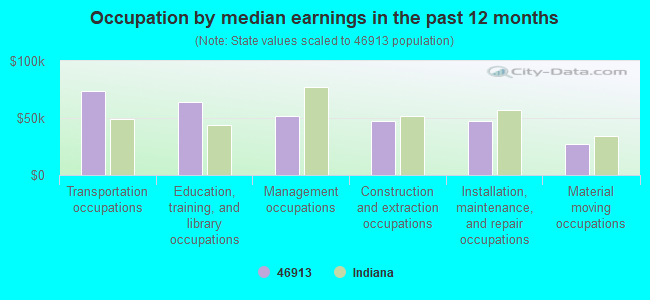
Occupation by median earnings in the past 12 months ($)
73,259Transportation occupations
64,327Education, training, and library occupations
52,028Management occupations
47,804Construction and extraction occupations
47,659Installation, maintenance, and repair occupations
27,471Material moving occupations
Companies with federal contracts located in this zip code:
B & B ENGINEERING CO, INC (7102 E 300 S in BRINGHURST, IN; small business) : $82,623 in 2 contractsfrom 2003 to 2005
$43,610 with Navy for Studs. Signed on 2005-12-08. Completion date: 2006-03-31.
$39,013 with Navy for Miscellaneous Ammunition. Signed on 2003-11-06. Completion date: 2004-01-20.
Top industries in this zip code by the number of employees in 2005:


+$1,500
-$2,212
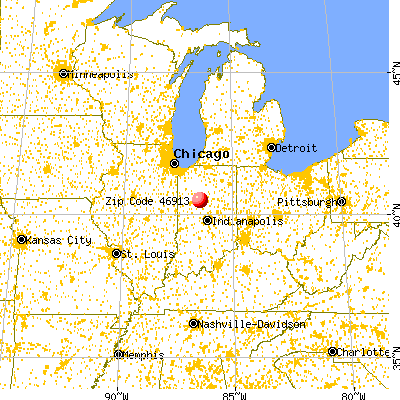
 Nearest zip codes: 46920, 46929, 46915, 46917, 46065, 46998.