Estimated zip code population in 2022: 2,402 Zip code population in 2010: 3,200 Zip code population in 2000: 3,411
Houses and condos: 1,272 Renter-occupied apartments: 240
% of renters here:
20%
State:
29%
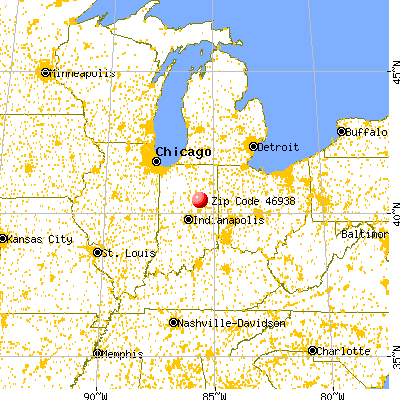
March 2022 cost of living index in zip code 46938: 76.8 (low, U.S. average is 100)
Land area: 31.0 sq. mi. Water area: 0.0 sq. mi.
Population density: 78 people per square mile
(very low).
OSM Map
General Map
Google Map
MSN Map
OSM Map
General Map
Google Map
MSN Map
OSM Map
General Map
Google Map
MSN Map
OSM Map
General Map
Google Map
MSN Map
Please wait while loading the map...
Real estate property taxes paid for housing units in 2022:
This zip code:
1.0% ($993)
Indiana:
0.7% ($1,467)
Median real estate property taxes paid for housing units with mortgages in 2022: $1,047 (1.1%) Median real estate property taxes paid for housing units with no mortgage in 2022: $816 (0.8%)
Business Search- 14 Million verified businesses
Males: 1,229
(51.2%)
Females: 1,172
(48.8%)
For population 25 years and over in 46938:
High school or higher: 89.9%
Bachelor's degree or higher: 13.8%
Graduate or professional degree: 3.9%
Unemployed: 3.2%
Mean travel time to work (commute): 22.6 minutes
For population 15 years and over in 46938:
Never married: 24.5%
Now married: 49.9%
Separated: 1.0%
Widowed: 8.5%
Divorced: 16.1%
Zip code 46938 compared to state average:
Median household income below state average.
Median house value below state average.
Black race population percentage significantly below state average.
Hispanic race population percentage below state average.
Median age above state average.
Foreign-born population percentage significantly below state average.
Length of stay since moving in significantly above state average.
House age above state average.
Number of college students below state average.
Percentage of population with a bachelor's degree or higher below state average.
Estimated median house/condo value in 2022: $98,212
46938:
$98,212
Indiana:
$208,700
Median resident age:
This zip code:
44.8 years
Indiana median age:
38.2 years
Average household size:
This zip code:
2.0 people
Indiana:
2.4 people
Averages for the 2020 tax year for zip code 46938, filed in 2021:
Average Adjusted Gross Income (AGI) in 2020: $46,087 (Individual Income Tax Returns)
Here:
$46,087
State:
$64,978
Salary/wage: $43,048 (reported on 79.7% of returns)
Here:
$43,048
State:
$55,245
(% of AGI for various income ranges: 1048.9% for AGIs below $25k, 3519.0% for AGIs $25k-50k, 6176.9% for AGIs $50k-75k, 9523.8% for AGIs $75k-100k, 14937.8% for AGIs $100k-200k)
Taxable interest for individuals: $684 (reported on 28.6% of returns)
This zip code:
$684
Indiana:
$1,351
(% of AGI for various income ranges: 14.7% for AGIs below $25k, 38.1% for AGIs $25k-50k, 30.6% for AGIs $50k-75k, 5.0% for AGIs $75k-100k, 40.0% for AGIs $100k-200k)
Ordinary dividends: $1,650 (reported on 10.5% of returns)
Here:
$1,650
State:
$5,827
(% of AGI for various income ranges: 13.1% for AGIs below $25k, 19.4% for AGIs $25k-50k, 50.6% for AGIs $50k-75k, 47.8% for AGIs $100k-200k)
Net capital gain/loss in AGI: +$2,592 (reported on 9.8% of returns)
Here:
+$2,592
State:
+$17,730
(% of AGI for various income ranges: 3.9% for AGIs below $25k, 28.4% for AGIs $25k-50k, 40.0% for AGIs $50k-75k, 190.0% for AGIs $100k-200k)
Profit/loss from business: +$6,050 (reported on 10.5% of returns)
Here:
+$6,050
State:
+$12,144
(% of AGI for various income ranges: 84.7% for AGIs below $25k, 51.9% for AGIs $25k-50k, 98.8% for AGIs $50k-75k, 278.8% for AGIs $75k-100k)
Taxable individual retirement arrangement distribution: $11,007 (reported on 10.5% of returns)
46938:
$11,007
Indiana:
$18,302
(% of AGI for various income ranges: 66.9% for AGIs below $25k, 115.5% for AGIs $25k-50k, 285.6% for AGIs $50k-75k, 606.2% for AGIs $75k-100k)
Taxes paid: $6,800 (reported on 1.5% of returns)
46938:
$6,800
State:
$7,542
(% of AGI for various income ranges: 43.9% for AGIs $25k-50k)
Earned income credit: $2,222 (reported on 20.3% of returns)
Here:
$2,222
State:
$2,298
(% of AGI for various income ranges: 95.3% for AGIs below $25k, 82.9% for AGIs $25k-50k)
Percentage of individuals using paid preparers for their 2020 taxes: 94.0%
Here:
94%
State:
94%
(% for various income ranges: 91.8% for AGIs below $25k, 92.3% for AGIs $25k-50k, 95.2% for AGIs $50k-75k, 100.0% for AGIs $75k-100k, 100.0% for AGIs $100k-200k)
Averages for the 2012 tax year for zip code 46938, filed in 2013:
Average Adjusted Gross Income (AGI) in 2012: $39,406 (Individual Income Tax Returns)
Here:
$39,406
State:
$52,932
Salary/wage: $33,979 (reported on 82.9% of returns)
Here:
$33,979
State:
$45,173
(% of AGI for various income ranges: 66.7% for AGIs below $25k, 75.8% for AGIs $25k-50k, 74.4% for AGIs $50k-75k, 82.3% for AGIs $75k-100k, 58.7% for AGIs $100k-200k)
Taxable interest for individuals: $712 (reported on 29.5% of returns)
This zip code:
$712
Indiana:
$1,311
(% of AGI for various income ranges: 1.2% for AGIs below $25k, 0.4% for AGIs $25k-50k, 0.6% for AGIs $50k-75k, 0.2% for AGIs $75k-100k, 0.4% for AGIs $100k-200k)
Ordinary dividends: $1,185 (reported on 13.7% of returns)
Here:
$1,185
State:
$4,690
(% of AGI for various income ranges: 0.6% for AGIs below $25k, 0.7% for AGIs $25k-50k, 0.1% for AGIs $50k-75k, 0.2% for AGIs $75k-100k, 0.5% for AGIs $100k-200k)
Net capital gain/loss in AGI: +$915 (reported on 8.9% of returns)
Here:
+$915
State:
+$10,406
(% of AGI for various income ranges: 1.4% for AGIs $75k-100k)
Profit/loss from business: +$7,513 (reported on 10.3% of returns)
Here:
+$7,513
State:
+$11,105
(% of AGI for various income ranges: 4.3% for AGIs below $25k, 2.5% for AGIs $25k-50k, 2.1% for AGIs $50k-75k, 1.5% for AGIs $100k-200k)
Taxable individual retirement arrangement distribution: $9,659 (reported on 11.6% of returns)
46938:
$9,659
Indiana:
$13,841
(% of AGI for various income ranges: 4.5% for AGIs below $25k, 4.2% for AGIs $25k-50k, 2.7% for AGIs $50k-75k, 3.7% for AGIs $75k-100k)
Total itemized deductions: $17,146 (21% of AGI, reported on 16.4% of returns)
Here:
$17,146
State:
$20,913
Here:
21.4% of AGI
State:
18.2% of AGI
(% of AGI for various income ranges: 3.8% for AGIs below $25k, 4.8% for AGIs $25k-50k, 6.5% for AGIs $50k-75k, 9.7% for AGIs $75k-100k, 10.2% for AGIs $100k-200k)
Charity contributions: $5,241 (reported on 11.6% of returns)
Here:
$5,241
State:
$4,697
(% of AGI for various income ranges: 1.7% for AGIs $25k-50k, 1.4% for AGIs $50k-75k, 1.8% for AGIs $75k-100k, 2.3% for AGIs $100k-200k)
Taxes paid: $5,658 (reported on 16.4% of returns)
46938:
$5,658
State:
$7,456
(% of AGI for various income ranges: 0.4% for AGIs below $25k, 1.1% for AGIs $25k-50k, 1.6% for AGIs $50k-75k, 3.2% for AGIs $75k-100k, 4.9% for AGIs $100k-200k)
Earned income credit: $2,373 (reported on 20.5% of returns)
Here:
$2,373
State:
$2,265
(% of AGI for various income ranges: 6.7% for AGIs below $25k, 1.3% for AGIs $25k-50k)
Percentage of individuals using paid preparers for their 2012 taxes: 47.9%
Here:
48%
State:
53%
(% for various income ranges: 40.3% for AGIs below $25k, 51.4% for AGIs $25k-50k, 52.4% for AGIs $50k-75k, 58.3% for AGIs $75k-100k, 66.7% for AGIs $100k-200k)
Averages for the 2004 tax year for zip code 46938, filed in 2005:
Average Adjusted Gross Income (AGI) in 2004: $36,109 (Individual Income Tax Returns)
Here:
$36,109
State:
$44,790
Salary/wage: $32,516 (reported on 87.1% of returns)
Here:
$32,516
State:
$39,615
(% of AGI for various income ranges: 94.3% for AGIs below $10k, 70.1% for AGIs $10k-25k, 79.0% for AGIs $25k-50k, 82.0% for AGIs $50k-75k, 85.9% for AGIs $75k-100k, 69.7% for AGIs over 100k)
Taxable interest for individuals: $905 (reported on 42.7% of returns)
This zip code:
$905
Indiana:
$1,535
(% of AGI for various income ranges: 2.9% for AGIs below $10k, 2.8% for AGIs $10k-25k, 1.2% for AGIs $25k-50k, 0.5% for AGIs $50k-75k, 0.4% for AGIs $75k-100k, 0.9% for AGIs over 100k)
Taxable dividends: $689 (reported on 17.0% of returns)
Here:
$689
State:
$2,998
(% of AGI for various income ranges: 1.1% for AGIs below $10k, 0.6% for AGIs $10k-25k, 0.3% for AGIs $25k-50k, 0.2% for AGIs $50k-75k, 0.1% for AGIs $75k-100k, 0.5% for AGIs over 100k)
Net capital gain/loss: +$3,481 (reported on 9.4% of returns)
Here:
+$3,481
State:
+$8,619
(% of AGI for various income ranges: 0.4% for AGIs $10k-25k, -0.0% for AGIs $25k-50k, 0.2% for AGIs $50k-75k, 0.2% for AGIs $75k-100k, 4.2% for AGIs over 100k)
Profit/loss from business: +$4,527 (reported on 10.2% of returns)
Here:
+$4,527
State:
+$10,071
(% of AGI for various income ranges: 2.0% for AGIs $10k-25k, 2.7% for AGIs $25k-50k, 0.8% for AGIs $50k-75k, 1.5% for AGIs $75k-100k, -0.6% for AGIs over 100k)
IRA payment deduction: $2,321 (reported on 1.9% of returns)
46938:
$2,321
Indiana:
$2,840
Total itemized deductions: $13,695 (20% of AGI, reported on 18.5% of returns)
Here:
$13,695
State:
$17,065
Here:
19.6% of AGI
State:
19.5% of AGI
(% of AGI for various income ranges: 4.9% for AGIs $10k-25k, 5.7% for AGIs $25k-50k, 7.5% for AGIs $50k-75k, 9.3% for AGIs $75k-100k, 8.4% for AGIs over 100k)
Charity contributions deductions: $3,277 (4% of AGI, reported on 14.8% of returns)
Here:
$3,277
State:
$3,550
Here:
4.3% of AGI
State:
3.8% of AGI
(% of AGI for various income ranges: 0.9% for AGIs $10k-25k, 0.9% for AGIs $25k-50k, 1.1% for AGIs $50k-75k, 2.3% for AGIs $75k-100k, 1.8% for AGIs over 100k)
Total tax: $4,608 (reported on 71.4% of returns)
46938:
$4,608
State:
$6,914
(% of AGI for various income ranges: 1.9% for AGIs below $10k, 3.4% for AGIs $10k-25k, 6.1% for AGIs $25k-50k, 9.4% for AGIs $50k-75k, 10.7% for AGIs $75k-100k, 16.3% for AGIs over 100k)
Earned income credit: $1,647 (reported on 18.7% of returns)
Here:
$1,647
State:
$1,685
Percentage of individuals using paid preparers for their 2004 taxes: 59.5%
Here:
60%
State:
59%
(% for various income ranges: 49.0% for AGIs below $10k, 62.8% for AGIs $10k-25k, 62.4% for AGIs $25k-50k, 54.9% for AGIs $50k-75k, 62.2% for AGIs $75k-100k, 80.0% for AGIs over 100k)
Likely homosexual households (counted as self-reported same-sex unmarried-partner households)
Lesbian couples: 0.6% of all households
Gay men: 0.0% of all households
Household received Food Stamps/SNAP in the past 12 months: 145 Household did not receive Food Stamps/SNAP in the past 12 months: 1,057
Women who had a birth in the past 12 months: 13 (14 now married, 0 unmarried) Women who did not have a birth in the past 12 months: 502 (243 now married, 259 unmarried)
Housing units in zip code 46938 with a mortgage: 624 (66 second mortgage, 65 both second mortgage and home equity loan) Houses without a mortgage: 26
Median monthly owner costs for units with a mortgage: $910 Median monthly owner costs for units without a mortgage: $503
Residents with income below the poverty level in 2022:
This zip code:
15.6%
Whole state:
12.6%
Residents with income below 50% of the poverty level in 2022:
This zip code:
7.8%
Whole state:
6.3%
Median number of rooms in houses and condos:
Here:
6.6
State:
6.6
Median number of rooms in apartments:
Here:
5.0
State:
4.3
Notable locations in this zip code not listed on our city pages
Streams, rivers, and creeks: Little Deer Creek (A), Shell Run (B), Round Run (C), Regular Run (D), Ethel Run (E), New Prairie Creek (F), Bean Run (G). Display/hide their locations on the map
Size of family households: 415 2-persons, 174 3-persons, 95 4-persons, 51 5-persons, 3 6-persons
Size of nonfamily households: 433 1-person, 25 2-persons, 3 3-persons
258 married couples with children.
180 single-parent households (29 men, 151 women).
97.1% of residents of 46938 zip code speak English at home.
2.3% of residents speak Spanish at home (100% very well).
0.3% of residents speak other language at home (100% very well).
Foreign born population: 16 (0.7%) (54.6% of them are naturalized citizens)
This zip code:
0.7%
Whole state:
6.1%
12%Azores Islands
12%Honduras
23%American
14%English
11%German
7%Irish
6%European
3%Italian
1%Scotch-Irish
Year of entry for the foreign-born population
22010 or later
52000 to 2009
01990 to 1999
19Before 1990
Facilities with environmental interests located in this zip code:
SHAFER ENTERPRISES (PO BOX 712 in JONESBORO, IN)
(Integrated Compliance Information System) - ICIS-05-2001-0533, FORMAL ENFORCEMENT ACTION STATE MASTER (Indiana facility tracking) Business SIC classification: AIR-CONDITIONING AND WARM AIR HEATING EQUIPMENT AND COMMERCIAL AND INDUSTRIAL REFRIGERATION EQUIPMENT
Housing units lacking complete plumbing facilities: 2.2% Housing units lacking complete kitchen facilities: 1.2%
53.1%Utility gas
27.6%Electricity
13.3%Bottled, tank, or LP gas
3.3%Wood
1.8%Other fuel
1.2%Fuel oil, kerosene, etc.
Population in 1990: 3,989.
Place of birth for U.S.-born residents:
This state: 1,908
Northeast: 12
Midwest: 158
South: 213
West: 62
65% of the 46938 zip code residents lived in the same house 5 years ago. Out of people who lived in different houses, 76% lived in this county. Out of people who lived in different counties, 50% lived in Indiana.
92% of the 46938 zip code residents lived in the same house 1 year ago. Out of people who lived in different houses, 84% moved from this county. Out of people who lived in different houses, 9% moved from different county within same state. Out of people who lived in different houses, 3% moved from different state. Out of people who lived in different houses, 4% moved from abroad.
Private vs. public school enrollment:
Students in private schools in grades 1 to 8 (elementary and middle school): 4
Here:
2.2%
Indiana:
14.9%
Students in private schools in grades 9 to 12 (high school): 15
Here:
8.9%
Indiana:
11.4%
Students in private undergraduate colleges: 11
Here:
28.0%
Indiana:
22.3%
Occupation by median earnings in the past 12 months ($)
72,652Construction and extraction occupations
66,317Management occupations
58,635Transportation occupations
57,646Health technologists and technicians
50,461Education, training, and library occupations
48,854Law enforcement workers including supervisors
Top industries in this zip code by the number of employees in 2005:
Other Services (except Public Administration): Religious Organizations (5-9 employees: 1 establishment, 1-4 employees: 5 establishments)
Educational Services: Elementary and Secondary Schools (10-19: 1)
Other Services (except Public Administration): General Automotive Repair (5-9: 1)
Fatal accident statistics in 2013:
Fatal accident count: 1
Vehicles involved in fatal accidents: 1
Fatal accidents caused by drunken drivers: 0
Fatalities: 1
Persons involved in fatal accidents: 1
Pedestrians involved in fatal accidents: 0
Fatal accident statistics in 2011:
Fatal accident count: 1
Vehicles involved in fatal accidents: 2
Fatal accidents caused by drunken drivers: 0
Fatalities: 1
Persons involved in fatal accidents: 2
Pedestrians involved in fatal accidents: 0
2002 - 2018 National Fire Incident Reporting System (NFIRS) incidents
According to the data from the years 2002 - 2018 the average number of fire incidents per year is 15. The highest number of fire incidents - 36 took place in 2007, and the least - 4 in 2017. The data has a dropping trend.
When looking into fire subcategories, the most reports belonged to: Structure Fires (45.7%), and Outside Fires (37.0%).
Fire incident types reported to NFIRS in Zip Code 46938


 Nearest zip codes: 46933, 46953, 46930, 46928, 46070, 46952.


 According to the data from the years 2002 - 2018 the average number of fire incidents per year is 15. The highest number of fire incidents - 36 took place in 2007, and the least - 4 in 2017. The data has a dropping trend.
 When looking into fire subcategories, the most reports belonged to: Structure Fires (45.7%), and Outside Fires (37.0%).