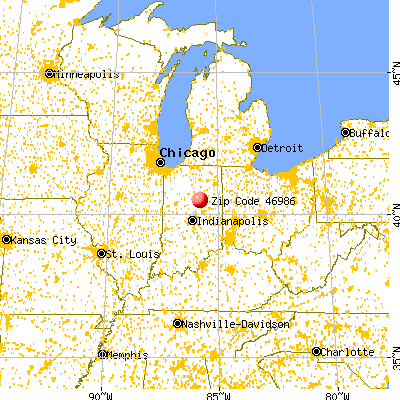
Estimated zip code population in 2022: 1,682 Zip code population in 2010: 1,915 Zip code population in 2000: 1,929
Houses and condos: 783 Renter-occupied apartments: 74
% of renters here:
10%
State:
29%
March 2022 cost of living index in zip code 46986: 84.1 (less than average, U.S. average is 100)
Land area: 34.8 sq. mi. Water area: 0.0 sq. mi.
Population density: 48 people per square mile
(very low).
OSM Map
General Map
Google Map
MSN Map
OSM Map
General Map
Google Map
MSN Map
OSM Map
General Map
Google Map
MSN Map
OSM Map
General Map
Google Map
MSN Map
Please wait while loading the map...
Real estate property taxes paid for housing units in 2022:
This zip code:
0.6% ($923)
Indiana:
0.7% ($1,467)
Median real estate property taxes paid for housing units with mortgages in 2022: $944 (0.6%) Median real estate property taxes paid for housing units with no mortgage in 2022: $894 (0.6%)
Business Search- 14 Million verified businesses
Males: 850
(50.5%)
Females: 832
(49.5%)
For population 25 years and over in 46986:
High school or higher: 91.0%
Bachelor's degree or higher: 17.0%
Graduate or professional degree: 4.7%
Unemployed: 1.8%
Mean travel time to work (commute): 21.6 minutes
For population 15 years and over in 46986:
Never married: 18.2%
Now married: 61.3%
Separated: 0.8%
Widowed: 7.5%
Divorced: 12.2%
Zip code 46986 compared to state average:
Unemployed percentage below state average.
Black race population percentage significantly below state average.
Hispanic race population percentage significantly below state average.
Median age significantly above state average.
Foreign-born population percentage below state average.
Renting percentage significantly below state average.
Length of stay since moving in significantly above state average.
House age above state average.
Percentage of population with a bachelor's degree or higher below state average.
Estimated median house/condo value in 2022: $152,319
46986:
$152,319
Indiana:
$208,700
Median resident age:
This zip code:
46.9 years
Indiana median age:
38.2 years
Average household size:
This zip code:
2.3 people
Indiana:
2.4 people
Averages for the 2020 tax year for zip code 46986, filed in 2021:
Average Adjusted Gross Income (AGI) in 2020: $57,093 (Individual Income Tax Returns)
Here:
$57,093
State:
$64,978
Salary/wage: $50,525 (reported on 77.3% of returns)
Here:
$50,525
State:
$55,245
(% of AGI for various income ranges: 1041.0% for AGIs below $25k, 3458.7% for AGIs $25k-50k, 6185.8% for AGIs $50k-75k, 8912.5% for AGIs $75k-100k, 17905.7% for AGIs $100k-200k)
Taxable interest for individuals: $728 (reported on 33.0% of returns)
This zip code:
$728
Indiana:
$1,351
(% of AGI for various income ranges: 8.5% for AGIs below $25k, 13.3% for AGIs $25k-50k, 47.5% for AGIs $50k-75k, 53.8% for AGIs $75k-100k, 105.7% for AGIs $100k-200k)
Ordinary dividends: $2,100 (reported on 12.5% of returns)
Here:
$2,100
State:
$5,827
(% of AGI for various income ranges: 23.5% for AGIs below $25k, 49.2% for AGIs $50k-75k, 178.6% for AGIs $100k-200k)
Net capital gain/loss in AGI: +$5,764 (reported on 12.5% of returns)
Here:
+$5,764
State:
+$17,730
(% of AGI for various income ranges: 255.8% for AGIs $50k-75k, 482.9% for AGIs $100k-200k)
Profit/loss from business: +$10,218 (reported on 12.5% of returns)
Here:
+$10,218
State:
+$12,144
(% of AGI for various income ranges: 123.0% for AGIs below $25k, 136.7% for AGIs $50k-75k, 112.5% for AGIs $75k-100k, 891.4% for AGIs $100k-200k)
Taxable individual retirement arrangement distribution: $13,589 (reported on 10.2% of returns)
46986:
$13,589
Indiana:
$18,302
(% of AGI for various income ranges: 70.5% for AGIs below $25k, 230.7% for AGIs $25k-50k, 920.0% for AGIs $75k-100k)
Total itemized deductions: $24,600 (reported on 2.3% of returns)
Here:
$24,600
State:
$35,601
(% of AGI for various income ranges: 246.0% for AGIs below $25k)
Earned income credit: $2,355 (reported on 12.5% of returns)
Here:
$2,355
State:
$2,298
(% of AGI for various income ranges: 73.0% for AGIs below $25k, 75.3% for AGIs $25k-50k)
Percentage of individuals using paid preparers for their 2020 taxes: 94.3%
Here:
94%
State:
94%
(% for various income ranges: 89.3% for AGIs below $25k, 94.7% for AGIs $25k-50k, 100.0% for AGIs $50k-75k, 91.7% for AGIs $75k-100k, 100.0% for AGIs $100k-200k)
Averages for the 2012 tax year for zip code 46986, filed in 2013:
Average Adjusted Gross Income (AGI) in 2012: $47,864 (Individual Income Tax Returns)
Here:
$47,864
State:
$52,932
Salary/wage: $41,490 (reported on 80.5% of returns)
Here:
$41,490
State:
$45,173
(% of AGI for various income ranges: 57.8% for AGIs below $25k, 69.8% for AGIs $25k-50k, 80.7% for AGIs $50k-75k, 75.1% for AGIs $75k-100k, 62.7% for AGIs $100k-200k)
Taxable interest for individuals: $883 (reported on 40.2% of returns)
This zip code:
$883
Indiana:
$1,311
(% of AGI for various income ranges: 2.8% for AGIs below $25k, 1.1% for AGIs $25k-50k, 0.1% for AGIs $50k-75k, 0.7% for AGIs $75k-100k, 0.4% for AGIs $100k-200k)
Ordinary dividends: $1,315 (reported on 14.9% of returns)
Here:
$1,315
State:
$4,690
(% of AGI for various income ranges: 0.8% for AGIs below $25k, 0.5% for AGIs $25k-50k, 0.4% for AGIs $50k-75k, 0.5% for AGIs $100k-200k)
Net capital gain/loss in AGI: +$1,025 (reported on 9.2% of returns)
Here:
+$1,025
State:
+$10,406
Profit/loss from business: +$8,400 (reported on 13.8% of returns)
Here:
+$8,400
State:
+$11,105
(% of AGI for various income ranges: 4.2% for AGIs below $25k, 4.2% for AGIs $25k-50k, 2.5% for AGIs $50k-75k, 2.2% for AGIs $100k-200k)
Taxable individual retirement arrangement distribution: $9,762 (reported on 14.9% of returns)
46986:
$9,762
Indiana:
$13,841
(% of AGI for various income ranges: 7.8% for AGIs below $25k, 5.5% for AGIs $25k-50k, 7.2% for AGIs $75k-100k)
Total itemized deductions: $17,871 (20% of AGI, reported on 24.1% of returns)
Here:
$17,871
State:
$20,913
Here:
19.9% of AGI
State:
18.2% of AGI
(% of AGI for various income ranges: 9.3% for AGIs $25k-50k, 7.9% for AGIs $50k-75k, 9.3% for AGIs $75k-100k, 11.9% for AGIs $100k-200k)
Charity contributions: $4,925 (reported on 18.4% of returns)
Here:
$4,925
State:
$4,697
(% of AGI for various income ranges: 1.4% for AGIs $25k-50k, 1.0% for AGIs $50k-75k, 1.7% for AGIs $75k-100k, 3.4% for AGIs $100k-200k)
Taxes paid: $6,067 (reported on 24.1% of returns)
46986:
$6,067
State:
$7,456
(% of AGI for various income ranges: 1.6% for AGIs $25k-50k, 2.4% for AGIs $50k-75k, 3.1% for AGIs $75k-100k, 5.2% for AGIs $100k-200k)
Earned income credit: $2,000 (reported on 13.8% of returns)
Here:
$2,000
State:
$2,265
(% of AGI for various income ranges: 4.6% for AGIs below $25k, 0.9% for AGIs $25k-50k)
Percentage of individuals using paid preparers for their 2012 taxes: 55.2%
Here:
55%
State:
53%
(% for various income ranges: 48.5% for AGIs below $25k, 60.0% for AGIs $25k-50k, 53.3% for AGIs $50k-75k, 66.7% for AGIs $75k-100k, 60.0% for AGIs $100k-200k)
Averages for the 2004 tax year for zip code 46986, filed in 2005:
Average Adjusted Gross Income (AGI) in 2004: $43,302 (Individual Income Tax Returns)
Here:
$43,302
State:
$44,790
Salary/wage: $38,666 (reported on 87.3% of returns)
Here:
$38,666
State:
$39,615
(% of AGI for various income ranges: 88.2% for AGIs below $10k, 60.0% for AGIs $10k-25k, 74.0% for AGIs $25k-50k, 82.6% for AGIs $50k-75k, 84.2% for AGIs $75k-100k, 76.6% for AGIs over 100k)
Taxable interest for individuals: $960 (reported on 50.7% of returns)
This zip code:
$960
Indiana:
$1,535
(% of AGI for various income ranges: 4.8% for AGIs below $10k, 3.5% for AGIs $10k-25k, 1.8% for AGIs $25k-50k, 0.8% for AGIs $50k-75k, 0.6% for AGIs $75k-100k, 0.3% for AGIs over 100k)
Taxable dividends: $787 (reported on 22.0% of returns)
Here:
$787
State:
$2,998
(% of AGI for various income ranges: 2.2% for AGIs below $10k, 0.3% for AGIs $10k-25k, 0.7% for AGIs $25k-50k, 0.2% for AGIs $50k-75k, 0.1% for AGIs $75k-100k, 0.4% for AGIs over 100k)
Net capital gain/loss: +$470 (reported on 14.7% of returns)
Here:
+$470
State:
+$8,619
(% of AGI for various income ranges: -2.4% for AGIs below $10k, 0.1% for AGIs $10k-25k, 0.7% for AGIs $25k-50k, 0.2% for AGIs $50k-75k, 0.0% for AGIs $75k-100k, -0.1% for AGIs over 100k)
Profit/loss from business: +$4,862 (reported on 12.9% of returns)
Here:
+$4,862
State:
+$10,071
(% of AGI for various income ranges: 6.7% for AGIs below $10k, 2.8% for AGIs $10k-25k, 0.8% for AGIs $25k-50k, 2.6% for AGIs $50k-75k, 1.1% for AGIs over 100k)
IRA payment deduction: $2,895 (reported on 2.1% of returns)
46986:
$2,895
Indiana:
$2,840
Total itemized deductions: $14,872 (20% of AGI, reported on 29.7% of returns)
Here:
$14,872
State:
$17,065
Here:
19.6% of AGI
State:
19.5% of AGI
(% of AGI for various income ranges: 7.7% for AGIs $10k-25k, 8.7% for AGIs $25k-50k, 10.2% for AGIs $50k-75k, 11.6% for AGIs $75k-100k, 12.0% for AGIs over 100k)
Charity contributions deductions: $3,628 (5% of AGI, reported on 23.1% of returns)
Here:
$3,628
State:
$3,550
Here:
4.5% of AGI
State:
3.8% of AGI
(% of AGI for various income ranges: 1.0% for AGIs $10k-25k, 1.4% for AGIs $25k-50k, 1.6% for AGIs $50k-75k, 2.5% for AGIs $75k-100k, 2.8% for AGIs over 100k)
Total tax: $5,508 (reported on 78.0% of returns)
46986:
$5,508
State:
$6,914
(% of AGI for various income ranges: 2.2% for AGIs below $10k, 3.3% for AGIs $10k-25k, 6.4% for AGIs $25k-50k, 8.6% for AGIs $50k-75k, 11.0% for AGIs $75k-100k, 17.0% for AGIs over 100k)
Earned income credit: $1,561 (reported on 11.9% of returns)
Here:
$1,561
State:
$1,685
Percentage of individuals using paid preparers for their 2004 taxes: 63.3%
Here:
63%
State:
59%
(% for various income ranges: 49.3% for AGIs below $10k, 68.9% for AGIs $10k-25k, 66.4% for AGIs $25k-50k, 64.4% for AGIs $50k-75k, 62.1% for AGIs $75k-100k, 67.2% for AGIs over 100k)
Household received Food Stamps/SNAP in the past 12 months: 23 Household did not receive Food Stamps/SNAP in the past 12 months: 723
Women who had a birth in the past 12 months: 34 (29 now married, 6 unmarried) Women who did not have a birth in the past 12 months: 315 (205 now married, 111 unmarried)
Housing units in zip code 46986 with a mortgage: 383 (69 second mortgage, 62 both second mortgage and home equity loan) Houses without a mortgage: 24
Median monthly owner costs for units with a mortgage: $1,196 Median monthly owner costs for units without a mortgage: $486
Residents with income below the poverty level in 2022:
This zip code:
10.2%
Whole state:
12.6%
Residents with income below 50% of the poverty level in 2022:
This zip code:
6.4%
Whole state:
6.3%
Median number of rooms in houses and condos:
Here:
7.0
State:
6.6
Median number of rooms in apartments:
Here:
5.9
State:
4.3
Notable locations in this zip code not listed on our city pages
Size of family households: 250 2-persons, 126 3-persons, 31 4-persons, 56 5-persons, 16 6-persons, 3 7-or-more-persons
Size of nonfamily households: 246 1-person, 19 2-persons
264 married couples with children.
84 single-parent households (34 men, 50 women).
98.4% of residents of 46986 zip code speak English at home.
0.4% of residents speak Spanish at home (100% very well).
0.3% of residents speak other Indo-European language at home (100% very well).
0.1% of residents speak Asian or Pacific Island language at home (100% well).
Foreign born population: 43 (2.6%) (95.1% of them are naturalized citizens)
This zip code:
2.6%
Whole state:
6.1%
67%Serbia
24%Nicaragua
5%Eritrea
26%American
17%German
9%English
8%Irish
4%Ukrainian
3%Scottish
3%Croatian
Year of entry for the foreign-born population
422010 or later
02000 to 2009
41990 to 1999
4Before 1990
Facilities with environmental interests located in this zip code:
PIPE CREEK JR QUARRY (6377 W 600 S in SWAYZEE, IN)
AIR MINOR (AIRS/AFS) STATE MASTER (Indiana facility tracking) - ACES-OP-05300013, AIR PROGRAM, UST-8398, UNDERGROUND STORAGE TANK PROGRAM National Pollutant Discharge Elimination System NON-MAJOR (Tracking pollutant discharge elimination systems) - permit Business SIC classification: CRUSHED AND BROKEN LIMESTONE Organizations: TRENT SANDERS (CONTACT/OPERATOR)
, IRVING MATERIALS INC (CONTACT/OWNER)
Alternative names: IMI/PIPE CREEK JR., IMI/PIPE CREEK JR. STONE CO., PIPE CREEK JR QUARRY, DIV OF IMI
PIPE CREEK STONE CO (1349 N CR 700 W in SWAYZEE, IN)
AIR MINOR (AIRS/AFS) STATE MASTER (Indiana facility tracking) - ACES-OP-05300009, AIR PROGRAM, UST-8401, UNDERGROUND STORAGE TANK PROGRAM National Pollutant Discharge Elimination System NON-MAJOR (Tracking pollutant discharge elimination systems) - permit Business SIC classification: CRUSHED AND BROKEN LIMESTONE Organizations: TRENT SANDERS (CONTACT/OPERATOR)
, IRVING MATERIALS INC (CONTACT/OWNER)
Alternative names: IMI/PIPE CREEK SR.
SHANES MARATHON SERVICE STATION (114 S WASHINGTON ST in SWAYZEE, IN)
STATE MASTER (Indiana facility tracking) - UST-387, UNDERGROUND STORAGE TANK PROGRAM (Resource Conservation and Recovery Act (tracking hazardous waste)) Organizations: SHANE REED (CONTACT/OWNER)
Alternative names: SHANE MARATHON
CALCIUM PRODUCTS INC (CR 6455 W & CR 600 S in SWAYZEE, IN)
AIR SYNTHETIC MINOR (AIRS/AFS) STATE MASTER (Indiana facility tracking) - ACES-OP-05300038, AIR PROGRAM, UST-8399, UNDERGROUND STORAGE TANK PROGRAM Business SIC classification: NONMETALLIC MINERAL PRODUCTS
ORICA USA INC (8636 W. 200 S. in SWAYZEE, IN)
STATE MASTER (Indiana facility tracking) - CRTK-19003, EPCRA, CRTK-21779, TRI REPORTER (Tracking of toxic chemicals releasing facilities) Business SIC classification: CHEMICALS AND ALLIED PRODUCTS Alternative names: ORICA USA QUARRY & CONSTRUCTION SWAYZEE SITE, ORICA USA QUARRY & CONSTUCTION SWAYZEE SITE
Housing units lacking complete plumbing facilities: 1.5% Housing units lacking complete kitchen facilities: 0.8%
49.4%Utility gas
31.4%Electricity
10.7%Bottled, tank, or LP gas
7.9%Wood
Population in 1990: 1,891. Population change in the 1990s: +38 (+2.0%).
Place of birth for U.S.-born residents:
This state: 1,362
Northeast: 22
Midwest: 141
South: 87
West: 10
64% of the 46986 zip code residents lived in the same house 5 years ago. Out of people who lived in different houses, 64% lived in this county. Out of people who lived in different counties, 50% lived in Indiana.
90% of the 46986 zip code residents lived in the same house 1 year ago. Out of people who lived in different houses, 34% moved from this county. Out of people who lived in different houses, 50% moved from different county within same state. Out of people who lived in different houses, 17% moved from different state.
Private vs. public school enrollment:
Students in private schools in grades 1 to 8 (elementary and middle school): 14
Here:
6.8%
Indiana:
14.9%
Students in private schools in grades 9 to 12 (high school): 10
Here:
14.2%
Indiana:
11.4%
Students in private undergraduate colleges: 1
Here:
6.0%
Indiana:
22.3%
Occupation by median earnings in the past 12 months ($)
102,365Construction and extraction occupations
100,597Installation, maintenance, and repair occupations
77,657Health diagnosing and treating practitioners and other technical occupations
63,268Transportation occupations
53,977Computer and mathematical occupations
51,748Production occupations
Top industries in this zip code by the number of employees in 2005:
Mining: Crushed and Broken Granite Mining and Quarrying (20-49 employees: 1 establishment)
Wholesale Trade: Farm and Garden Machinery and Equipment Merchant Wholesalers (20-49: 1)
Information: Cable and Other Program Distribution (10-19: 1)
Arts, Entertainment, and Recreation: Golf Courses and Country Clubs (10-19: 1)
Management of Companies and Enterprises: Corporate, Subsidiary, and Regional Managing Offices (10-19: 1)
Other Services (except Public Administration): Religious Organizations (5-9: 1, 1-4: 1)
Finance and Insurance: Commercial Banking (5-9: 1)
Fatal accident statistics in 2014:
Fatal accident count: 1
Vehicles involved in fatal accidents: 2
Fatal accidents caused by drunken drivers: 0
Fatalities: 1
Persons involved in fatal accidents: 1
Pedestrians involved in fatal accidents: 0
Fatal accident statistics in 2012:
Fatal accident count: 1
Vehicles involved in fatal accidents: 2
Fatal accidents caused by drunken drivers: 0
Fatalities: 1
Persons involved in fatal accidents: 2
Pedestrians involved in fatal accidents: 0
2002 - 2018 National Fire Incident Reporting System (NFIRS) incidents
According to the data from the years 2002 - 2018 the average number of fire incidents per year is 11. The highest number of fire incidents - 26 took place in 2007, and the least - 0 in 2014. The data has a dropping trend.
When looking into fire subcategories, the most reports belonged to: Outside Fires (46.2%), and Structure Fires (36.4%).
Fire incident types reported to NFIRS in Zip Code 46986


 Nearest zip codes: 46987, 46919, 46936, 46928, 46984, 46953.


 According to the data from the years 2002 - 2018 the average number of fire incidents per year is 11. The highest number of fire incidents - 26 took place in 2007, and the least - 0 in 2014. The data has a dropping trend.
 When looking into fire subcategories, the most reports belonged to: Outside Fires (46.2%), and Structure Fires (36.4%).