Estimated zip code population in 2022: 2,286 Zip code population in 2010: 2,684 Zip code population in 2000: 2,796
Houses and condos: 1,021 Renter-occupied apartments: 140
% of renters here:
14%
State:
29%
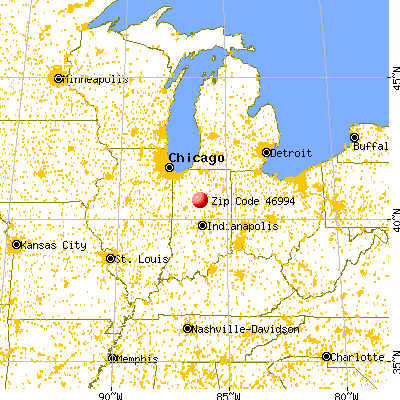
March 2022 cost of living index in zip code 46994: 84.2 (less than average, U.S. average is 100)
Land area: 57.6 sq. mi. Water area: 0.2 sq. mi.
Population density: 40 people per square mile
(very low).
OSM Map
General Map
Google Map
MSN Map
OSM Map
General Map
Google Map
MSN Map
OSM Map
General Map
Google Map
MSN Map
OSM Map
General Map
Google Map
MSN Map
Please wait while loading the map...
Real estate property taxes paid for housing units in 2022:
This zip code:
0.7% ($1,070)
Indiana:
0.7% ($1,467)
Median real estate property taxes paid for housing units with mortgages in 2022: $950 (0.6%) Median real estate property taxes paid for housing units with no mortgage in 2022: $1,293 (0.8%)
Business Search- 14 Million verified businesses
Males: 1,109
(48.5%)
Females: 1,176
(51.5%)
For population 25 years and over in 46994:
High school or higher: 89.3%
Bachelor's degree or higher: 20.2%
Graduate or professional degree: 10.4%
Unemployed: 2.4%
Mean travel time to work (commute): 19.5 minutes
For population 15 years and over in 46994:
Never married: 17.5%
Now married: 65.1%
Separated: 1.1%
Widowed: 5.5%
Divorced: 10.8%
Zip code 46994 compared to state average:
Black race population percentage significantly below state average.
Median age significantly above state average.
Foreign-born population percentage below state average.
Renting percentage below state average.
Length of stay since moving in significantly above state average.
House age above state average.
Number of college students significantly below state average.
Estimated median house/condo value in 2022: $154,479
46994:
$154,479
Indiana:
$208,700
Median resident age:
This zip code:
51.1 years
Indiana median age:
38.2 years
Average household size:
This zip code:
2.3 people
Indiana:
2.4 people
Averages for the 2020 tax year for zip code 46994, filed in 2021:
Average Adjusted Gross Income (AGI) in 2020: $57,780 (Individual Income Tax Returns)
Here:
$57,780
State:
$64,978
Salary/wage: $50,573 (reported on 77.5% of returns)
Here:
$50,573
State:
$55,245
(% of AGI for various income ranges: 1071.7% for AGIs below $25k, 3425.6% for AGIs $25k-50k, 6500.6% for AGIs $50k-75k, 8364.0% for AGIs $75k-100k, 14701.8% for AGIs $100k-200k)
Taxable interest for individuals: $717 (reported on 31.8% of returns)
This zip code:
$717
Indiana:
$1,351
(% of AGI for various income ranges: 14.5% for AGIs below $25k, 22.8% for AGIs $25k-50k, 27.1% for AGIs $50k-75k, 56.0% for AGIs $75k-100k, 60.0% for AGIs $100k-200k)
Ordinary dividends: $2,389 (reported on 14.7% of returns)
Here:
$2,389
State:
$5,827
(% of AGI for various income ranges: 15.5% for AGIs below $25k, 25.6% for AGIs $25k-50k, 94.7% for AGIs $50k-75k, 167.3% for AGIs $100k-200k)
Net capital gain/loss in AGI: +$6,606 (reported on 13.2% of returns)
Here:
+$6,606
State:
+$17,730
(% of AGI for various income ranges: 7.2% for AGIs below $25k, 6.4% for AGIs $25k-50k, 68.2% for AGIs $50k-75k, 225.0% for AGIs $75k-100k, 361.8% for AGIs $100k-200k)
Profit/loss from business: +$6,441 (reported on 13.2% of returns)
Here:
+$6,441
State:
+$12,144
(% of AGI for various income ranges: 93.1% for AGIs below $25k, 71.6% for AGIs $25k-50k, 177.6% for AGIs $50k-75k, 51.0% for AGIs $75k-100k, 266.4% for AGIs $100k-200k)
Taxable individual retirement arrangement distribution: $13,462 (reported on 10.1% of returns)
46994:
$13,462
Indiana:
$18,302
(% of AGI for various income ranges: 39.3% for AGIs below $25k, 61.6% for AGIs $25k-50k, 353.5% for AGIs $50k-75k, 800.9% for AGIs $100k-200k)
Total itemized deductions: $31,233 (reported on 2.3% of returns)
Here:
$31,233
State:
$35,601
(% of AGI for various income ranges: 937.0% for AGIs $75k-100k)
Charity contributions: $10,700 (reported on 1.6% of returns)
Here:
$10,700
State:
$15,596
(% of AGI for various income ranges: 85.6% for AGIs $25k-50k)
Taxes paid: $7,733 (reported on 2.3% of returns)
46994:
$7,733
State:
$7,542
(% of AGI for various income ranges: 232.0% for AGIs $75k-100k)
Earned income credit: $2,359 (reported on 13.2% of returns)
Here:
$2,359
State:
$2,298
(% of AGI for various income ranges: 83.8% for AGIs below $25k, 63.2% for AGIs $25k-50k)
Percentage of individuals using paid preparers for their 2020 taxes: 96.1%
Here:
96%
State:
94%
(% for various income ranges: 97.4% for AGIs below $25k, 96.8% for AGIs $25k-50k, 95.8% for AGIs $50k-75k, 92.9% for AGIs $75k-100k, 94.4% for AGIs $100k-200k, 100.0% for AGIs over 200k)
Averages for the 2012 tax year for zip code 46994, filed in 2013:
Average Adjusted Gross Income (AGI) in 2012: $50,102 (Individual Income Tax Returns)
Here:
$50,102
State:
$52,932
Salary/wage: $41,096 (reported on 85.5% of returns)
Here:
$41,096
State:
$45,173
(% of AGI for various income ranges: 66.4% for AGIs below $25k, 76.2% for AGIs $25k-50k, 74.5% for AGIs $50k-75k, 76.0% for AGIs $75k-100k, 62.0% for AGIs $100k-200k)
Taxable interest for individuals: $825 (reported on 35.5% of returns)
This zip code:
$825
Indiana:
$1,311
(% of AGI for various income ranges: 1.2% for AGIs below $25k, 0.4% for AGIs $25k-50k, 0.8% for AGIs $50k-75k, 0.4% for AGIs $75k-100k, 0.5% for AGIs $100k-200k)
Ordinary dividends: $1,316 (reported on 15.3% of returns)
Here:
$1,316
State:
$4,690
(% of AGI for various income ranges: 1.0% for AGIs below $25k, 0.3% for AGIs $25k-50k, 0.6% for AGIs $50k-75k, 0.4% for AGIs $100k-200k)
Net capital gain/loss in AGI: +$1,125 (reported on 9.7% of returns)
Here:
+$1,125
State:
+$10,406
(% of AGI for various income ranges: 0.7% for AGIs $100k-200k)
Profit/loss from business: +$4,547 (reported on 12.1% of returns)
Here:
+$4,547
State:
+$11,105
(% of AGI for various income ranges: 3.0% for AGIs below $25k, 2.3% for AGIs $25k-50k, 0.9% for AGIs $50k-75k, 1.3% for AGIs $75k-100k)
Taxable individual retirement arrangement distribution: $11,200 (reported on 11.3% of returns)
46994:
$11,200
Indiana:
$13,841
(% of AGI for various income ranges: 2.1% for AGIs below $25k, 2.6% for AGIs $25k-50k, 2.7% for AGIs $50k-75k, 2.7% for AGIs $75k-100k, 2.4% for AGIs $100k-200k)
Total itemized deductions: $18,106 (20% of AGI, reported on 25.8% of returns)
Here:
$18,106
State:
$20,913
Here:
19.9% of AGI
State:
18.2% of AGI
(% of AGI for various income ranges: 6.8% for AGIs below $25k, 6.0% for AGIs $25k-50k, 10.5% for AGIs $50k-75k, 9.4% for AGIs $75k-100k, 11.0% for AGIs $100k-200k)
Charity contributions: $3,775 (reported on 19.4% of returns)
Here:
$3,775
State:
$4,697
(% of AGI for various income ranges: 1.0% for AGIs $25k-50k, 1.3% for AGIs $50k-75k, 1.6% for AGIs $75k-100k, 2.1% for AGIs $100k-200k)
Taxes paid: $6,744 (reported on 25.8% of returns)
46994:
$6,744
State:
$7,456
(% of AGI for various income ranges: 1.1% for AGIs below $25k, 1.3% for AGIs $25k-50k, 3.0% for AGIs $50k-75k, 3.3% for AGIs $75k-100k, 5.7% for AGIs $100k-200k)
Earned income credit: $2,184 (reported on 15.3% of returns)
Here:
$2,184
State:
$2,265
(% of AGI for various income ranges: 5.3% for AGIs below $25k, 1.1% for AGIs $25k-50k)
Percentage of individuals using paid preparers for their 2012 taxes: 66.1%
Here:
66%
State:
53%
(% for various income ranges: 62.2% for AGIs below $25k, 65.6% for AGIs $25k-50k, 65.0% for AGIs $50k-75k, 69.2% for AGIs $75k-100k, 78.6% for AGIs $100k-200k)
Averages for the 2004 tax year for zip code 46994, filed in 2005:
Average Adjusted Gross Income (AGI) in 2004: $42,395 (Individual Income Tax Returns)
Here:
$42,395
State:
$44,790
Salary/wage: $38,980 (reported on 87.1% of returns)
Here:
$38,980
State:
$39,615
(% of AGI for various income ranges: 100.8% for AGIs below $10k, 65.0% for AGIs $10k-25k, 75.2% for AGIs $25k-50k, 83.4% for AGIs $50k-75k, 87.5% for AGIs $75k-100k, 77.2% for AGIs over 100k)
Taxable interest for individuals: $941 (reported on 49.6% of returns)
This zip code:
$941
Indiana:
$1,535
(% of AGI for various income ranges: 6.3% for AGIs below $10k, 3.6% for AGIs $10k-25k, 1.1% for AGIs $25k-50k, 0.6% for AGIs $50k-75k, 0.8% for AGIs $75k-100k, 0.6% for AGIs over 100k)
Taxable dividends: $989 (reported on 21.1% of returns)
Here:
$989
State:
$2,998
(% of AGI for various income ranges: 1.8% for AGIs below $10k, 0.8% for AGIs $10k-25k, 0.5% for AGIs $25k-50k, 0.6% for AGIs $50k-75k, 0.3% for AGIs $75k-100k, 0.2% for AGIs over 100k)
Net capital gain/loss: +$3,679 (reported on 14.9% of returns)
Here:
+$3,679
State:
+$8,619
(% of AGI for various income ranges: 1.6% for AGIs below $10k, 0.8% for AGIs $10k-25k, 0.8% for AGIs $25k-50k, -0.2% for AGIs $50k-75k, -0.0% for AGIs $75k-100k, 5.7% for AGIs over 100k)
Profit/loss from business: +$3,872 (reported on 12.0% of returns)
Here:
+$3,872
State:
+$10,071
(% of AGI for various income ranges: 8.4% for AGIs below $10k, 3.7% for AGIs $10k-25k, 1.7% for AGIs $25k-50k, 0.8% for AGIs $50k-75k, 0.3% for AGIs $75k-100k)
IRA payment deduction: $2,133 (reported on 1.2% of returns)
46994:
$2,133
Indiana:
$2,840
Total itemized deductions: $14,134 (20% of AGI, reported on 28.4% of returns)
Here:
$14,134
State:
$17,065
Here:
20.0% of AGI
State:
19.5% of AGI
(% of AGI for various income ranges: 8.6% for AGIs $10k-25k, 8.4% for AGIs $25k-50k, 8.4% for AGIs $50k-75k, 9.6% for AGIs $75k-100k, 13.0% for AGIs over 100k)
Charity contributions deductions: $2,980 (4% of AGI, reported on 23.7% of returns)
Here:
$2,980
State:
$3,550
Here:
4.0% of AGI
State:
3.8% of AGI
(% of AGI for various income ranges: 1.2% for AGIs $10k-25k, 1.3% for AGIs $25k-50k, 1.3% for AGIs $50k-75k, 1.5% for AGIs $75k-100k, 3.2% for AGIs over 100k)
Total tax: $5,051 (reported on 78.3% of returns)
46994:
$5,051
State:
$6,914
(% of AGI for various income ranges: 3.3% for AGIs below $10k, 4.0% for AGIs $10k-25k, 6.6% for AGIs $25k-50k, 8.7% for AGIs $50k-75k, 11.0% for AGIs $75k-100k, 14.2% for AGIs over 100k)
Earned income credit: $1,510 (reported on 12.4% of returns)
Here:
$1,510
State:
$1,685
Percentage of individuals using paid preparers for their 2004 taxes: 67.5%
Here:
68%
State:
59%
(% for various income ranges: 58.7% for AGIs below $10k, 69.2% for AGIs $10k-25k, 71.2% for AGIs $25k-50k, 72.1% for AGIs $50k-75k, 63.8% for AGIs $75k-100k, 66.2% for AGIs over 100k)
Household received Food Stamps/SNAP in the past 12 months: 70 Household did not receive Food Stamps/SNAP in the past 12 months: 912
Women who had a birth in the past 12 months: 34 (30 now married, 5 unmarried) Women who did not have a birth in the past 12 months: 404 (185 now married, 219 unmarried)
Housing units in zip code 46994 with a mortgage: 481 (46 second mortgage, 7 home equity loan, 32 both second mortgage and home equity loan) Houses without a mortgage: 62
Median monthly owner costs for units with a mortgage: $1,095 Median monthly owner costs for units without a mortgage: $396
Residents with income below the poverty level in 2022:
This zip code:
8.6%
Whole state:
12.6%
Residents with income below 50% of the poverty level in 2022:
This zip code:
3.3%
Whole state:
6.3%
Median number of rooms in houses and condos:
Here:
7.0
State:
6.6
Median number of rooms in apartments:
Here:
4.6
State:
4.3
Notable locations in this zip code not listed on our city pages
Size of family households: 438 2-persons, 69 3-persons, 110 4-persons, 49 5-persons, 11 6-persons, 5 7-or-more-persons
Size of nonfamily households: 270 1-person, 28 2-persons
277 married couples with children.
106 single-parent households (14 men, 92 women).
93.2% of residents of 46994 zip code speak English at home.
5.4% of residents speak Spanish at home (57% very well, 15% well, 3% not well, 25% not at all).
0.7% of residents speak other Indo-European language at home (100% very well).
0.7% of residents speak Asian or Pacific Island language at home (62% very well, 38% well).
Foreign born population: 79 (3.5%) (27.0% of them are naturalized citizens)
This zip code:
3.5%
Whole state:
6.1%
80%Guatemala
22%Honduras
9%France
6%Japan
2%Costa Rica
23%German
18%American
13%English
8%Irish
6%Norwegian
5%European
4%Italian
Year of entry for the foreign-born population
462010 or later
12000 to 2009
61990 to 1999
93Before 1990
Facilities with environmental interests located in this zip code:
ANDERSONS ERNYS FERTILIZER (8086 E 900 S in WALTON, IN)
ENFORCEMENT/COMPLIANCE ACTIVITY (Integrated Compliance Information System) STATE MASTER (Indiana facility tracking) - LUST-199808511, LEAKING STORAGE TANK, SPILL-199006174, RELEASE ASSESSMENT, CRTK-3819, EPCRA, UST-10865, UNDERGROUND STORAGE TANK PROGRAM, UST-10866, COMPLIANCE ACTIVITY (Tracking inspections of insecticide, fungicide, and rodenticide, and toxic substances) (Resource Conservation and Recovery Act (tracking hazardous waste)) TRI REPORTER (Tracking of toxic chemicals releasing facilities) Business SIC classification: PESTICIDES AND AGRICULTURAL CHEMICALS Alternative names: ANDERSONS INC, ANDERSONS (DBA ERNY'S), andersons WALTON WHOLESALE AND RETAIL FARM CENTER, ERNYS FERTILIZER SERVICE INC
PFARRER PLATING CO (US 35 S & SR 218 in WALTON, IN)
STATE MASTER (Indiana facility tracking) - CRTK-974, EPCRA, SPILL-199003013, RELEASE ASSESSMENT, UST-7374, UNDERGROUND STORAGE TANK PROGRAM (Resource Conservation and Recovery Act (tracking hazardous waste)) Business NAICS classification: ELECTROPLATING, PLATING, POLISHING, ANODIZING, AND COLORING. Organizations: ROBERT NEWBY AND WILLIAM H PFARRER (CONTACT/OPERATOR)
Alternative names: PFARRER WH CO INC PLATING
DEHAVEN SOIL SERVICE INCORPORATED (309 SOUTH ST in WALTON, IN)
ENFORCEMENT/COMPLIANCE ACTIVITY (Integrated Compliance Information System) STATE MASTER (Indiana facility tracking) - CRTK-7223, EPCRA COMPLIANCE ACTIVITY (Tracking inspections of insecticide, fungicide, and rodenticide, and toxic substances) Alternative names: DE HAVEN SOIL SVC
LEWIS CASS JR-SR HIGH SCHOOL (SR 218 W in WALTON, IN)
(National Center for Education Statistics) - STATE ID-0689 Organizations: SOUTHEASTERN SCHOOL CORP (SCHOOL DISTRICT)
Housing units lacking complete plumbing facilities: 1.6% Housing units lacking complete kitchen facilities: 1.0%
35.1%Utility gas
29.8%Electricity
23.6%Bottled, tank, or LP gas
4.3%Wood
3.8%Other fuel
1.7%No fuel used
1.2%Coal or coke
0.9%Fuel oil, kerosene, etc.
Population in 1990: 4,935.
Place of birth for U.S.-born residents:
This state: 1,715
Northeast: 39
Midwest: 160
South: 137
West: 78
74% of the 46994 zip code residents lived in the same house 5 years ago. Out of people who lived in different houses, 49% lived in this county. Out of people who lived in different counties, 50% lived in Indiana.
91% of the 46994 zip code residents lived in the same house 1 year ago. Out of people who lived in different houses, 26% moved from this county. Out of people who lived in different houses, 9% moved from different county within same state. Out of people who lived in different houses, 62% moved from different state. Out of people who lived in different houses, 7% moved from abroad.
Private vs. public school enrollment:
Students in private schools in grades 1 to 8 (elementary and middle school): 12
Here:
9.5%
Indiana:
14.9%
Students in private schools in grades 9 to 12 (high school): 2
Here:
2.7%
Indiana:
11.4%
Students in private undergraduate colleges: 1
Here:
6.2%
Indiana:
22.3%
Occupation by median earnings in the past 12 months ($)
74,650Business and financial operations occupations
67,313Sales and related occupations
65,382Production occupations
47,938Community and social service occupations
40,453Health diagnosing and treating practitioners and other technical occupations
39,652Architecture and engineering occupations
Top industries in this zip code by the number of employees in 2005:
Accommodation and Food Services: Food Service Contractors (10-19: 2, 5-9: 1)
Accommodation and Food Services: Limited-Service Restaurants (20-49: 1)
Wholesale Trade: Petroleum and Petroleum Products Merchant Wholesalers (except Bulk Stations and Terminals) (20-49: 1)
Accommodation and Food Services: Full-Service Restaurants (10-19: 1, 1-4: 1)
Wholesale Trade: Petroleum Bulk Stations and Terminals (10-19: 1)
Other Services (except Public Administration): Religious Organizations (5-9: 2)
Fatal accident statistics in 2013:
Fatal accident count: 1
Vehicles involved in fatal accidents: 2
Fatal accidents caused by drunken drivers: 0
Fatalities: 1
Persons involved in fatal accidents: 3
Pedestrians involved in fatal accidents: 0
Fatal accident statistics in 2012:
Fatal accident count: 1
Vehicles involved in fatal accidents: 1
Fatal accidents caused by drunken drivers: 1
Fatalities: 1
Persons involved in fatal accidents: 2
Pedestrians involved in fatal accidents: 0
2002 - 2016 National Fire Incident Reporting System (NFIRS) incidents
According to the data from the years 2002 - 2016 the average number of fire incidents per year is 17. The highest number of fire incidents - 30 took place in 2011, and the least - 4 in 2014. The data has a dropping trend.
When looking into fire subcategories, the most reports belonged to: Outside Fires (45.2%), and Structure Fires (34.3%).
Fire incident types reported to NFIRS in Zip Code 46994


 Nearest zip codes: 46967, 46932, 46961, 46998, 46947, 46959.


 According to the data from the years 2002 - 2016 the average number of fire incidents per year is 17. The highest number of fire incidents - 30 took place in 2011, and the least - 4 in 2014. The data has a dropping trend.
 When looking into fire subcategories, the most reports belonged to: Outside Fires (45.2%), and Structure Fires (34.3%).