Estimated zip code population in 2022: 2,171 Zip code population in 2010: 1,636 Zip code population in 2000: 1,594
Houses and condos: 1,040 Renter-occupied apartments: 146
% of renters here:
16%
State:
29%
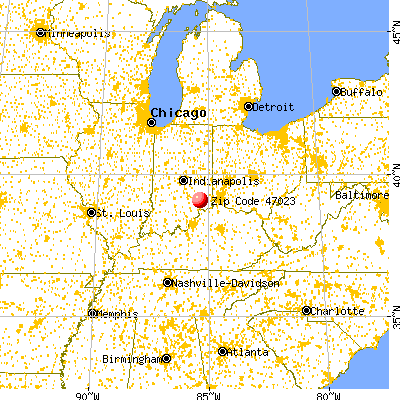
March 2022 cost of living index in zip code 47023: 85.7 (less than average, U.S. average is 100)
Land area: 47.0 sq. mi. Water area: 0.1 sq. mi.
Population density: 46 people per square mile
(very low).
OSM Map
General Map
Google Map
MSN Map
OSM Map
General Map
Google Map
MSN Map
OSM Map
General Map
Google Map
MSN Map
OSM Map
General Map
Google Map
MSN Map
Please wait while loading the map...
Real estate property taxes paid for housing units in 2022:
This zip code:
0.7% ($1,189)
Indiana:
0.7% ($1,467)
Median real estate property taxes paid for housing units with mortgages in 2022: $853 (0.9%) Median real estate property taxes paid for housing units with no mortgage in 2022: $1,286 (1.3%)
Business Search- 14 Million verified businesses
Males: 1,052
(48.4%)
Females: 1,119
(51.6%)
For population 25 years and over in 47023:
High school or higher: 88.5%
Bachelor's degree or higher: 20.6%
Graduate or professional degree: 10.8%
Unemployed: 1.3%
Mean travel time to work (commute): 32.9 minutes
For population 15 years and over in 47023:
Never married: 15.8%
Now married: 65.3%
Separated: 1.7%
Widowed: 4.8%
Divorced: 12.3%
Zip code 47023 compared to state average:
Unemployed percentage below state average.
Black race population percentage significantly below state average.
Hispanic race population percentage significantly below state average.
Median age significantly above state average.
Foreign-born population percentage significantly below state average.
Renting percentage below state average.
Length of stay since moving in significantly above state average.
Estimated median house/condo value in 2022: $181,760
47023:
$181,760
Indiana:
$208,700
Median resident age:
This zip code:
46.3 years
Indiana median age:
38.2 years
Average household size:
This zip code:
2.4 people
Indiana:
2.4 people
Averages for the 2020 tax year for zip code 47023, filed in 2021:
Average Adjusted Gross Income (AGI) in 2020: $51,371 (Individual Income Tax Returns)
Here:
$51,371
State:
$64,978
Salary/wage: $48,627 (reported on 78.7% of returns)
Here:
$48,627
State:
$55,245
(% of AGI for various income ranges: 1198.8% for AGIs below $25k, 3548.2% for AGIs $25k-50k, 6235.6% for AGIs $50k-75k, 9728.0% for AGIs $75k-100k, 20528.0% for AGIs $100k-200k)
Taxable interest for individuals: $625 (reported on 26.7% of returns)
This zip code:
$625
Indiana:
$1,351
(% of AGI for various income ranges: 26.9% for AGIs below $25k, 18.2% for AGIs $25k-50k, 10.0% for AGIs $50k-75k, 6.0% for AGIs $75k-100k, 78.0% for AGIs $100k-200k)
Ordinary dividends: $1,456 (reported on 12.0% of returns)
Here:
$1,456
State:
$5,827
(% of AGI for various income ranges: 13.8% for AGIs below $25k, 27.8% for AGIs $50k-75k, 168.0% for AGIs $100k-200k)
Net capital gain/loss in AGI: +$8,625 (reported on 10.7% of returns)
Here:
+$8,625
State:
+$17,730
(% of AGI for various income ranges: 25.0% for AGIs below $25k, 50.0% for AGIs $50k-75k, 1210.0% for AGIs $100k-200k)
Profit/loss from business: +$5,020 (reported on 13.3% of returns)
Here:
+$5,020
State:
+$12,144
(% of AGI for various income ranges: 91.9% for AGIs below $25k, 38.2% for AGIs $25k-50k, 147.8% for AGIs $50k-75k, 314.0% for AGIs $75k-100k)
Taxable individual retirement arrangement distribution: $11,429 (reported on 9.3% of returns)
47023:
$11,429
Indiana:
$18,302
(% of AGI for various income ranges: 175.6% for AGIs below $25k, 576.7% for AGIs $50k-75k)
Earned income credit: $2,400 (reported on 17.3% of returns)
Here:
$2,400
State:
$2,298
(% of AGI for various income ranges: 110.6% for AGIs below $25k, 79.4% for AGIs $25k-50k)
Percentage of individuals using paid preparers for their 2020 taxes: 96.0%
Here:
96%
State:
94%
(% for various income ranges: 96.2% for AGIs below $25k, 90.5% for AGIs $25k-50k, 100.0% for AGIs $50k-75k, 100.0% for AGIs $75k-100k, 100.0% for AGIs $100k-200k)
Averages for the 2012 tax year for zip code 47023, filed in 2013:
Average Adjusted Gross Income (AGI) in 2012: $39,411 (Individual Income Tax Returns)
Here:
$39,411
State:
$52,932
Salary/wage: $36,622 (reported on 80.0% of returns)
Here:
$36,622
State:
$45,173
(% of AGI for various income ranges: 69.7% for AGIs below $25k, 80.0% for AGIs $25k-50k, 80.4% for AGIs $50k-75k, 81.9% for AGIs $75k-100k, 58.4% for AGIs $100k-200k)
Taxable interest for individuals: $948 (reported on 30.7% of returns)
This zip code:
$948
Indiana:
$1,311
(% of AGI for various income ranges: 1.2% for AGIs below $25k, 1.4% for AGIs $25k-50k, 0.3% for AGIs $50k-75k, 0.3% for AGIs $75k-100k, 0.5% for AGIs $100k-200k)
Ordinary dividends: $1,229 (reported on 9.3% of returns)
Here:
$1,229
State:
$4,690
Net capital gain/loss in AGI: +$1,225 (reported on 10.7% of returns)
Here:
+$1,225
State:
+$10,406
Profit/loss from business: +$4,967 (reported on 16.0% of returns)
Here:
+$4,967
State:
+$11,105
(% of AGI for various income ranges: 5.1% for AGIs below $25k, 1.1% for AGIs $25k-50k, 1.4% for AGIs $50k-75k, 4.5% for AGIs $75k-100k)
Taxable individual retirement arrangement distribution: $7,343 (reported on 9.3% of returns)
47023:
$7,343
Indiana:
$13,841
(% of AGI for various income ranges: 4.2% for AGIs below $25k, 4.6% for AGIs $25k-50k)
Total itemized deductions: $15,587 (22% of AGI, reported on 20.0% of returns)
Here:
$15,587
State:
$20,913
Here:
22.3% of AGI
State:
18.2% of AGI
(% of AGI for various income ranges: 11.1% for AGIs $25k-50k, 7.6% for AGIs $50k-75k, 7.3% for AGIs $75k-100k, 9.5% for AGIs $100k-200k)
Charity contributions: $3,456 (reported on 12.0% of returns)
Here:
$3,456
State:
$4,697
(% of AGI for various income ranges: 1.1% for AGIs $25k-50k, 1.3% for AGIs $50k-75k, 2.2% for AGIs $100k-200k)
Taxes paid: $4,287 (reported on 20.0% of returns)
47023:
$4,287
State:
$7,456
(% of AGI for various income ranges: 1.9% for AGIs $25k-50k, 1.7% for AGIs $50k-75k, 2.7% for AGIs $75k-100k, 3.8% for AGIs $100k-200k)
Earned income credit: $2,464 (reported on 18.7% of returns)
Here:
$2,464
State:
$2,265
(% of AGI for various income ranges: 6.6% for AGIs below $25k, 1.2% for AGIs $25k-50k)
Percentage of individuals using paid preparers for their 2012 taxes: 66.7%
Here:
67%
State:
53%
(% for various income ranges: 63.6% for AGIs below $25k, 66.7% for AGIs $25k-50k, 63.6% for AGIs $50k-75k, 83.3% for AGIs $75k-100k, 75.0% for AGIs $100k-200k)
Averages for the 2004 tax year for zip code 47023, filed in 2005:
Average Adjusted Gross Income (AGI) in 2004: $31,433 (Individual Income Tax Returns)
Here:
$31,433
State:
$44,790
Salary/wage: $31,104 (reported on 84.4% of returns)
Here:
$31,104
State:
$39,615
(% of AGI for various income ranges: 156.3% for AGIs below $10k, 74.6% for AGIs $10k-25k, 87.2% for AGIs $25k-50k, 81.9% for AGIs $50k-75k, 108.5% for AGIs $75k-100k)
Taxable interest for individuals: $962 (reported on 38.2% of returns)
This zip code:
$962
Indiana:
$1,535
(% of AGI for various income ranges: 9.0% for AGIs below $10k, 2.4% for AGIs $10k-25k, 0.8% for AGIs $25k-50k, 0.9% for AGIs $50k-75k, 0.7% for AGIs $75k-100k)
Taxable dividends: $704 (reported on 10.6% of returns)
Here:
$704
State:
$2,998
(% of AGI for various income ranges: 0.8% for AGIs below $10k, 0.3% for AGIs $10k-25k, 0.2% for AGIs $25k-50k, 0.1% for AGIs $50k-75k, 0.4% for AGIs $75k-100k)
Net capital gain/loss: +$2,067 (reported on 9.8% of returns)
Here:
+$2,067
State:
+$8,619
(% of AGI for various income ranges: -3.5% for AGIs below $10k, 0.4% for AGIs $10k-25k, -0.0% for AGIs $25k-50k, 1.8% for AGIs $50k-75k, 0.7% for AGIs $75k-100k)
Profit/loss from business: +$2,252 (reported on 15.6% of returns)
Here:
+$2,252
State:
+$10,071
(% of AGI for various income ranges: -13.6% for AGIs below $10k, 2.3% for AGIs $10k-25k, 2.7% for AGIs $25k-50k, 0.7% for AGIs $50k-75k, 0.5% for AGIs $75k-100k)
Total itemized deductions: $13,432 (24% of AGI, reported on 19.4% of returns)
Here:
$13,432
State:
$17,065
Here:
24.0% of AGI
State:
19.5% of AGI
(% of AGI for various income ranges: 6.8% for AGIs $10k-25k, 6.8% for AGIs $25k-50k, 8.3% for AGIs $50k-75k, 16.0% for AGIs $75k-100k)
Charity contributions deductions: $2,577 (4% of AGI, reported on 13.6% of returns)
Here:
$2,577
State:
$3,550
Here:
4.2% of AGI
State:
3.8% of AGI
(% of AGI for various income ranges: 0.5% for AGIs $10k-25k, 0.8% for AGIs $25k-50k, 1.0% for AGIs $50k-75k, 2.8% for AGIs $75k-100k)
Total tax: $3,394 (reported on 71.0% of returns)
47023:
$3,394
State:
$6,914
(% of AGI for various income ranges: 3.3% for AGIs below $10k, 4.0% for AGIs $10k-25k, 6.0% for AGIs $25k-50k, 8.5% for AGIs $50k-75k, 9.7% for AGIs $75k-100k, 16.0% for AGIs over 100k)
Earned income credit: $1,993 (reported on 18.8% of returns)
Here:
$1,993
State:
$1,685
Percentage of individuals using paid preparers for their 2004 taxes: 68.9%
Here:
69%
State:
59%
(% for various income ranges: 62.5% for AGIs below $10k, 72.1% for AGIs $10k-25k, 67.0% for AGIs $25k-50k, 70.2% for AGIs $50k-75k, 96.0% for AGIs $75k-100k)
Likely homosexual households (counted as self-reported same-sex unmarried-partner households)
Lesbian couples: 0.0% of all households
Gay men: 0.1% of all households
Household received Food Stamps/SNAP in the past 12 months: 96 Household did not receive Food Stamps/SNAP in the past 12 months: 799
Women who had a birth in the past 12 months: 66 (72 now married, 0 unmarried) Women who did not have a birth in the past 12 months: 415 (244 now married, 171 unmarried)
Housing units in zip code 47023 with a mortgage: 334 (26 second mortgage, 26 both second mortgage and home equity loan) Houses without a mortgage: 14
Median monthly owner costs for units with a mortgage: $1,079 Median monthly owner costs for units without a mortgage: $538
Residents with income below the poverty level in 2022:
This zip code:
7.1%
Whole state:
12.6%
Residents with income below 50% of the poverty level in 2022:
This zip code:
2.9%
Whole state:
6.3%
Median number of rooms in houses and condos:
Here:
6.6
State:
6.6
Median number of rooms in apartments:
Here:
5.2
State:
4.3
Notable locations in this zip code not listed on our city pages
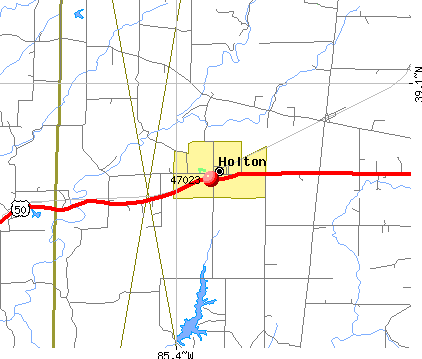
Notable locations in zip code 47023: Otter Creek Township Holton Volunteer Fire Department (A), New Marion Volunteer Fire Department (B). Display/hide their locations on the map
Cemeteries: Sheppard Cemetery (1), Otter Village Cemetery (2), Little Arlington Cemetery (3), Old Hopewell Cemetery (4), O'Brien Cemetery (5). Display/hide their locations on the map
Size of family households: 307 2-persons, 92 3-persons, 89 4-persons, 73 5-persons, 26 6-persons, 18 7-or-more-persons
Size of nonfamily households: 281 1-person, 7 2-persons
265 married couples with children.
112 single-parent households (31 men, 81 women).
98.2% of residents of 47023 zip code speak English at home.
0.6% of residents speak Spanish at home (69% very well, 31% well).
0.6% of residents speak other Indo-European language at home (100% not well).
Foreign born population: 6 (0.3%) (17.4% of them are naturalized citizens)
This zip code:
0.3%
Whole state:
6.1%
83%Honduras
17%United Kingdom, excluding England and Scotland
23%American
22%German
14%European
9%Irish
8%Italian
3%English
1%French
Year of entry for the foreign-born population
62010 or later
02000 to 2009
361990 to 1999
2Before 1990
Facilities with environmental interests located in this zip code:
HOLTON MUNICIPAL WWTP (RR 1 in HOLTON, IN)
STATE MASTER (Indiana facility tracking) National Pollutant Discharge Elimination System NON-MAJOR (Tracking pollutant discharge elimination systems) - permit Business SIC classification: SEWERAGE SYSTEMS Organizations: TOWN COUNCIL PRESIDENT (CONTACT/OWNER)
Alternative names: HOLTON MUNICIPAL STP
Housing units lacking complete plumbing facilities: 4.1% Housing units lacking complete kitchen facilities: 4.7%
41.0%Electricity
30.6%Bottled, tank, or LP gas
25.6%Wood
1.6%Fuel oil, kerosene, etc.
0.8%No fuel used
0.6%Utility gas
Population in 1990: 2,384.
Place of birth for U.S.-born residents:
This state: 1,687
Northeast: 24
Midwest: 229
South: 137
West: 30
64% of the 47023 zip code residents lived in the same house 5 years ago. Out of people who lived in different houses, 68% lived in this county. Out of people who lived in different counties, 50% lived in Indiana.
96% of the 47023 zip code residents lived in the same house 1 year ago. Out of people who lived in different houses, 22% moved from this county. Out of people who lived in different houses, 81% moved from different county within same state. Out of people who lived in different houses, 8% moved from abroad.
Private vs. public school enrollment:
Students in private schools in grades 1 to 8 (elementary and middle school):
Here:
0.0%
Indiana:
14.9%
Students in private schools in grades 9 to 12 (high school):
Here:
0.0%
Indiana:
11.4%
Students in private undergraduate colleges:
Here:
0.0%
Indiana:
22.3%
Occupation by median earnings in the past 12 months ($)
164,927Sales and related occupations
81,837Transportation occupations
63,453Education, training, and library occupations
54,184Management occupations
46,483Health technologists and technicians
45,888Material moving occupations
Top industries in this zip code by the number of employees in 2005:
Professional, Scientific, and Technical Services: Offices of Certified Public Accountants (1-4: 2)
Other Services (except Public Administration): Religious Organizations (1-4: 2)
Professional, Scientific, and Technical Services: Marketing Consulting Services (1-4: 1)
Utilities: Water Supply and Irrigation Systems (1-4: 1)
Fatal accident statistics in 2013:
Fatal accident count: 1
Vehicles involved in fatal accidents: 2
Fatal accidents caused by drunken drivers: 0
Fatalities: 3
Persons involved in fatal accidents: 6
Pedestrians involved in fatal accidents: 0
Fatal accident statistics in 2012:
Fatal accident count: 2
Vehicles involved in fatal accidents: 3
Fatal accidents caused by drunken drivers: 0
Fatalities: 2
Persons involved in fatal accidents: 3
Pedestrians involved in fatal accidents: 1
2003 - 2017 National Fire Incident Reporting System (NFIRS) incidents
Based on the data from the years 2003 - 2017 the average number of fires per year is 7. The highest number of reported fire incidents - 21 took place in 2009, and the least - 0 in 2007. The data has a decreasing trend.
When looking into fire subcategories, the most reports belonged to: Structure Fires (45.0%), and Outside Fires (38.7%).
Fire incident types reported to NFIRS in Zip Code 47023


 Nearest zip codes: 47223, 47037, 47034, 47042, 47231, 47283.


 Based on the data from the years 2003 - 2017 the average number of fires per year is 7. The highest number of reported fire incidents - 21 took place in 2009, and the least - 0 in 2007. The data has a decreasing trend.
 When looking into fire subcategories, the most reports belonged to: Structure Fires (45.0%), and Outside Fires (38.7%).