Estimated zip code population in 2022: 4,803 Zip code population in 2010: 5,250 Zip code population in 2000: 5,218
Houses and condos: 2,264 Renter-occupied apartments: 589
% of renters here:
30%
State:
29%
March 2022 cost of living index in zip code 47043: 85.0 (less than average, U.S. average is 100)
Land area: 103.1 sq. mi. Water area: 0.7 sq. mi.
Population density: 47 people per square mile
(very low).
OSM Map
General Map
Google Map
MSN Map
OSM Map
General Map
Google Map
MSN Map
OSM Map
General Map
Google Map
MSN Map
OSM Map
General Map
Google Map
MSN Map
Please wait while loading the map...
Real estate property taxes paid for housing units in 2022:
This zip code:
0.5% ($900)
Indiana:
0.7% ($1,467)
Median real estate property taxes paid for housing units with mortgages in 2022: $1,047 (0.4%) Median real estate property taxes paid for housing units with no mortgage in 2022: $681 (0.5%)
Estimated median house/condo value in 2022: $194,377
47043:
$194,377
Indiana:
$208,700
According to our research of Indiana and other state lists, there were 3 registered sex offenders living in 47043 zip code as of May 28, 2024. The ratio of all residents to sex offenders in zip code 47043 is 1,894 to 1. The ratio of registered sex offenders to all residents in this zip code is much lower than the state average.
Median resident age:
This zip code:
43.9 years
Indiana median age:
38.2 years
Average household size:
This zip code:
2.4 people
Indiana:
2.4 people
Averages for the 2020 tax year for zip code 47043, filed in 2021:
Average Adjusted Gross Income (AGI) in 2020: $49,405 (Individual Income Tax Returns)
Here:
$49,405
State:
$64,978
Salary/wage: $44,574 (reported on 80.8% of returns)
Here:
$44,574
State:
$55,245
(% of AGI for various income ranges: 1059.8% for AGIs below $25k, 3347.7% for AGIs $25k-50k, 6654.6% for AGIs $50k-75k, 9028.1% for AGIs $75k-100k, 12829.0% for AGIs $100k-200k)
Taxable interest for individuals: $878 (reported on 23.5% of returns)
This zip code:
$878
Indiana:
$1,351
(% of AGI for various income ranges: 20.9% for AGIs below $25k, 27.1% for AGIs $25k-50k, 15.8% for AGIs $50k-75k, 25.0% for AGIs $75k-100k, 49.0% for AGIs $100k-200k)
Ordinary dividends: $2,592 (reported on 10.3% of returns)
Here:
$2,592
State:
$5,827
(% of AGI for various income ranges: 14.8% for AGIs below $25k, 18.3% for AGIs $25k-50k, 28.7% for AGIs $50k-75k, 29.4% for AGIs $75k-100k, 161.0% for AGIs $100k-200k)
Net capital gain/loss in AGI: +$10,992 (reported on 10.7% of returns)
Here:
+$10,992
State:
+$17,730
(% of AGI for various income ranges: 8.3% for AGIs below $25k, 30.0% for AGIs $25k-50k, 60.4% for AGIs $50k-75k, 101.2% for AGIs $75k-100k, 1121.5% for AGIs $100k-200k)
Profit/loss from business: +$9,776 (reported on 14.1% of returns)
Here:
+$9,776
State:
+$12,144
(% of AGI for various income ranges: 80.0% for AGIs below $25k, 207.1% for AGIs $25k-50k, 86.2% for AGIs $50k-75k, 211.9% for AGIs $75k-100k, 583.0% for AGIs $100k-200k)
Taxable individual retirement arrangement distribution: $12,394 (reported on 7.7% of returns)
47043:
$12,394
Indiana:
$18,302
(% of AGI for various income ranges: 44.9% for AGIs below $25k, 92.1% for AGIs $25k-50k, 238.8% for AGIs $50k-75k, 462.0% for AGIs $100k-200k)
Total itemized deductions: $26,950 (reported on 1.7% of returns)
Here:
$26,950
State:
$35,601
(% of AGI for various income ranges: 673.8% for AGIs $75k-100k)
Taxes paid: $5,625 (reported on 1.7% of returns)
47043:
$5,625
State:
$7,542
(% of AGI for various income ranges: 140.6% for AGIs $75k-100k)
Earned income credit: $2,210 (reported on 17.5% of returns)
Here:
$2,210
State:
$2,298
(% of AGI for various income ranges: 89.8% for AGIs below $25k, 67.1% for AGIs $25k-50k)
Percentage of individuals using paid preparers for their 2020 taxes: 96.6%
Here:
97%
State:
94%
(% for various income ranges: 95.6% for AGIs below $25k, 96.6% for AGIs $25k-50k, 97.0% for AGIs $50k-75k, 100.0% for AGIs $75k-100k, 96.3% for AGIs $100k-200k, 100.0% for AGIs over 200k)
Averages for the 2012 tax year for zip code 47043, filed in 2013:
Average Adjusted Gross Income (AGI) in 2012: $38,103 (Individual Income Tax Returns)
Here:
$38,103
State:
$52,932
Salary/wage: $36,769 (reported on 81.9% of returns)
Here:
$36,769
State:
$45,173
(% of AGI for various income ranges: 69.5% for AGIs below $25k, 81.5% for AGIs $25k-50k, 85.4% for AGIs $50k-75k, 80.5% for AGIs $75k-100k, 74.9% for AGIs $100k-200k)
Taxable interest for individuals: $824 (reported on 31.0% of returns)
This zip code:
$824
Indiana:
$1,311
(% of AGI for various income ranges: 1.8% for AGIs below $25k, 0.6% for AGIs $25k-50k, 0.5% for AGIs $50k-75k, 0.3% for AGIs $75k-100k, 0.5% for AGIs $100k-200k)
Ordinary dividends: $2,368 (reported on 8.4% of returns)
Here:
$2,368
State:
$4,690
(% of AGI for various income ranges: 0.7% for AGIs below $25k, 0.3% for AGIs $25k-50k, 0.3% for AGIs $50k-75k, 0.6% for AGIs $75k-100k, 0.8% for AGIs $100k-200k)
Net capital gain/loss in AGI: +$3,312 (reported on 10.6% of returns)
Here:
+$3,312
State:
+$10,406
(% of AGI for various income ranges: 0.5% for AGIs below $25k, 0.6% for AGIs $25k-50k, 0.4% for AGIs $50k-75k, 0.1% for AGIs $75k-100k, 2.9% for AGIs $100k-200k)
Profit/loss from business: +$8,882 (reported on 15.0% of returns)
Here:
+$8,882
State:
+$11,105
(% of AGI for various income ranges: 9.2% for AGIs below $25k, 4.7% for AGIs $25k-50k, 1.8% for AGIs $50k-75k, 1.8% for AGIs $75k-100k, 1.4% for AGIs $100k-200k)
Taxable individual retirement arrangement distribution: $9,694 (reported on 7.5% of returns)
47043:
$9,694
Indiana:
$13,841
(% of AGI for various income ranges: 2.4% for AGIs below $25k, 2.0% for AGIs $25k-50k, 2.3% for AGIs $50k-75k, 3.1% for AGIs $75k-100k)
Total itemized deductions: $16,443 (21% of AGI, reported on 18.6% of returns)
Here:
$16,443
State:
$20,913
Here:
21.4% of AGI
State:
18.2% of AGI
(% of AGI for various income ranges: 4.7% for AGIs below $25k, 5.5% for AGIs $25k-50k, 8.5% for AGIs $50k-75k, 9.2% for AGIs $75k-100k, 11.6% for AGIs $100k-200k)
Charity contributions: $3,207 (reported on 11.9% of returns)
Here:
$3,207
State:
$4,697
(% of AGI for various income ranges: 0.6% for AGIs below $25k, 0.6% for AGIs $25k-50k, 0.9% for AGIs $50k-75k, 1.3% for AGIs $75k-100k, 1.6% for AGIs $100k-200k)
Taxes paid: $4,750 (reported on 18.6% of returns)
47043:
$4,750
State:
$7,456
(% of AGI for various income ranges: 0.6% for AGIs below $25k, 1.1% for AGIs $25k-50k, 2.0% for AGIs $50k-75k, 2.8% for AGIs $75k-100k, 4.7% for AGIs $100k-200k)
Earned income credit: $2,223 (reported on 20.8% of returns)
Here:
$2,223
State:
$2,265
(% of AGI for various income ranges: 6.0% for AGIs below $25k, 1.4% for AGIs $25k-50k)
Percentage of individuals using paid preparers for their 2012 taxes: 71.2%
Here:
71%
State:
53%
(% for various income ranges: 70.1% for AGIs below $25k, 69.6% for AGIs $25k-50k, 73.3% for AGIs $50k-75k, 75.0% for AGIs $75k-100k, 76.9% for AGIs $100k-200k)
Averages for the 2004 tax year for zip code 47043, filed in 2005:
Average Adjusted Gross Income (AGI) in 2004: $33,961 (Individual Income Tax Returns)
Here:
$33,961
State:
$44,790
Salary/wage: $32,310 (reported on 85.8% of returns)
Here:
$32,310
State:
$39,615
(% of AGI for various income ranges: 125.2% for AGIs below $10k, 78.0% for AGIs $10k-25k, 83.6% for AGIs $25k-50k, 85.6% for AGIs $50k-75k, 86.0% for AGIs $75k-100k, 61.3% for AGIs over 100k)
Taxable interest for individuals: $1,364 (reported on 35.2% of returns)
This zip code:
$1,364
Indiana:
$1,535
(% of AGI for various income ranges: 8.8% for AGIs below $10k, 2.1% for AGIs $10k-25k, 1.1% for AGIs $25k-50k, 1.2% for AGIs $50k-75k, 0.4% for AGIs $75k-100k, 1.9% for AGIs over 100k)
Taxable dividends: $1,612 (reported on 12.0% of returns)
Here:
$1,612
State:
$2,998
(% of AGI for various income ranges: 3.2% for AGIs below $10k, 0.7% for AGIs $10k-25k, 0.5% for AGIs $25k-50k, 0.3% for AGIs $50k-75k, 0.6% for AGIs $75k-100k, 0.8% for AGIs over 100k)
Net capital gain/loss: +$7,382 (reported on 11.8% of returns)
Here:
+$7,382
State:
+$8,619
(% of AGI for various income ranges: -0.2% for AGIs below $10k, 0.8% for AGIs $10k-25k, 1.3% for AGIs $25k-50k, 1.0% for AGIs $50k-75k, 2.7% for AGIs $75k-100k, 11.2% for AGIs over 100k)
Profit/loss from business: +$7,000 (reported on 14.2% of returns)
Here:
+$7,000
State:
+$10,071
(% of AGI for various income ranges: -2.5% for AGIs below $10k, 5.0% for AGIs $10k-25k, 2.7% for AGIs $25k-50k, 1.9% for AGIs $50k-75k, 5.4% for AGIs $75k-100k, 1.6% for AGIs over 100k)
IRA payment deduction: $2,719 (reported on 1.4% of returns)
47043:
$2,719
Indiana:
$2,840
Total itemized deductions: $14,376 (23% of AGI, reported on 22.3% of returns)
Here:
$14,376
State:
$17,065
Here:
23.3% of AGI
State:
19.5% of AGI
(% of AGI for various income ranges: 16.8% for AGIs below $10k, 6.4% for AGIs $10k-25k, 6.8% for AGIs $25k-50k, 9.9% for AGIs $50k-75k, 12.1% for AGIs $75k-100k, 13.8% for AGIs over 100k)
Charity contributions deductions: $2,454 (4% of AGI, reported on 15.2% of returns)
Here:
$2,454
State:
$3,550
Here:
3.5% of AGI
State:
3.8% of AGI
(% of AGI for various income ranges: 0.5% for AGIs below $10k, 0.4% for AGIs $10k-25k, 0.7% for AGIs $25k-50k, 1.3% for AGIs $50k-75k, 1.5% for AGIs $75k-100k, 2.0% for AGIs over 100k)
Total tax: $3,904 (reported on 72.5% of returns)
47043:
$3,904
State:
$6,914
(% of AGI for various income ranges: 2.8% for AGIs below $10k, 4.1% for AGIs $10k-25k, 6.7% for AGIs $25k-50k, 8.4% for AGIs $50k-75k, 9.8% for AGIs $75k-100k, 15.8% for AGIs over 100k)
Earned income credit: $1,651 (reported on 17.6% of returns)
Here:
$1,651
State:
$1,685
Percentage of individuals using paid preparers for their 2004 taxes: 72.8%
Here:
73%
State:
59%
(% for various income ranges: 63.9% for AGIs below $10k, 77.5% for AGIs $10k-25k, 71.2% for AGIs $25k-50k, 77.8% for AGIs $50k-75k, 71.9% for AGIs $75k-100k, 83.1% for AGIs over 100k)
Likely homosexual households (counted as self-reported same-sex unmarried-partner households)
Lesbian couples: 0.6% of all households
Gay men: 0.4% of all households
Household received Food Stamps/SNAP in the past 12 months: 254 Household did not receive Food Stamps/SNAP in the past 12 months: 1,742
Women who had a birth in the past 12 months: 147 (124 now married, 27 unmarried) Women who did not have a birth in the past 12 months: 830 (333 now married, 496 unmarried)
Housing units in zip code 47043 with a mortgage: 874 (100 second mortgage, 75 both second mortgage and home equity loan) Houses without a mortgage: 36
Median monthly owner costs for units with a mortgage: $1,287 Median monthly owner costs for units without a mortgage: $438
Residents with income below the poverty level in 2022:
This zip code:
14.0%
Whole state:
12.6%
Residents with income below 50% of the poverty level in 2022:
This zip code:
5.6%
Whole state:
6.3%
Median number of rooms in houses and condos:
Here:
6.7
State:
6.6
Median number of rooms in apartments:
Here:
3.8
State:
4.3
Notable locations in this zip code not listed on our city pages
Notable locations in zip code 47043: Switzerland County Courthouse (A), East Enterprise Volunteer Fire Department East Enterprise (B), Moorefield Community Volunteer Fire Department (C), Jefferson Craig Fire and Rescue (D). Display/hide their locations on the map
Churches in zip code 47043 include: Fredonia Church (A), Bethel Chapel (B), Long Run Church (C), Mount Zion Church (D), Plum Creek Church (E), Ebenezer Church (F), Spring Branch Church (G). Display/hide their locations on the map
Cemeteries: McKay Cemetery (1), Union Cemetery (2), Stow Cemetery (3), Slawson Cemetery (4), Old Bethel Cemetery (5). Display/hide their locations on the map
Streams, rivers, and creeks: Pendleton Run (A), Spring Branch (B), Tumblebug Creek (C), Tucker Run (D), Wright Branch (E), Indian Kentuck Creek (F), Indian Creek (G), Hunt Creek (H), Hog Run (I). Display/hide their locations on the map
In group quarters: 100 (-1 institutionalized population)
Size of family households: 597 2-persons, 372 3-persons, 101 4-persons, 78 5-persons, 30 6-persons, 29 7-or-more-persons
Size of nonfamily households: 582 1-person, 201 2-persons, 7 3-persons
551 married couples with children.
301 single-parent households (191 men, 110 women).
95.0% of residents of 47043 zip code speak English at home.
0.6% of residents speak Spanish at home (100% very well).
4.4% of residents speak other Indo-European language at home (100% very well).
0.1% of residents speak other language at home (100% very well).
Foreign born population: 85 (1.8%) (100.0% of them are naturalized citizens)
This zip code:
1.8%
Whole state:
6.1%
112%El Salvador
12%United Kingdom, excluding England and Scotland
11%Sweden
1%Taiwan
29%German
21%American
10%English
6%Irish
4%Scotch-Irish
4%European
3%Scottish
Year of entry for the foreign-born population
02010 or later
662000 to 2009
01990 to 1999
30Before 1990
Facilities with environmental interests located in this zip code:
BESI INC (503 VINEYARD ST in VEVAY, IN)
STATE MASTER (Indiana facility tracking) - ACES-OP-15500004, AIR PROGRAM, CRTK-167, EPCRA CRITERIA AND HAZARDOUS AIR POLLUTANT INVENTORY (Inventory of air pollution sources) (Resource Conservation and Recovery Act (tracking hazardous waste)) TRI REPORTER (Tracking of toxic chemicals releasing facilities) Business SIC classification: WOMEN'S FOOTWEAR, EXCEPT ATHLETIC Business NAICS classification: WOMEN'S FOOTWEAR (EXCEPT ATHLETIC) MANUFACTURING. Organizations: NINE WEST MANUFACTURING CORPORATION (CONTACT/OWNER)
Alternative names: NINE WEST, NINE WEST MFG. CORP., NINE WEST VEVAY
RANDALL TEXTRON (100 RANDALL AVE in VEVAY, IN)
STATE MASTER (Indiana facility tracking) - CRTK-375, EPCRA, UST-8026, UNDERGROUND STORAGE TANK PROGRAM (Resource Conservation and Recovery Act (tracking hazardous waste)) TRI REPORTER (Tracking of toxic chemicals releasing facilities) Business SIC classification: AUTOMOTIVE STAMPINGS Organizations: BURKART RANDALL DIV TEXTRON INC (CONTACT/OWNER)
Alternative names: RANDALL TESTRON
BILL OLDS AUTO BODY (68 TARDY FORD RD in VEVAY, IN)
STATE MASTER (Indiana facility tracking) Conditionally Exempt Small Quantity Generators, less than 100 kg/month of hazardous waste (Resource Conservation and Recovery Act (tracking hazardous waste)) - notification
Housing units lacking complete plumbing facilities: 2.5% Housing units lacking complete kitchen facilities: 4.4%
47.0%Electricity
27.7%Utility gas
14.0%Bottled, tank, or LP gas
8.0%Wood
1.5%Other fuel
1.1%Fuel oil, kerosene, etc.
0.9%No fuel used
Population in 1990: 3,974. Population change in the 1990s: +1,244 (+31.3%).
Place of birth for U.S.-born residents:
This state: 2,892
Northeast: 115
Midwest: 789
South: 601
West: 290
57% of the 47043 zip code residents lived in the same house 5 years ago. Out of people who lived in different houses, 52% lived in this county. Out of people who lived in different counties, 50% lived in Indiana.
88% of the 47043 zip code residents lived in the same house 1 year ago. Out of people who lived in different houses, 55% moved from this county. Out of people who lived in different houses, 32% moved from different county within same state. Out of people who lived in different houses, 9% moved from different state. Out of people who lived in different houses, 3% moved from abroad.
Private vs. public school enrollment:
Students in private schools in grades 1 to 8 (elementary and middle school): 120
Here:
29.4%
Indiana:
14.9%
Students in private schools in grades 9 to 12 (high school):
Here:
0.0%
Indiana:
11.4%
Students in private undergraduate colleges: 29
Here:
26.5%
Indiana:
22.3%
Occupation by median earnings in the past 12 months ($)
90,989Architecture and engineering occupations
81,014Management occupations
69,388Health diagnosing and treating practitioners and other technical occupations
62,798Education, training, and library occupations
56,491Installation, maintenance, and repair occupations
55,152Construction and extraction occupations
Top industries in this zip code by the number of employees in 2005:
Health Care and Social Assistance: Nursing Care Facilities (50-99 employees: 2 establishments)
Accommodation and Food Services: Limited-Service Restaurants (10-19: 3, 5-9: 1)
Accommodation and Food Services: Full-Service Restaurants (20-49: 1, 1-4: 2)
Administrative and Support and Waste Management and Remediation Services: Packaging and Labeling Services (20-49: 1)
Health Care and Social Assistance: Other Individual and Family Services (20-49: 1)
Health Care and Social Assistance: Ambulance Services (10-19: 1)
People in group quarters in 2010:
61 people in nursing facilities/skilled-nursing facilities
42 people in local jails and other municipal confinement facilities
People in group quarters in 2000:
79 people in nursing homes
8 people in homes for the mentally ill
Fatal accident statistics in 2014:
Fatal accident count: 2
Vehicles involved in fatal accidents: 3
Fatal accidents caused by drunken drivers: 0
Fatalities: 2
Persons involved in fatal accidents: 3
Pedestrians involved in fatal accidents: 0
Fatal accident statistics in 2013:
Fatal accident count: 2
Vehicles involved in fatal accidents: 2
Fatal accidents caused by drunken drivers: 0
Fatalities: 2
Persons involved in fatal accidents: 4
Pedestrians involved in fatal accidents: 0
2002 - 2017 National Fire Incident Reporting System (NFIRS) incidents
Based on the data from the years 2002 - 2017 the average number of fires per year is 10. The highest number of reported fire incidents - 33 took place in 2009, and the least - 0 in 2015. The data has a constant trend.
When looking into fire subcategories, the most incidents belonged to: Structure Fires (48.2%), and Outside Fires (39.8%).
Fire incident types reported to NFIRS in Zip Code 47043

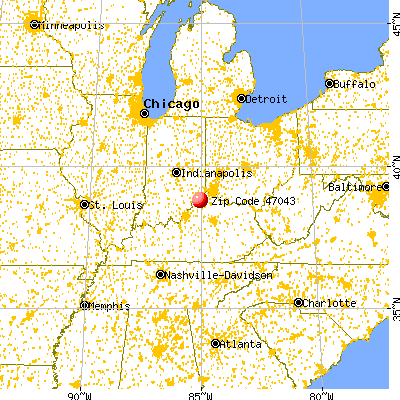


 Nearest zip codes: 41045, 47011, 41008, 47224, 47020, 47017.


 Based on the data from the years 2002 - 2017 the average number of fires per year is 10. The highest number of reported fire incidents - 33 took place in 2009, and the least - 0 in 2015. The data has a constant trend.
 When looking into fire subcategories, the most incidents belonged to: Structure Fires (48.2%), and Outside Fires (39.8%).