Estimated zip code population in 2022: 3,132 Zip code population in 2010: 2,622 Zip code population in 2000: 2,351
Houses and condos: 1,274 Renter-occupied apartments: 192
% of renters here:
17%
State:
29%
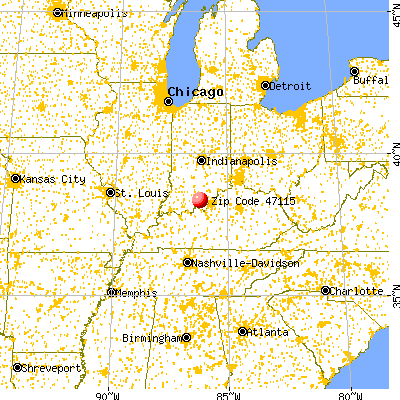
March 2022 cost of living index in zip code 47115: 84.4 (less than average, U.S. average is 100)
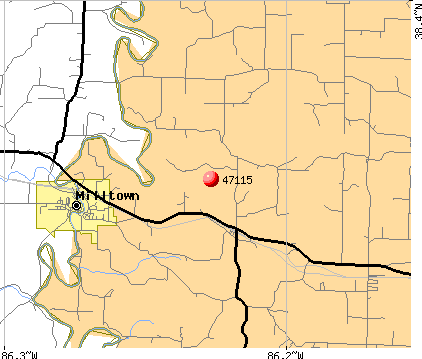
Land area: 57.0 sq. mi. Water area: 0.2 sq. mi.
Population density: 55 people per square mile
(very low).
OSM Map
General Map
Google Map
MSN Map
OSM Map
General Map
Google Map
MSN Map
OSM Map
General Map
Google Map
MSN Map
OSM Map
General Map
Google Map
MSN Map
Please wait while loading the map...
Real estate property taxes paid for housing units in 2022:
This zip code:
0.5% ($1,219)
Indiana:
0.7% ($1,467)
Median real estate property taxes paid for housing units with mortgages in 2022: $1,219 (0.5%) Median real estate property taxes paid for housing units with no mortgage in 2022: $1,239 (0.5%)
Business Search- 14 Million verified businesses
Males: 1,536
(49.1%)
Females: 1,595
(50.9%)
For population 25 years and over in 47115:
High school or higher: 92.0%
Bachelor's degree or higher: 23.1%
Graduate or professional degree: 5.5%
Unemployed: 7.3%
Mean travel time to work (commute): 34.2 minutes
For population 15 years and over in 47115:
Never married: 22.5%
Now married: 61.0%
Separated: 4.1%
Widowed: 3.0%
Divorced: 9.3%
Zip code 47115 compared to state average:
Unemployed percentage above state average.
Black race population percentage significantly below state average.
Hispanic race population percentage significantly below state average.
Foreign-born population percentage significantly below state average.
Renting percentage below state average.
Length of stay since moving in significantly above state average.
Estimated median house/condo value in 2022: $232,003
47115:
$232,003
Indiana:
$208,700
According to our research of Indiana and other state lists, there was 1 registered sex offender living in 47115 zip code as of May 28, 2024. The ratio of all residents to sex offenders in zip code 47115 is 2,624 to 1. The ratio of registered sex offenders to all residents in this zip code is much lower than the state average.
Median resident age:
This zip code:
39.8 years
Indiana median age:
38.2 years
Average household size:
This zip code:
2.7 people
Indiana:
2.4 people
Averages for the 2020 tax year for zip code 47115, filed in 2021:
Average Adjusted Gross Income (AGI) in 2020: $59,796 (Individual Income Tax Returns)
Here:
$59,796
State:
$64,978
Salary/wage: $52,047 (reported on 82.6% of returns)
Here:
$52,047
State:
$55,245
(% of AGI for various income ranges: 1041.6% for AGIs below $25k, 3439.1% for AGIs $25k-50k, 5958.6% for AGIs $50k-75k, 9824.4% for AGIs $75k-100k, 13641.7% for AGIs $100k-200k)
Taxable interest for individuals: $700 (reported on 27.0% of returns)
This zip code:
$700
Indiana:
$1,351
(% of AGI for various income ranges: 10.4% for AGIs below $25k, 7.8% for AGIs $25k-50k, 29.3% for AGIs $50k-75k, 3.3% for AGIs $75k-100k, 107.5% for AGIs $100k-200k)
Ordinary dividends: $2,938 (reported on 18.3% of returns)
Here:
$2,938
State:
$5,827
(% of AGI for various income ranges: 27.6% for AGIs below $25k, 40.0% for AGIs $25k-50k, 98.6% for AGIs $50k-75k, 14.4% for AGIs $75k-100k, 254.2% for AGIs $100k-200k)
Net capital gain/loss in AGI: +$10,617 (reported on 15.7% of returns)
Here:
+$10,617
State:
+$17,730
(% of AGI for various income ranges: 25.2% for AGIs below $25k, 26.5% for AGIs $25k-50k, 80.7% for AGIs $50k-75k, 106.7% for AGIs $75k-100k, 1315.0% for AGIs $100k-200k)
Profit/loss from business: +$9,000 (reported on 13.0% of returns)
Here:
+$9,000
State:
+$12,144
(% of AGI for various income ranges: 101.6% for AGIs below $25k, 175.7% for AGIs $25k-50k, 441.1% for AGIs $75k-100k, 245.8% for AGIs $100k-200k)
Taxable individual retirement arrangement distribution: $10,355 (reported on 9.6% of returns)
47115:
$10,355
Indiana:
$18,302
(% of AGI for various income ranges: 58.4% for AGIs below $25k, 118.7% for AGIs $25k-50k, 167.1% for AGIs $50k-75k, 405.0% for AGIs $100k-200k)
Total itemized deductions: $25,000 (reported on 2.6% of returns)
Here:
$25,000
State:
$35,601
(% of AGI for various income ranges: 833.3% for AGIs $75k-100k)
Taxes paid: $6,000 (reported on 2.6% of returns)
47115:
$6,000
State:
$7,542
(% of AGI for various income ranges: 200.0% for AGIs $75k-100k)
Earned income credit: $2,224 (reported on 14.8% of returns)
Here:
$2,224
State:
$2,298
(% of AGI for various income ranges: 78.4% for AGIs below $25k, 79.1% for AGIs $25k-50k)
Percentage of individuals using paid preparers for their 2020 taxes: 94.8%
Here:
95%
State:
94%
(% for various income ranges: 92.1% for AGIs below $25k, 92.9% for AGIs $25k-50k, 94.4% for AGIs $50k-75k, 100.0% for AGIs $75k-100k, 100.0% for AGIs $100k-200k, 100.0% for AGIs over 200k)
Averages for the 2012 tax year for zip code 47115, filed in 2013:
Average Adjusted Gross Income (AGI) in 2012: $46,600 (Individual Income Tax Returns)
Here:
$46,600
State:
$52,932
Salary/wage: $45,548 (reported on 84.0% of returns)
Here:
$45,548
State:
$45,173
(% of AGI for various income ranges: 69.3% for AGIs below $25k, 83.3% for AGIs $25k-50k, 80.0% for AGIs $50k-75k, 85.8% for AGIs $75k-100k, 84.5% for AGIs $100k-200k)
Taxable interest for individuals: $512 (reported on 31.1% of returns)
This zip code:
$512
Indiana:
$1,311
(% of AGI for various income ranges: 1.2% for AGIs below $25k, 0.2% for AGIs $25k-50k, 0.3% for AGIs $50k-75k, 0.2% for AGIs $75k-100k, 0.2% for AGIs $100k-200k)
Ordinary dividends: $1,648 (reported on 19.8% of returns)
Here:
$1,648
State:
$4,690
(% of AGI for various income ranges: 1.0% for AGIs below $25k, 0.5% for AGIs $25k-50k, 0.8% for AGIs $50k-75k, 0.3% for AGIs $75k-100k, 0.9% for AGIs $100k-200k)
Net capital gain/loss in AGI: +$2,620 (reported on 14.2% of returns)
Here:
+$2,620
State:
+$10,406
(% of AGI for various income ranges: 0.8% for AGIs below $25k, 0.8% for AGIs $50k-75k, 1.0% for AGIs $75k-100k, 1.3% for AGIs $100k-200k)
Profit/loss from business: +$6,129 (reported on 16.0% of returns)
Here:
+$6,129
State:
+$11,105
(% of AGI for various income ranges: 10.1% for AGIs below $25k, 2.2% for AGIs $25k-50k, 1.9% for AGIs $50k-75k, 1.4% for AGIs $75k-100k)
Taxable individual retirement arrangement distribution: $11,911 (reported on 8.5% of returns)
47115:
$11,911
Indiana:
$13,841
(% of AGI for various income ranges: 3.5% for AGIs below $25k, 2.0% for AGIs $25k-50k, 3.0% for AGIs $50k-75k, 4.4% for AGIs $75k-100k)
Total itemized deductions: $18,305 (21% of AGI, reported on 20.8% of returns)
Here:
$18,305
State:
$20,913
Here:
20.7% of AGI
State:
18.2% of AGI
(% of AGI for various income ranges: 7.7% for AGIs below $25k, 7.7% for AGIs $25k-50k, 5.8% for AGIs $50k-75k, 9.5% for AGIs $75k-100k, 9.2% for AGIs $100k-200k)
Charity contributions: $2,994 (reported on 16.0% of returns)
Here:
$2,994
State:
$4,697
(% of AGI for various income ranges: 1.0% for AGIs $25k-50k, 0.7% for AGIs $50k-75k, 1.3% for AGIs $75k-100k, 1.4% for AGIs $100k-200k)
Taxes paid: $5,773 (reported on 20.8% of returns)
47115:
$5,773
State:
$7,456
(% of AGI for various income ranges: 0.8% for AGIs below $25k, 1.5% for AGIs $25k-50k, 1.7% for AGIs $50k-75k, 3.1% for AGIs $75k-100k, 4.1% for AGIs $100k-200k)
Earned income credit: $2,210 (reported on 18.9% of returns)
Here:
$2,210
State:
$2,265
(% of AGI for various income ranges: 6.0% for AGIs below $25k, 1.4% for AGIs $25k-50k)
Percentage of individuals using paid preparers for their 2012 taxes: 66.0%
Here:
66%
State:
53%
(% for various income ranges: 60.5% for AGIs below $25k, 66.7% for AGIs $25k-50k, 66.7% for AGIs $50k-75k, 72.7% for AGIs $75k-100k, 80.0% for AGIs $100k-200k)
Averages for the 2004 tax year for zip code 47115, filed in 2005:
Average Adjusted Gross Income (AGI) in 2004: $36,942 (Individual Income Tax Returns)
Here:
$36,942
State:
$44,790
Salary/wage: $35,610 (reported on 86.8% of returns)
Here:
$35,610
State:
$39,615
(% of AGI for various income ranges: 129.1% for AGIs below $10k, 79.7% for AGIs $10k-25k, 86.9% for AGIs $25k-50k, 88.5% for AGIs $50k-75k, 89.2% for AGIs $75k-100k, 63.8% for AGIs over 100k)
Taxable interest for individuals: $1,068 (reported on 42.8% of returns)
This zip code:
$1,068
Indiana:
$1,535
(% of AGI for various income ranges: 7.8% for AGIs below $10k, 2.3% for AGIs $10k-25k, 1.3% for AGIs $25k-50k, 0.9% for AGIs $50k-75k, 0.2% for AGIs $75k-100k, 1.3% for AGIs over 100k)
Taxable dividends: $1,295 (reported on 21.6% of returns)
Here:
$1,295
State:
$2,998
(% of AGI for various income ranges: 2.6% for AGIs below $10k, 1.6% for AGIs $10k-25k, 0.5% for AGIs $25k-50k, 0.6% for AGIs $50k-75k, 0.4% for AGIs $75k-100k, 0.9% for AGIs over 100k)
Net capital gain/loss: +$1,941 (reported on 13.8% of returns)
Here:
+$1,941
State:
+$8,619
(% of AGI for various income ranges: -2.7% for AGIs below $10k, 0.6% for AGIs $10k-25k, 0.8% for AGIs $25k-50k, 0.7% for AGIs $50k-75k, 0.6% for AGIs $75k-100k, 1.1% for AGIs over 100k)
Profit/loss from business: +$4,000 (reported on 15.9% of returns)
Here:
+$4,000
State:
+$10,071
(% of AGI for various income ranges: 35.0% for AGIs below $10k, 5.7% for AGIs $10k-25k, 2.3% for AGIs $25k-50k, -0.2% for AGIs $50k-75k, -0.8% for AGIs over 100k)
IRA payment deduction: $2,000 (reported on 1.5% of returns)
47115:
$2,000
Indiana:
$2,840
Total itemized deductions: $15,543 (21% of AGI, reported on 25.1% of returns)
Here:
$15,543
State:
$17,065
Here:
21.3% of AGI
State:
19.5% of AGI
(% of AGI for various income ranges: 7.5% for AGIs $10k-25k, 9.0% for AGIs $25k-50k, 11.3% for AGIs $50k-75k, 15.3% for AGIs $75k-100k, 10.6% for AGIs over 100k)
Charity contributions deductions: $2,848 (4% of AGI, reported on 20.9% of returns)
Here:
$2,848
State:
$3,550
Here:
3.7% of AGI
State:
3.8% of AGI
(% of AGI for various income ranges: 0.7% for AGIs $10k-25k, 1.1% for AGIs $25k-50k, 1.7% for AGIs $50k-75k, 2.3% for AGIs $75k-100k, 2.5% for AGIs over 100k)
Total tax: $4,147 (reported on 72.6% of returns)
47115:
$4,147
State:
$6,914
(% of AGI for various income ranges: 5.8% for AGIs below $10k, 4.1% for AGIs $10k-25k, 5.9% for AGIs $25k-50k, 8.2% for AGIs $50k-75k, 9.0% for AGIs $75k-100k, 13.8% for AGIs over 100k)
Earned income credit: $1,783 (reported on 15.9% of returns)
Here:
$1,783
State:
$1,685
Percentage of individuals using paid preparers for their 2004 taxes: 71.7%
Here:
72%
State:
59%
(% for various income ranges: 66.0% for AGIs below $10k, 72.6% for AGIs $10k-25k, 74.0% for AGIs $25k-50k, 74.2% for AGIs $50k-75k, 71.6% for AGIs $75k-100k, 73.5% for AGIs over 100k)
Household received Food Stamps/SNAP in the past 12 months: 83 Household did not receive Food Stamps/SNAP in the past 12 months: 1,058
Women who had a birth in the past 12 months: 56 (41 now married, 15 unmarried) Women who did not have a birth in the past 12 months: 622 (423 now married, 201 unmarried)
Housing units in zip code 47115 with a mortgage: 565 (57 second mortgage, 44 both second mortgage and home equity loan) Houses without a mortgage: 42
Median monthly owner costs for units with a mortgage: $1,184 Median monthly owner costs for units without a mortgage: $473
Residents with income below the poverty level in 2022:
This zip code:
2.3%
Whole state:
12.6%
Residents with income below 50% of the poverty level in 2022:
This zip code:
0.7%
Whole state:
6.3%
Median number of rooms in houses and condos:
Here:
6.3
State:
6.6
Median number of rooms in apartments:
Here:
3.9
State:
4.3
Notable locations in this zip code not listed on our city pages
Churches in zip code 47115 include: Haas Chapel (A), Blue River Church (B), Loudens Chapel (C), Mount Tabor Church (D), Saint Bernards Church (E), Thompson Chapel (F). Display/hide their locations on the map
Cemeteries: Mount Zion Cemetery (1), Boston Cemetery (2), Breedlove Cemetery (3), Satenfield Cemetery (4), Fairdale Cemetery (5), Reno Cemetery (6), Saint Bernards Cemetery (7). Display/hide their locations on the map
Size of family households: 309 2-persons, 151 3-persons, 132 4-persons, 70 5-persons, 52 6-persons, 6 7-or-more-persons
Size of nonfamily households: 295 1-person, 125 2-persons
512 married couples with children.
39 single-parent households (35 men, 4 women).
97.9% of residents of 47115 zip code speak English at home.
0.6% of residents speak Spanish at home (100% very well).
0.3% of residents speak other Indo-European language at home (20% well, 80% not well).
Foreign born population: 6 (0.2%) (100.0% of them are naturalized citizens)
This zip code:
0.2%
Whole state:
6.1%
38%American
19%German
14%Irish
9%English
2%Scottish
2%British
2%Italian
Year of entry for the foreign-born population
02010 or later
62000 to 2009
01990 to 1999
0Before 1990
Facilities with environmental interests located in this zip code:
DAVIS CRUSHED STONE & LIME CO (8605 BIG JOHN ROAD NW in DEPAUW, IN)
AIR MINOR (AIRS/AFS) STATE MASTER (Indiana facility tracking) - ACES-OP-06100026, AIR PROGRAM Business SIC classification: CRUSHED AND BROKEN LIMESTONE
MILLTOWN MUNICIPAL WWTP (1008 DUKES RD in DEPAUW, IN)
STATE MASTER (Indiana facility tracking) National Pollutant Discharge Elimination System NON-MAJOR (Tracking pollutant discharge elimination systems) - permit Business SIC classification: SEWERAGE SYSTEMS Organizations: JAMES PEVLOR 13796 (CONTACT/OPERATOR)
, TOWN COUNCIL PRESIDENT (CONTACT/OWNER)
Alternative names: MILLTOWN MUNICIPAL STP
Housing units lacking complete plumbing facilities: 6.2% Housing units lacking complete kitchen facilities: 6.9%
46.6%Electricity
28.6%Bottled, tank, or LP gas
11.8%Utility gas
10.7%Wood
1.3%Fuel oil, kerosene, etc.
1.2%Other fuel
Population in 1990: 3,269.
Place of birth for U.S.-born residents:
This state: 2,050
Northeast: 13
Midwest: 166
South: 810
West: 45
75% of the 47115 zip code residents lived in the same house 5 years ago. Out of people who lived in different houses, 41% lived in this county. Out of people who lived in different counties, 50% lived in Indiana.
99% of the 47115 zip code residents lived in the same house 1 year ago. Out of people who lived in different houses, 29% moved from this county. Out of people who lived in different houses, 26% moved from different county within same state. Out of people who lived in different houses, 89% moved from different state.
Private vs. public school enrollment:
Students in private schools in grades 1 to 8 (elementary and middle school): 2
Here:
1.1%
Indiana:
14.9%
Students in private schools in grades 9 to 12 (high school): 2
Here:
3.6%
Indiana:
11.4%
Students in private undergraduate colleges: 106
Here:
56.1%
Indiana:
22.3%
Occupation by median earnings in the past 12 months ($)
83,035Health diagnosing and treating practitioners and other technical occupations
73,696Installation, maintenance, and repair occupations
70,630Sales and related occupations
69,356Education, training, and library occupations
68,502Management occupations
61,206Business and financial operations occupations
Top industries in this zip code by the number of employees in 2005:
Mining: Crushed and Broken Limestone Mining and Quarrying (20-49 employees: 1 establishment, 10-19 employees: 1 establishment)
Construction: Roofing Contractors (10-19: 1)
Finance and Insurance: Direct Property and Casualty Insurance Carriers (5-9: 1, 1-4: 1)
Wholesale Trade: Motor Vehicle Parts (Used) Merchant Wholesalers (1-4: 1)
Health Care and Social Assistance: Residential Mental Retardation Facilities (1-4: 1)
People in group quarters in 2010:
6 people in group homes for juveniles (non-correctional)
Fatal accident statistics in 2013:
Fatal accident count: 3
Vehicles involved in fatal accidents: 3
Fatal accidents caused by drunken drivers: 0
Fatalities: 3
Persons involved in fatal accidents: 4
Pedestrians involved in fatal accidents: 0
Fatal accident statistics in 2011:
Fatal accident count: 1
Vehicles involved in fatal accidents: 1
Fatal accidents caused by drunken drivers: 0
Fatalities: 1
Persons involved in fatal accidents: 3
Pedestrians involved in fatal accidents: 0
Home Mortgage Disclosure Act Aggregated Statistics For Year 2009 (Based on 4 partial tracts)
A) FHA, FSA/RHS & VA Home Purchase Loans
B) Conventional Home Purchase Loans
C) Refinancings
D) Home Improvement Loans
E) Loans on Dwellings For 5+ Families
F) Non-occupant Loans on < 5 Family Dwellings (A B C & D)
G) Loans On Manufactured Home Dwelling (A B C & D)
Number
Average Value
Number
Average Value
Number
Average Value
Number
Average Value
Number
Average Value
Number
Average Value
Number
Average Value
LOANS ORIGINATED
42
$115,174
39
$110,538
234
$119,173
7
$122,796
1
$471,740
12
$140,562
37
$60,995
APPLICATIONS APPROVED, NOT ACCEPTED
2
$85,080
6
$36,493
26
$134,452
1
$10,950
0
$0
2
$60,655
8
$40,799
APPLICATIONS DENIED
14
$104,132
13
$109,859
94
$131,466
9
$50,071
0
$0
2
$74,165
10
$72,647
APPLICATIONS WITHDRAWN
4
$117,912
6
$68,742
60
$124,786
1
$10,950
0
$0
3
$108,670
6
$81,688
FILES CLOSED FOR INCOMPLETENESS
2
$116,400
0
$0
14
$142,076
1
$10,950
0
$0
0
$0
1
$73,340
Aggregated Statistics For Year 2008 (Based on 4 partial tracts)
A) FHA, FSA/RHS & VA Home Purchase Loans
B) Conventional Home Purchase Loans
C) Refinancings
D) Home Improvement Loans
F) Non-occupant Loans on < 5 Family Dwellings (A B C & D)
G) Loans On Manufactured Home Dwelling (A B C & D)
Number
Average Value
Number
Average Value
Number
Average Value
Number
Average Value
Number
Average Value
Number
Average Value
LOANS ORIGINATED
38
$119,320
44
$98,043
159
$103,214
16
$45,824
11
$68,577
35
$66,965
APPLICATIONS APPROVED, NOT ACCEPTED
1
$186,110
12
$86,768
25
$134,726
2
$79,605
2
$69,730
4
$35,370
APPLICATIONS DENIED
10
$143,282
16
$81,662
91
$117,465
17
$76,169
3
$70,480
21
$62,883
APPLICATIONS WITHDRAWN
5
$114,070
7
$105,007
43
$139,773
1
$92,970
1
$7,220
3
$58,460
FILES CLOSED FOR INCOMPLETENESS
1
$70,010
1
$124,450
9
$138,296
0
$0
0
$0
0
$0
Aggregated Statistics For Year 2007 (Based on 4 partial tracts)
A) FHA, FSA/RHS & VA Home Purchase Loans
B) Conventional Home Purchase Loans
C) Refinancings
D) Home Improvement Loans
E) Loans on Dwellings For 5+ Families
F) Non-occupant Loans on < 5 Family Dwellings (A B C & D)
G) Loans On Manufactured Home Dwelling (A B C & D)
Number
Average Value
Number
Average Value
Number
Average Value
Number
Average Value
Number
Average Value
Number
Average Value
Number
Average Value
LOANS ORIGINATED
25
$104,250
95
$99,362
167
$94,753
26
$40,513
1
$84,240
25
$105,775
52
$71,550
APPLICATIONS APPROVED, NOT ACCEPTED
2
$144,735
18
$65,199
33
$108,516
3
$25,600
0
$0
2
$29,065
7
$33,764
APPLICATIONS DENIED
5
$108,330
24
$84,640
118
$106,221
25
$38,827
0
$0
1
$132,520
37
$76,838
APPLICATIONS WITHDRAWN
6
$89,237
11
$96,355
40
$113,932
2
$44,870
0
$0
1
$65,010
4
$97,548
FILES CLOSED FOR INCOMPLETENESS
0
$0
2
$149,485
17
$103,972
1
$21,060
0
$0
0
$0
2
$62,755
Aggregated Statistics For Year 2006 (Based on 4 partial tracts)
A) FHA, FSA/RHS & VA Home Purchase Loans
B) Conventional Home Purchase Loans
C) Refinancings
D) Home Improvement Loans
E) Loans on Dwellings For 5+ Families
F) Non-occupant Loans on < 5 Family Dwellings (A B C & D)
G) Loans On Manufactured Home Dwelling (A B C & D)
Number
Average Value
Number
Average Value
Number
Average Value
Number
Average Value
Number
Average Value
Number
Average Value
Number
Average Value
LOANS ORIGINATED
23
$103,869
124
$102,473
204
$79,299
38
$36,582
0
$0
23
$94,496
61
$61,820
APPLICATIONS APPROVED, NOT ACCEPTED
2
$74,550
21
$74,703
30
$78,632
7
$40,590
0
$0
1
$32,010
16
$35,978
APPLICATIONS DENIED
4
$113,750
38
$96,789
130
$98,210
24
$39,735
2
$74,130
3
$184,850
32
$64,623
APPLICATIONS WITHDRAWN
2
$94,900
24
$71,327
63
$108,736
1
$47,320
0
$0
1
$73,340
6
$66,530
FILES CLOSED FOR INCOMPLETENESS
1
$83,400
4
$94,788
18
$117,982
0
$0
0
$0
1
$37,780
0
$0
Aggregated Statistics For Year 2005 (Based on 4 partial tracts)
A) FHA, FSA/RHS & VA Home Purchase Loans
B) Conventional Home Purchase Loans
C) Refinancings
D) Home Improvement Loans
F) Non-occupant Loans on < 5 Family Dwellings (A B C & D)
G) Loans On Manufactured Home Dwelling (A B C & D)
Number
Average Value
Number
Average Value
Number
Average Value
Number
Average Value
Number
Average Value
Number
Average Value
LOANS ORIGINATED
35
$104,542
103
$94,086
201
$93,443
28
$32,864
16
$86,960
51
$67,963
APPLICATIONS APPROVED, NOT ACCEPTED
1
$40,560
23
$77,140
27
$107,307
2
$40,500
3
$63,633
10
$35,131
APPLICATIONS DENIED
8
$92,390
43
$85,036
130
$103,737
17
$54,495
3
$65,450
44
$65,734
APPLICATIONS WITHDRAWN
2
$102,230
16
$109,955
78
$111,936
11
$147,248
0
$0
8
$81,300
FILES CLOSED FOR INCOMPLETENESS
1
$72,230
9
$98,972
22
$121,307
0
$0
0
$0
1
$67,390
Aggregated Statistics For Year 2004 (Based on 4 partial tracts)
A) FHA, FSA/RHS & VA Home Purchase Loans
B) Conventional Home Purchase Loans
C) Refinancings
D) Home Improvement Loans
F) Non-occupant Loans on < 5 Family Dwellings (A B C & D)
G) Loans On Manufactured Home Dwelling (A B C & D)
Number
Average Value
Number
Average Value
Number
Average Value
Number
Average Value
Number
Average Value
Number
Average Value
LOANS ORIGINATED
31
$97,891
118
$93,437
245
$82,603
28
$51,947
19
$66,784
60
$60,190
APPLICATIONS APPROVED, NOT ACCEPTED
3
$104,390
13
$95,148
51
$95,857
3
$61,507
4
$75,370
11
$53,615
APPLICATIONS DENIED
8
$82,861
55
$76,189
142
$85,868
17
$38,577
6
$43,562
49
$59,222
APPLICATIONS WITHDRAWN
5
$79,990
19
$96,234
55
$94,569
3
$60,723
1
$50,540
6
$88,100
FILES CLOSED FOR INCOMPLETENESS
2
$90,980
3
$93,050
25
$96,777
2
$66,845
1
$88,450
1
$32,870
Aggregated Statistics For Year 2003 (Based on 4 partial tracts)
A) FHA, FSA/RHS & VA Home Purchase Loans
B) Conventional Home Purchase Loans
C) Refinancings
D) Home Improvement Loans
E) Loans on Dwellings For 5+ Families
F) Non-occupant Loans on < 5 Family Dwellings (A B C & D)
Detailed PMIC statistics for the following Tracts:0601.00
, 0602.00
2002 - 2018 National Fire Incident Reporting System (NFIRS) incidents
According to the data from the years 2002 - 2018 the average number of fires per year is 8. The highest number of fire incidents - 20 took place in 2011, and the least - 2 in 2014. The data has a rising trend.
When looking into fire subcategories, the most reports belonged to: Outside Fires (43.2%), and Structure Fires (41.7%).
Fire incident types reported to NFIRS in Zip Code 47115


 Nearest zip codes: 47166, 47145, 47161, 47120, 47164, 47114.


 According to the data from the years 2002 - 2018 the average number of fires per year is 8. The highest number of fire incidents - 20 took place in 2011, and the least - 2 in 2014. The data has a rising trend.
 When looking into fire subcategories, the most reports belonged to: Outside Fires (43.2%), and Structure Fires (41.7%).