Estimated zip code population in 2022: 5,471 Zip code population in 2010: 4,264 Zip code population in 2000: 3,821
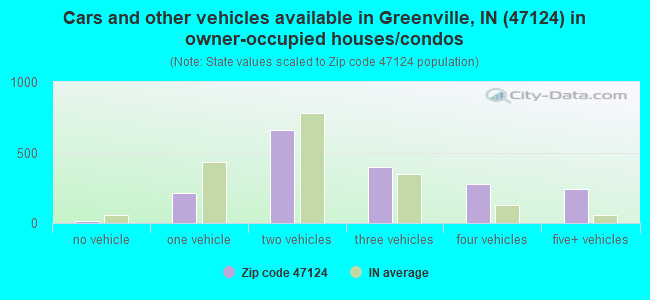
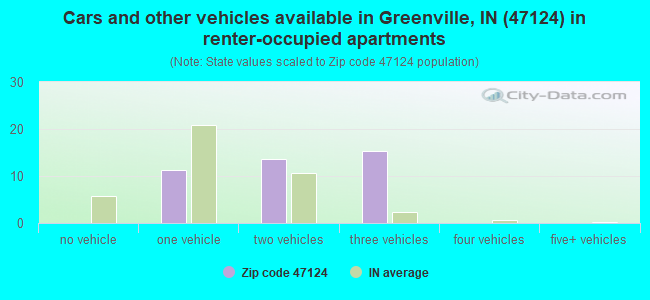
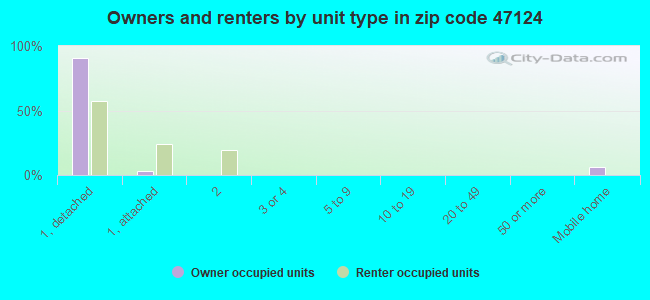
Houses and condos: 2,004 Renter-occupied apartments: 42
% of renters here:
2%
State:
29%
March 2022 cost of living index in zip code 47124: 87.4 (less than average, U.S. average is 100)
Land area: 24.5 sq. mi. Water area: 0.1 sq. mi.
Population density: 223 people per square mile
(very low).
OSM Map
General Map
Google Map
MSN Map
OSM Map
General Map
Google Map
MSN Map
OSM Map
General Map
Google Map
MSN Map
OSM Map
General Map
Google Map
MSN Map
Please wait while loading the map...
Real estate property taxes paid for housing units in 2022:
This zip code:
0.5% ($1,658)
Indiana:
0.7% ($1,467)
Median real estate property taxes paid for housing units with mortgages in 2022: $1,639 (0.5%) Median real estate property taxes paid for housing units with no mortgage in 2022: $1,749 (0.6%)
Business Search- 14 Million verified businesses
Males: 2,852
(52.1%)
Females: 2,619
(47.9%)
For population 25 years and over in 47124:
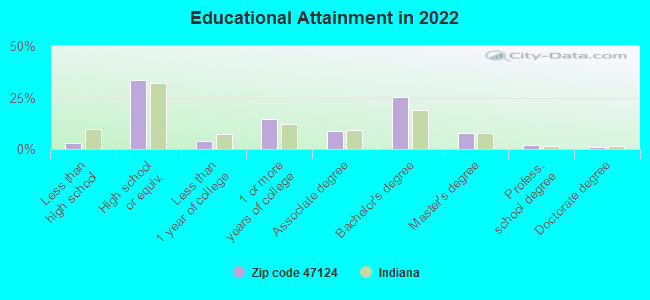
High school or higher: 96.6%
Bachelor's degree or higher: 36.2%
Graduate or professional degree: 10.8%
Unemployed: 1.3%
Mean travel time to work (commute): 31.3 minutes
For population 15 years and over in 47124:
Never married: 20.9%
Now married: 63.9%
Separated: 0.1%
Widowed: 5.9%
Divorced: 9.2%
Zip code 47124 compared to state average:
Median household income above state average.
Median house value above state average.
Unemployed percentage below state average.
Black race population percentage significantly below state average.
Hispanic race population percentage significantly below state average.
Median age above state average.
Foreign-born population percentage significantly below state average.
Renting percentage significantly below state average.
Length of stay since moving in significantly above state average.
Estimated median house/condo value in 2022: $315,664
47124:
$315,664
Indiana:
$208,700
Median resident age:
This zip code:
44.1 years
Indiana median age:
38.2 years
Average household size:
This zip code:
3.0 people
Indiana:
2.4 people
Averages for the 2020 tax year for zip code 47124, filed in 2021:
Average Adjusted Gross Income (AGI) in 2020: $81,046 (Individual Income Tax Returns)
Here:
$81,046
State:
$64,978
Salary/wage: $73,399 (reported on 82.6% of returns)
Here:
$73,399
State:
$55,245
(% of AGI for various income ranges: 978.4% for AGIs below $25k, 3529.2% for AGIs $25k-50k, 6507.2% for AGIs $50k-75k, 8607.7% for AGIs $75k-100k, 19061.0% for AGIs $100k-200k, 63138.0% for AGIs over 200k)
Taxable interest for individuals: $835 (reported on 32.6% of returns)
This zip code:
$835
Indiana:
$1,351
(% of AGI for various income ranges: 14.4% for AGIs below $25k, 14.9% for AGIs $25k-50k, 18.8% for AGIs $50k-75k, 24.5% for AGIs $75k-100k, 51.6% for AGIs $100k-200k, 530.0% for AGIs over 200k)
Ordinary dividends: $3,804 (reported on 21.6% of returns)
Here:
$3,804
State:
$5,827
(% of AGI for various income ranges: 26.0% for AGIs below $25k, 35.7% for AGIs $25k-50k, 65.6% for AGIs $50k-75k, 87.3% for AGIs $75k-100k, 134.2% for AGIs $100k-200k, 1848.0% for AGIs over 200k)
Net capital gain/loss in AGI: +$9,479 (reported on 17.8% of returns)
Here:
+$9,479
State:
+$17,730
(% of AGI for various income ranges: 14.7% for AGIs below $25k, 11.6% for AGIs $25k-50k, 82.4% for AGIs $50k-75k, 129.1% for AGIs $75k-100k, 294.8% for AGIs $100k-200k, 4942.0% for AGIs over 200k)
Profit/loss from business: +$11,523 (reported on 13.1% of returns)
Here:
+$11,523
State:
+$12,144
(% of AGI for various income ranges: 80.2% for AGIs below $25k, 139.5% for AGIs $25k-50k, 172.4% for AGIs $50k-75k, 184.5% for AGIs $75k-100k, 371.0% for AGIs $100k-200k, 1448.0% for AGIs over 200k)
Taxable individual retirement arrangement distribution: $19,863 (reported on 11.4% of returns)
47124:
$19,863
Indiana:
$18,302
(% of AGI for various income ranges: 75.8% for AGIs below $25k, 143.2% for AGIs $25k-50k, 281.2% for AGIs $50k-75k, 348.6% for AGIs $75k-100k, 474.5% for AGIs $100k-200k, 3132.0% for AGIs over 200k)
Total itemized deductions: $34,877 (reported on 5.5% of returns)
Here:
$34,877
State:
$35,601
(% of AGI for various income ranges: 227.6% for AGIs $25k-50k, 252.3% for AGIs $75k-100k, 330.0% for AGIs $100k-200k, 4228.0% for AGIs over 200k)
Charity contributions: $11,827 (reported on 4.7% of returns)
Here:
$11,827
State:
$15,596
(% of AGI for various income ranges: 73.6% for AGIs $50k-75k, 100.6% for AGIs $100k-200k, 1610.0% for AGIs over 200k)
Taxes paid: $7,538 (reported on 5.5% of returns)
47124:
$7,538
State:
$7,542
(% of AGI for various income ranges: 34.3% for AGIs $25k-50k, 52.3% for AGIs $75k-100k, 106.1% for AGIs $100k-200k, 818.0% for AGIs over 200k)
Earned income credit: $1,975 (reported on 8.5% of returns)
Here:
$1,975
State:
$2,298
(% of AGI for various income ranges: 50.7% for AGIs below $25k, 47.8% for AGIs $25k-50k)
Percentage of individuals using paid preparers for their 2020 taxes: 94.9%
Here:
95%
State:
94%
(% for various income ranges: 93.4% for AGIs below $25k, 97.8% for AGIs $25k-50k, 97.1% for AGIs $50k-75k, 93.1% for AGIs $75k-100k, 94.3% for AGIs $100k-200k, 92.3% for AGIs over 200k)
Averages for the 2012 tax year for zip code 47124, filed in 2013:
Average Adjusted Gross Income (AGI) in 2012: $64,974 (Individual Income Tax Returns)
Here:
$64,974
State:
$52,932
Salary/wage: $56,100 (reported on 86.7% of returns)
Here:
$56,100
State:
$45,173
(% of AGI for various income ranges: 72.5% for AGIs below $25k, 78.8% for AGIs $25k-50k, 78.7% for AGIs $50k-75k, 84.1% for AGIs $75k-100k, 82.9% for AGIs $100k-200k, 52.6% for AGIs over 200k)
Taxable interest for individuals: $677 (reported on 35.3% of returns)
This zip code:
$677
Indiana:
$1,311
(% of AGI for various income ranges: 0.8% for AGIs below $25k, 0.4% for AGIs $25k-50k, 0.6% for AGIs $50k-75k, 0.3% for AGIs $75k-100k, 0.3% for AGIs $100k-200k, 0.3% for AGIs over 200k)
Ordinary dividends: $2,330 (reported on 22.9% of returns)
Here:
$2,330
State:
$4,690
(% of AGI for various income ranges: 1.4% for AGIs below $25k, 0.8% for AGIs $25k-50k, 0.9% for AGIs $50k-75k, 0.4% for AGIs $75k-100k, 1.0% for AGIs $100k-200k, 0.7% for AGIs over 200k)
Net capital gain/loss in AGI: +$3,247 (reported on 17.4% of returns)
Here:
+$3,247
State:
+$10,406
(% of AGI for various income ranges: 0.2% for AGIs $25k-50k, 0.3% for AGIs $50k-75k, 1.5% for AGIs $100k-200k, 1.7% for AGIs over 200k)
Profit/loss from business: +$7,988 (reported on 14.7% of returns)
Here:
+$7,988
State:
+$11,105
(% of AGI for various income ranges: 3.7% for AGIs below $25k, 2.3% for AGIs $25k-50k, 2.2% for AGIs $50k-75k, 1.6% for AGIs $75k-100k, 2.4% for AGIs $100k-200k)
Taxable individual retirement arrangement distribution: $12,056 (reported on 11.5% of returns)
47124:
$12,056
Indiana:
$13,841
(% of AGI for various income ranges: 4.1% for AGIs below $25k, 2.6% for AGIs $25k-50k, 3.2% for AGIs $50k-75k, 2.0% for AGIs $75k-100k, 2.6% for AGIs $100k-200k)
Total itemized deductions: $20,538 (18% of AGI, reported on 37.2% of returns)
Here:
$20,538
State:
$20,913
Here:
17.7% of AGI
State:
18.2% of AGI
(% of AGI for various income ranges: 8.7% for AGIs below $25k, 10.0% for AGIs $25k-50k, 10.6% for AGIs $50k-75k, 13.7% for AGIs $75k-100k, 12.5% for AGIs $100k-200k, 11.9% for AGIs over 200k)
Charity contributions: $3,734 (reported on 32.1% of returns)
Here:
$3,734
State:
$4,697
(% of AGI for various income ranges: 0.8% for AGIs below $25k, 1.2% for AGIs $25k-50k, 1.6% for AGIs $50k-75k, 1.7% for AGIs $75k-100k, 2.0% for AGIs $100k-200k, 2.6% for AGIs over 200k)
Taxes paid: $7,543 (reported on 37.2% of returns)
47124:
$7,543
State:
$7,456
(% of AGI for various income ranges: 1.2% for AGIs below $25k, 2.3% for AGIs $25k-50k, 3.2% for AGIs $50k-75k, 4.8% for AGIs $75k-100k, 5.1% for AGIs $100k-200k, 5.5% for AGIs over 200k)
Earned income credit: $2,071 (reported on 11.0% of returns)
Here:
$2,071
State:
$2,265
(% of AGI for various income ranges: 4.3% for AGIs below $25k, 1.0% for AGIs $25k-50k)
Percentage of individuals using paid preparers for their 2012 taxes: 57.8%
Here:
58%
State:
53%
(% for various income ranges: 54.1% for AGIs below $25k, 59.5% for AGIs $25k-50k, 64.9% for AGIs $50k-75k, 57.7% for AGIs $75k-100k, 53.1% for AGIs $100k-200k, 71.4% for AGIs over 200k)
Averages for the 2004 tax year for zip code 47124, filed in 2005:
Average Adjusted Gross Income (AGI) in 2004: $55,658 (Individual Income Tax Returns)
Here:
$55,658
State:
$44,790
Salary/wage: $49,625 (reported on 88.8% of returns)
Here:
$49,625
State:
$39,615
(% of AGI for various income ranges: 133.2% for AGIs below $10k, 72.0% for AGIs $10k-25k, 80.2% for AGIs $25k-50k, 84.7% for AGIs $50k-75k, 88.5% for AGIs $75k-100k, 71.7% for AGIs over 100k)
Taxable interest for individuals: $921 (reported on 49.7% of returns)
This zip code:
$921
Indiana:
$1,535
(% of AGI for various income ranges: 8.6% for AGIs below $10k, 2.6% for AGIs $10k-25k, 0.9% for AGIs $25k-50k, 0.7% for AGIs $50k-75k, 0.5% for AGIs $75k-100k, 0.6% for AGIs over 100k)
Taxable dividends: $1,843 (reported on 27.3% of returns)
Here:
$1,843
State:
$2,998
(% of AGI for various income ranges: 4.0% for AGIs below $10k, 0.8% for AGIs $10k-25k, 0.6% for AGIs $25k-50k, 0.3% for AGIs $50k-75k, 0.5% for AGIs $75k-100k, 1.4% for AGIs over 100k)
Net capital gain/loss: +$9,007 (reported on 21.3% of returns)
Here:
+$9,007
State:
+$8,619
(% of AGI for various income ranges: 4.8% for AGIs below $10k, 1.3% for AGIs $10k-25k, 0.7% for AGIs $25k-50k, 1.3% for AGIs $50k-75k, 0.8% for AGIs $75k-100k, 7.0% for AGIs over 100k)
Profit/loss from business: +$6,801 (reported on 17.3% of returns)
Here:
+$6,801
State:
+$10,071
(% of AGI for various income ranges: 8.7% for AGIs below $10k, 3.9% for AGIs $10k-25k, 2.4% for AGIs $25k-50k, 2.1% for AGIs $50k-75k, 1.6% for AGIs $75k-100k, 1.8% for AGIs over 100k)
IRA payment deduction: $2,851 (reported on 2.5% of returns)
47124:
$2,851
Indiana:
$2,840
Total itemized deductions: $17,692 (20% of AGI, reported on 44.9% of returns)
Here:
$17,692
State:
$17,065
Here:
19.6% of AGI
State:
19.5% of AGI
(% of AGI for various income ranges: 10.1% for AGIs $10k-25k, 13.7% for AGIs $25k-50k, 16.2% for AGIs $50k-75k, 15.3% for AGIs $75k-100k, 14.0% for AGIs over 100k)
Charity contributions deductions: $3,167 (3% of AGI, reported on 39.9% of returns)
Here:
$3,167
State:
$3,550
Here:
3.3% of AGI
State:
3.8% of AGI
(% of AGI for various income ranges: 0.9% for AGIs $10k-25k, 1.5% for AGIs $25k-50k, 2.3% for AGIs $50k-75k, 2.6% for AGIs $75k-100k, 2.6% for AGIs over 100k)
Total tax: $7,898 (reported on 82.0% of returns)
47124:
$7,898
State:
$6,914
(% of AGI for various income ranges: 3.1% for AGIs below $10k, 4.8% for AGIs $10k-25k, 6.9% for AGIs $25k-50k, 8.0% for AGIs $50k-75k, 9.3% for AGIs $75k-100k, 17.4% for AGIs over 100k)
Earned income credit: $1,493 (reported on 7.8% of returns)
Here:
$1,493
State:
$1,685
Percentage of individuals using paid preparers for their 2004 taxes: 57.9%
Here:
58%
State:
59%
(% for various income ranges: 44.7% for AGIs below $10k, 56.8% for AGIs $10k-25k, 65.3% for AGIs $25k-50k, 64.2% for AGIs $50k-75k, 52.1% for AGIs $75k-100k, 60.2% for AGIs over 100k)
Household received Food Stamps/SNAP in the past 12 months: 20 Household did not receive Food Stamps/SNAP in the past 12 months: 1,820
Women who had a birth in the past 12 months: 23 (25 now married, 0 unmarried) Women who did not have a birth in the past 12 months: 936 (529 now married, 409 unmarried)
Housing units in zip code 47124 with a mortgage: 1,123 (123 second mortgage, 122 both second mortgage and home equity loan) Houses without a mortgage: 132
Median monthly owner costs for units with a mortgage: $1,565 Median monthly owner costs for units without a mortgage: $531
Residents with income below the poverty level in 2022:
This zip code:
1.7%
Whole state:
12.6%
Residents with income below 50% of the poverty level in 2022:
This zip code:
0.1%
Whole state:
6.3%
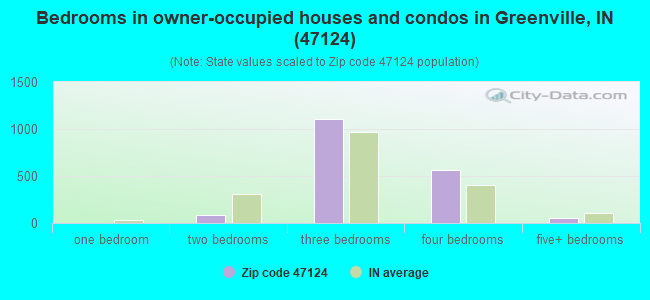
Median number of rooms in houses and condos:
Here:
7.0
State:
6.6
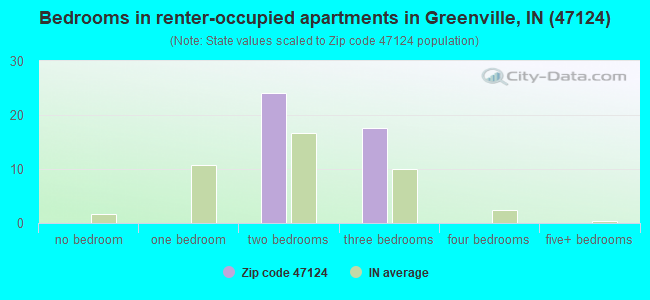
Median number of rooms in apartments:
Here:
5.6
State:
4.3
Notable locations in this zip code not listed on our city pages
In group quarters: 2 (-1 institutionalized population)
Size of family households: 691 2-persons, 281 3-persons, 386 4-persons, 174 5-persons, 3 6-persons, 11 7-or-more-persons
Size of nonfamily households: 226 1-person, 56 2-persons, 4 3-persons
1,127 married couples with children.
163 single-parent households (72 men, 91 women).
96.6% of residents of 47124 zip code speak English at home.
1.2% of residents speak Spanish at home (6% very well, 12% well, 82% not well).
1.7% of residents speak other Indo-European language at home (100% very well).
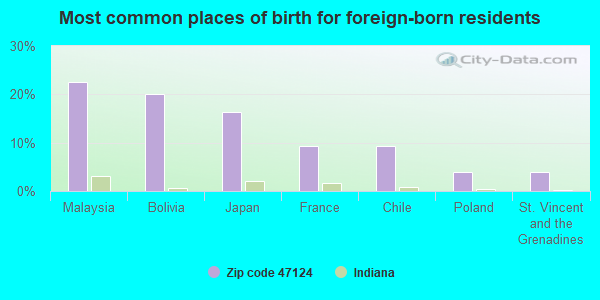
Foreign born population: 131 (2.4%) (71.4% of them are naturalized citizens)
This zip code:
2.4%
Whole state:
6.1%
22%Malaysia
20%Bolivia
16%Japan
9%France
9%Chile
4%Poland
4%St. Vincent and the Grenadines
27%American
23%German
15%English
6%Irish
6%European
2%Norwegian
1%Scottish
Year of entry for the foreign-born population
602010 or later
182000 to 2009
91990 to 1999
85Before 1990
Facilities with environmental interests located in this zip code:
GREENVILLE ELEMENTARY SCHOOL (7025 CROSS STREET in GREENVILLE, IN)
STATE MASTER (Indiana facility tracking) (National Center for Education Statistics) - STATE ID-1953 National Pollutant Discharge Elimination System NON-MAJOR (Tracking pollutant discharge elimination systems) - permit Business SIC classification: ELEMENTARY AND SECONDARY SCHOOLS Organizations: MR MIKE AMBURN 13790 (CONTACT/OPERATOR)
, NEW ALBANY-FLOYD CO CONS SCH (CONTACT/OWNER)
, NEW ALBANY FLOYD CO CONS SCH (CONTACT/OWNER)
, NEW ALBANY-FLOYD CO CON SCH (SCHOOL DISTRICT)
Housing units lacking complete plumbing facilities: 0.5%
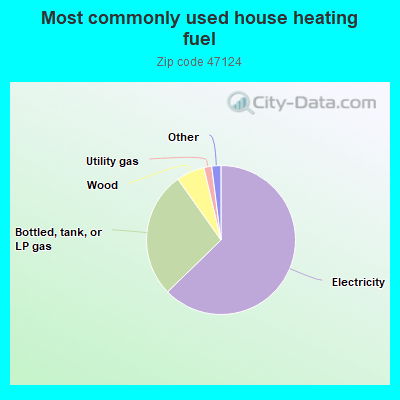
62.8%Electricity
27.5%Bottled, tank, or LP gas
6.1%Wood
1.7%Utility gas
0.8%Other fuel
0.8%Fuel oil, kerosene, etc.
Population in 1990: 1,162. Population change in the 1990s: +2,659 (+228.8%).
Place of birth for U.S.-born residents:
This state: 2,603
Northeast: 90
Midwest: 465
South: 1,852
West: 234
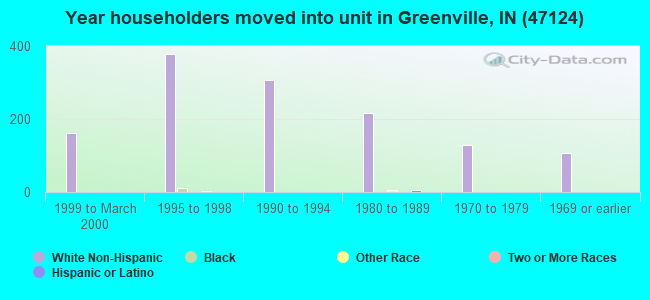
61% of the 47124 zip code residents lived in the same house 5 years ago. Out of people who lived in different houses, 43% lived in this county. Out of people who lived in different counties, 50% lived in Indiana.
95% of the 47124 zip code residents lived in the same house 1 year ago. Out of people who lived in different houses, 49% moved from this county. Out of people who lived in different houses, 38% moved from different county within same state. Out of people who lived in different houses, 14% moved from different state. Out of people who lived in different houses, 7% moved from abroad.
Private vs. public school enrollment:
Students in private schools in grades 1 to 8 (elementary and middle school): 96
Here:
12.6%
Indiana:
14.9%
Students in private schools in grades 9 to 12 (high school): 36
Here:
10.5%
Indiana:
11.4%
Students in private undergraduate colleges: 39
Here:
19.3%
Indiana:
22.3%
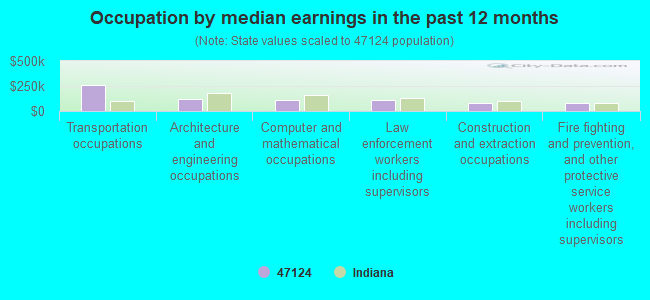
Occupation by median earnings in the past 12 months ($)
255,632Transportation occupations
121,642Architecture and engineering occupations
113,699Computer and mathematical occupations
109,140Law enforcement workers including supervisors
76,046Construction and extraction occupations
75,095Fire fighting and prevention, and other protective service workers including supervisors
Top industries in this zip code by the number of employees in 2005:
Other Services (except Public Administration): Commercial and Industrial Machinery and Equipment (except Automotive and Electronic) Repair and Maintenance (20-49: 1)
Other Services (except Public Administration): Religious Organizations (10-19: 1, 1-4: 1)
Professional, Scientific, and Technical Services: Research and Development in the Physical, Engineering, and Life Sciences (10-19: 1)
Finance and Insurance: Savings Institutions (10-19: 1)
Fatal accident statistics in 2014:
Fatal accident count: 1
Vehicles involved in fatal accidents: 2
Fatal accidents caused by drunken drivers: 0
Fatalities: 1
Persons involved in fatal accidents: 3
Pedestrians involved in fatal accidents: 0
Fatal accident statistics in 2012:
Fatal accident count: 1
Vehicles involved in fatal accidents: 1
Fatal accidents caused by drunken drivers: 0
Fatalities: 1
Persons involved in fatal accidents: 2
Pedestrians involved in fatal accidents: 0
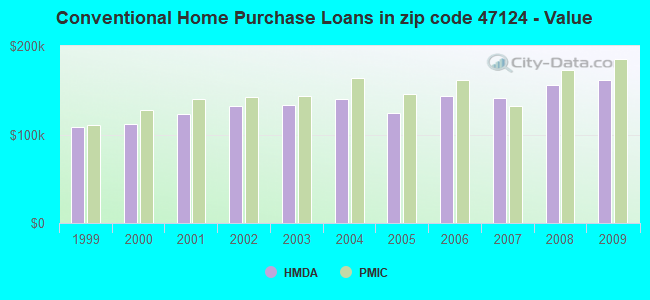
Home Mortgage Disclosure Act Aggregated Statistics For Year 2009 (Based on 4 partial tracts)
A) FHA, FSA/RHS & VA Home Purchase Loans
B) Conventional Home Purchase Loans
C) Refinancings
D) Home Improvement Loans
F) Non-occupant Loans on < 5 Family Dwellings (A B C & D)
G) Loans On Manufactured Home Dwelling (A B C & D)
Number
Average Value
Number
Average Value
Number
Average Value
Number
Average Value
Number
Average Value
Number
Average Value
LOANS ORIGINATED
31
$163,441
33
$161,506
239
$162,718
10
$76,955
11
$135,882
5
$78,816
APPLICATIONS APPROVED, NOT ACCEPTED
1
$129,010
4
$97,565
20
$189,938
1
$27,780
1
$40,140
0
$0
APPLICATIONS DENIED
2
$118,425
3
$90,417
64
$175,805
5
$67,634
1
$131,020
3
$75,920
APPLICATIONS WITHDRAWN
5
$152,008
4
$171,615
67
$181,402
1
$282,540
0
$0
0
$0
FILES CLOSED FOR INCOMPLETENESS
0
$0
0
$0
14
$207,361
0
$0
0
$0
0
$0
Aggregated Statistics For Year 2008 (Based on 4 partial tracts)
A) FHA, FSA/RHS & VA Home Purchase Loans
B) Conventional Home Purchase Loans
C) Refinancings
D) Home Improvement Loans
F) Non-occupant Loans on < 5 Family Dwellings (A B C & D)
G) Loans On Manufactured Home Dwelling (A B C & D)
Number
Average Value
Number
Average Value
Number
Average Value
Number
Average Value
Number
Average Value
Number
Average Value
LOANS ORIGINATED
27
$172,682
65
$156,491
134
$150,607
13
$46,858
12
$114,406
7
$77,939
APPLICATIONS APPROVED, NOT ACCEPTED
1
$223,800
7
$158,541
17
$161,490
1
$11,110
0
$0
0
$0
APPLICATIONS DENIED
7
$117,343
6
$93,398
61
$173,792
9
$61,937
5
$102,586
2
$96,580
APPLICATIONS WITHDRAWN
2
$197,515
8
$145,554
21
$155,343
3
$49,910
2
$45,390
0
$0
FILES CLOSED FOR INCOMPLETENESS
2
$106,020
3
$84,943
4
$110,275
0
$0
0
$0
0
$0
Aggregated Statistics For Year 2007 (Based on 4 partial tracts)
A) FHA, FSA/RHS & VA Home Purchase Loans
B) Conventional Home Purchase Loans
C) Refinancings
D) Home Improvement Loans
F) Non-occupant Loans on < 5 Family Dwellings (A B C & D)
G) Loans On Manufactured Home Dwelling (A B C & D)
Number
Average Value
Number
Average Value
Number
Average Value
Number
Average Value
Number
Average Value
Number
Average Value
LOANS ORIGINATED
14
$133,767
102
$141,701
141
$140,130
21
$63,310
9
$131,188
9
$66,991
APPLICATIONS APPROVED, NOT ACCEPTED
0
$0
13
$125,011
23
$156,613
1
$151,870
3
$136,933
1
$28,340
APPLICATIONS DENIED
5
$128,372
12
$114,102
88
$139,869
12
$69,685
5
$143,502
6
$96,455
APPLICATIONS WITHDRAWN
0
$0
7
$128,231
32
$154,371
1
$57,700
3
$135,487
1
$86,310
FILES CLOSED FOR INCOMPLETENESS
0
$0
2
$59,560
9
$171,737
1
$184,080
0
$0
0
$0
Aggregated Statistics For Year 2006 (Based on 4 partial tracts)
A) FHA, FSA/RHS & VA Home Purchase Loans
B) Conventional Home Purchase Loans
C) Refinancings
D) Home Improvement Loans
F) Non-occupant Loans on < 5 Family Dwellings (A B C & D)
G) Loans On Manufactured Home Dwelling (A B C & D)
Number
Average Value
Number
Average Value
Number
Average Value
Number
Average Value
Number
Average Value
Number
Average Value
LOANS ORIGINATED
14
$111,753
128
$144,006
150
$117,042
24
$44,575
19
$74,673
9
$71,462
APPLICATIONS APPROVED, NOT ACCEPTED
0
$0
14
$123,911
25
$131,773
4
$29,618
1
$59,210
1
$29,100
APPLICATIONS DENIED
4
$149,510
23
$134,067
77
$121,480
13
$61,087
1
$80,780
4
$104,788
APPLICATIONS WITHDRAWN
1
$131,320
11
$170,357
32
$138,619
5
$73,190
2
$79,650
2
$69,075
FILES CLOSED FOR INCOMPLETENESS
0
$0
7
$187,741
11
$173,332
3
$39,230
0
$0
0
$0
Aggregated Statistics For Year 2005 (Based on 4 partial tracts)
A) FHA, FSA/RHS & VA Home Purchase Loans
B) Conventional Home Purchase Loans
C) Refinancings
D) Home Improvement Loans
F) Non-occupant Loans on < 5 Family Dwellings (A B C & D)
G) Loans On Manufactured Home Dwelling (A B C & D)
Number
Average Value
Number
Average Value
Number
Average Value
Number
Average Value
Number
Average Value
Number
Average Value
LOANS ORIGINATED
14
$124,369
126
$123,966
168
$122,468
25
$54,564
16
$61,694
6
$48,140
APPLICATIONS APPROVED, NOT ACCEPTED
2
$116,040
19
$91,368
29
$119,224
6
$95,057
2
$79,495
2
$29,465
APPLICATIONS DENIED
1
$168,400
26
$100,897
63
$134,185
12
$65,903
1
$129,460
4
$66,875
APPLICATIONS WITHDRAWN
0
$0
12
$147,914
37
$140,053
3
$150,243
1
$151,980
3
$64,990
FILES CLOSED FOR INCOMPLETENESS
0
$0
7
$205,187
20
$178,075
0
$0
0
$0
0
$0
Aggregated Statistics For Year 2004 (Based on 4 partial tracts)
A) FHA, FSA/RHS & VA Home Purchase Loans
B) Conventional Home Purchase Loans
C) Refinancings
D) Home Improvement Loans
F) Non-occupant Loans on < 5 Family Dwellings (A B C & D)
G) Loans On Manufactured Home Dwelling (A B C & D)
Number
Average Value
Number
Average Value
Number
Average Value
Number
Average Value
Number
Average Value
Number
Average Value
LOANS ORIGINATED
13
$115,321
117
$139,646
188
$112,917
23
$58,150
15
$100,247
9
$66,272
APPLICATIONS APPROVED, NOT ACCEPTED
0
$0
17
$141,391
22
$93,805
4
$24,800
0
$0
1
$53,190
APPLICATIONS DENIED
2
$180,375
23
$76,183
68
$104,415
9
$58,740
6
$52,653
4
$49,208
APPLICATIONS WITHDRAWN
3
$86,390
14
$135,896
38
$112,406
2
$36,890
2
$46,585
2
$84,805
FILES CLOSED FOR INCOMPLETENESS
0
$0
6
$115,092
17
$130,973
1
$75,270
1
$142,580
0
$0
Aggregated Statistics For Year 2003 (Based on 4 partial tracts)
A) FHA, FSA/RHS & VA Home Purchase Loans
B) Conventional Home Purchase Loans
C) Refinancings
D) Home Improvement Loans
F) Non-occupant Loans on < 5 Family Dwellings (A B C & D)
Number
Average Value
Number
Average Value
Number
Average Value
Number
Average Value
Number
Average Value
LOANS ORIGINATED
8
$101,315
74
$133,546
506
$117,323
23
$31,495
11
$84,655
APPLICATIONS APPROVED, NOT ACCEPTED
0
$0
7
$85,593
50
$102,089
5
$44,150
0
$0
APPLICATIONS DENIED
1
$132,490
14
$91,484
99
$106,325
9
$37,351
1
$46,170
APPLICATIONS WITHDRAWN
1
$153,600
6
$81,293
62
$99,132
1
$15,810
4
$66,688
FILES CLOSED FOR INCOMPLETENESS
0
$0
5
$102,912
17
$128,952
2
$37,895
1
$90,150
Aggregated Statistics For Year 2002 (Based on 4 partial tracts)
A) FHA, FSA/RHS & VA Home Purchase Loans
B) Conventional Home Purchase Loans
C) Refinancings
D) Home Improvement Loans
F) Non-occupant Loans on < 5 Family Dwellings (A B C & D)
Number
Average Value
Number
Average Value
Number
Average Value
Number
Average Value
Number
Average Value
LOANS ORIGINATED
9
$124,071
96
$132,190
379
$114,030
28
$48,453
14
$66,891
APPLICATIONS APPROVED, NOT ACCEPTED
0
$0
10
$111,341
41
$106,428
4
$16,157
2
$67,245
APPLICATIONS DENIED
1
$81,630
12
$73,876
75
$99,419
6
$16,285
2
$70,205
APPLICATIONS WITHDRAWN
0
$0
11
$84,678
43
$95,101
2
$38,580
3
$66,520
FILES CLOSED FOR INCOMPLETENESS
0
$0
3
$121,300
19
$106,508
0
$0
0
$0
Aggregated Statistics For Year 2001 (Based on 4 partial tracts)
A) FHA, FSA/RHS & VA Home Purchase Loans
B) Conventional Home Purchase Loans
C) Refinancings
D) Home Improvement Loans
F) Non-occupant Loans on < 5 Family Dwellings (A B C & D)
Number
Average Value
Number
Average Value
Number
Average Value
Number
Average Value
Number
Average Value
LOANS ORIGINATED
17
$103,126
88
$123,656
354
$106,992
27
$23,981
22
$73,189
APPLICATIONS APPROVED, NOT ACCEPTED
0
$0
7
$102,563
36
$93,850
6
$18,448
2
$54,695
APPLICATIONS DENIED
1
$62,220
14
$111,816
74
$88,256
9
$28,210
9
$50,258
APPLICATIONS WITHDRAWN
1
$99,870
3
$109,273
43
$123,662
3
$65,827
0
$0
FILES CLOSED FOR INCOMPLETENESS
0
$0
2
$90,080
8
$118,642
0
$0
0
$0
Aggregated Statistics For Year 2000 (Based on 4 partial tracts)
A) FHA, FSA/RHS & VA Home Purchase Loans
B) Conventional Home Purchase Loans
C) Refinancings
D) Home Improvement Loans
F) Non-occupant Loans on < 5 Family Dwellings (A B C & D)
Number
Average Value
Number
Average Value
Number
Average Value
Number
Average Value
Number
Average Value
LOANS ORIGINATED
22
$93,978
102
$111,357
106
$74,015
39
$18,211
11
$73,092
APPLICATIONS APPROVED, NOT ACCEPTED
0
$0
9
$80,050
32
$66,645
8
$17,214
2
$55,030
APPLICATIONS DENIED
2
$81,795
22
$75,079
49
$69,858
16
$15,658
5
$62,226
APPLICATIONS WITHDRAWN
1
$137,170
4
$107,600
20
$70,848
1
$54,710
0
$0
FILES CLOSED FOR INCOMPLETENESS
0
$0
2
$83,600
2
$78,000
0
$0
0
$0
Aggregated Statistics For Year 1999 (Based on 2 partial tracts)
A) FHA, FSA/RHS & VA Home Purchase Loans
B) Conventional Home Purchase Loans
C) Refinancings
D) Home Improvement Loans
F) Non-occupant Loans on < 5 Family Dwellings (A B C & D)
Detailed PMIC statistics for the following Tracts:0710.04
, 0711.01
2002 - 2018 National Fire Incident Reporting System (NFIRS) incidents
According to the data from the years 2002 - 2018 the average number of fires per year is 23. The highest number of fire incidents - 42 took place in 2010, and the least - 7 in 2003. The data has a rising trend.
When looking into fire subcategories, the most reports belonged to: Structure Fires (49.7%), and Outside Fires (32.6%).
Fire incident types reported to NFIRS in Zip Code 47124


 Nearest zip codes: 47122, 47164, 47161, 47114, 47119, 47165.


 According to the data from the years 2002 - 2018 the average number of fires per year is 23. The highest number of fire incidents - 42 took place in 2010, and the least - 7 in 2003. The data has a rising trend.
 When looking into fire subcategories, the most reports belonged to: Structure Fires (49.7%), and Outside Fires (32.6%).