Estimated zip code population in 2022: 4,719 Zip code population in 2010: 4,178 Zip code population in 2000: 3,708
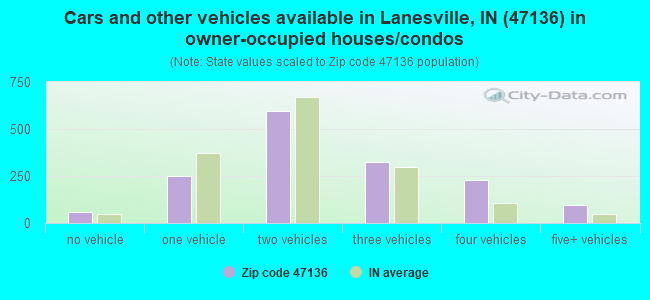
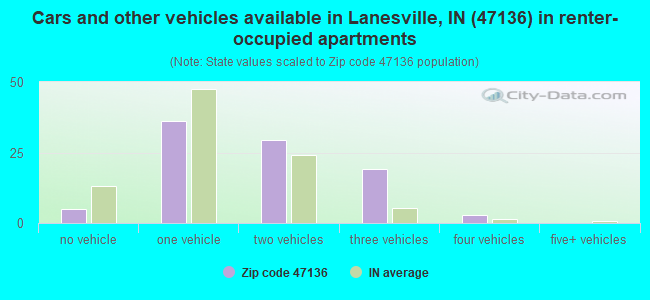
Houses and condos: 1,794 Renter-occupied apartments: 94
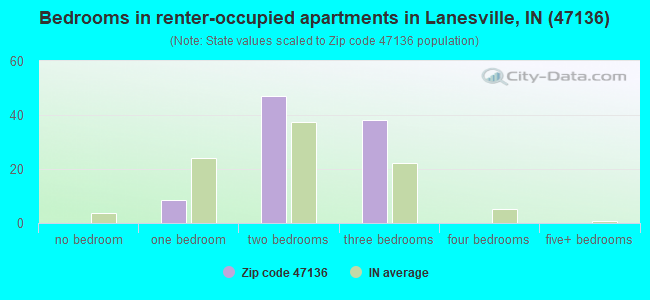
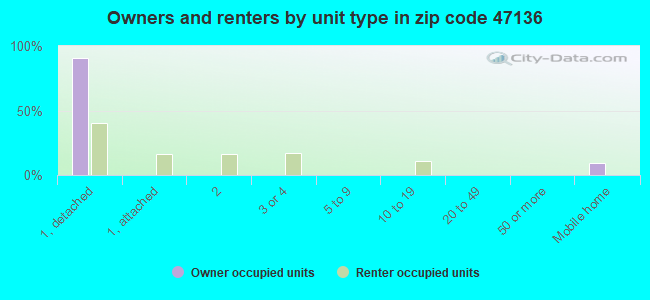
% of renters here:
6%
State:
29%
March 2022 cost of living index in zip code 47136: 86.4 (less than average, U.S. average is 100)
Land area: 27.7 sq. mi. Water area: 0.1 sq. mi.
Population density: 170 people per square mile
(very low).
OSM Map
General Map
Google Map
MSN Map
OSM Map
General Map
Google Map
MSN Map
OSM Map
General Map
Google Map
MSN Map
OSM Map
General Map
Google Map
MSN Map
Please wait while loading the map...
Real estate property taxes paid for housing units in 2022:
This zip code:
0.6% ($1,463)
Indiana:
0.7% ($1,467)
Median real estate property taxes paid for housing units with mortgages in 2022: $1,684 (0.6%) Median real estate property taxes paid for housing units with no mortgage in 2022: $1,252 (0.5%)
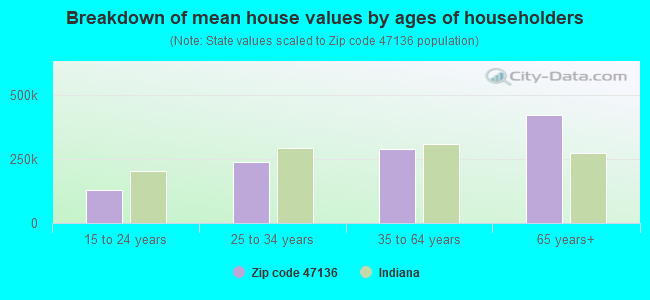
Estimated median house/condo value in 2022: $261,216
47136:
$261,216
Indiana:
$208,700
According to our research of Indiana and other state lists, there was 1 registered sex offender living in 47136 zip code as of May 28, 2024. The ratio of all residents to sex offenders in zip code 47136 is 4,616 to 1. The ratio of registered sex offenders to all residents in this zip code is much lower than the state average.
Median resident age:
This zip code:
36.5 years
Indiana median age:
38.2 years
Average household size:
This zip code:
2.9 people
Indiana:
2.4 people
Averages for the 2020 tax year for zip code 47136, filed in 2021:
Average Adjusted Gross Income (AGI) in 2020: $80,527 (Individual Income Tax Returns)
Here:
$80,527
State:
$64,978
Salary/wage: $72,026 (reported on 81.4% of returns)
Here:
$72,026
State:
$55,245
(% of AGI for various income ranges: 1038.2% for AGIs below $25k, 3551.5% for AGIs $25k-50k, 6026.7% for AGIs $50k-75k, 9378.4% for AGIs $75k-100k, 18463.0% for AGIs $100k-200k, 43283.3% for AGIs over 200k)
Taxable interest for individuals: $1,051 (reported on 34.6% of returns)
This zip code:
$1,051
Indiana:
$1,351
(% of AGI for various income ranges: 33.2% for AGIs below $25k, 38.5% for AGIs $25k-50k, 57.5% for AGIs $50k-75k, 52.6% for AGIs $75k-100k, 71.8% for AGIs $100k-200k, 170.0% for AGIs over 200k)
Ordinary dividends: $3,735 (reported on 24.7% of returns)
Here:
$3,735
State:
$5,827
(% of AGI for various income ranges: 30.8% for AGIs below $25k, 41.2% for AGIs $25k-50k, 160.0% for AGIs $50k-75k, 115.8% for AGIs $75k-100k, 208.2% for AGIs $100k-200k, 958.3% for AGIs over 200k)
Net capital gain/loss in AGI: +$10,219 (reported on 20.3% of returns)
Here:
+$10,219
State:
+$17,730
(% of AGI for various income ranges: 12.2% for AGIs below $25k, 41.5% for AGIs $25k-50k, 51.7% for AGIs $50k-75k, 195.8% for AGIs $75k-100k, 600.0% for AGIs $100k-200k, 3561.7% for AGIs over 200k)
Profit/loss from business: +$14,394 (reported on 14.7% of returns)
Here:
+$14,394
State:
+$12,144
(% of AGI for various income ranges: 88.8% for AGIs below $25k, 82.9% for AGIs $25k-50k, 219.6% for AGIs $50k-75k, 222.6% for AGIs $75k-100k, 363.0% for AGIs $100k-200k, 3515.0% for AGIs over 200k)
Taxable individual retirement arrangement distribution: $19,618 (reported on 14.3% of returns)
47136:
$19,618
Indiana:
$18,302
(% of AGI for various income ranges: 137.0% for AGIs below $25k, 181.5% for AGIs $25k-50k, 328.8% for AGIs $50k-75k, 644.7% for AGIs $75k-100k, 998.5% for AGIs $100k-200k)
Total itemized deductions: $31,118 (reported on 7.4% of returns)
Here:
$31,118
State:
$35,601
(% of AGI for various income ranges: 140.5% for AGIs below $25k, 344.2% for AGIs $50k-75k, 683.9% for AGIs $100k-200k, 2741.7% for AGIs over 200k)
Charity contributions: $12,557 (reported on 6.1% of returns)
Here:
$12,557
State:
$15,596
(% of AGI for various income ranges: 115.0% for AGIs $50k-75k, 256.4% for AGIs $100k-200k, 1060.0% for AGIs over 200k)
Taxes paid: $7,853 (reported on 7.4% of returns)
47136:
$7,853
State:
$7,542
(% of AGI for various income ranges: 17.0% for AGIs below $25k, 90.0% for AGIs $50k-75k, 180.3% for AGIs $100k-200k, 760.0% for AGIs over 200k)
Earned income credit: $1,865 (reported on 8.7% of returns)
Here:
$1,865
State:
$2,298
(% of AGI for various income ranges: 50.0% for AGIs below $25k, 50.9% for AGIs $25k-50k)
Percentage of individuals using paid preparers for their 2020 taxes: 94.8%
Here:
95%
State:
94%
(% for various income ranges: 93.2% for AGIs below $25k, 95.3% for AGIs $25k-50k, 93.9% for AGIs $50k-75k, 96.4% for AGIs $75k-100k, 94.5% for AGIs $100k-200k, 100.0% for AGIs over 200k)
Averages for the 2012 tax year for zip code 47136, filed in 2013:
Average Adjusted Gross Income (AGI) in 2012: $58,088 (Individual Income Tax Returns)
Here:
$58,088
State:
$52,932
Salary/wage: $53,401 (reported on 83.3% of returns)
Here:
$53,401
State:
$45,173
(% of AGI for various income ranges: 65.8% for AGIs below $25k, 74.9% for AGIs $25k-50k, 78.6% for AGIs $50k-75k, 80.3% for AGIs $75k-100k, 84.9% for AGIs $100k-200k, 50.2% for AGIs over 200k)
Taxable interest for individuals: $1,159 (reported on 40.3% of returns)
This zip code:
$1,159
Indiana:
$1,311
(% of AGI for various income ranges: 2.1% for AGIs below $25k, 1.3% for AGIs $25k-50k, 0.8% for AGIs $50k-75k, 0.9% for AGIs $75k-100k, 0.3% for AGIs $100k-200k, 0.8% for AGIs over 200k)
Ordinary dividends: $2,222 (reported on 25.5% of returns)
Here:
$2,222
State:
$4,690
(% of AGI for various income ranges: 1.6% for AGIs below $25k, 1.1% for AGIs $25k-50k, 1.2% for AGIs $50k-75k, 1.0% for AGIs $75k-100k, 0.7% for AGIs $100k-200k, 0.6% for AGIs over 200k)
Net capital gain/loss in AGI: +$1,670 (reported on 17.1% of returns)
Here:
+$1,670
State:
+$10,406
(% of AGI for various income ranges: 0.4% for AGIs below $25k, 0.1% for AGIs $25k-50k, 0.2% for AGIs $75k-100k, 0.7% for AGIs $100k-200k, 1.9% for AGIs over 200k)
Profit/loss from business: +$8,917 (reported on 16.2% of returns)
Here:
+$8,917
State:
+$11,105
(% of AGI for various income ranges: 5.0% for AGIs below $25k, 3.3% for AGIs $25k-50k, 2.4% for AGIs $50k-75k, 1.6% for AGIs $75k-100k, 3.0% for AGIs $100k-200k)
Taxable individual retirement arrangement distribution: $11,740 (reported on 13.9% of returns)
47136:
$11,740
Indiana:
$13,841
(% of AGI for various income ranges: 6.4% for AGIs below $25k, 3.7% for AGIs $25k-50k, 3.5% for AGIs $50k-75k, 2.5% for AGIs $75k-100k, 2.4% for AGIs $100k-200k)
Total itemized deductions: $19,257 (20% of AGI, reported on 38.4% of returns)
Here:
$19,257
State:
$20,913
Here:
20.0% of AGI
State:
18.2% of AGI
(% of AGI for various income ranges: 9.0% for AGIs below $25k, 11.1% for AGIs $25k-50k, 11.3% for AGIs $50k-75k, 12.9% for AGIs $75k-100k, 14.7% for AGIs $100k-200k, 12.9% for AGIs over 200k)
Charity contributions: $3,503 (reported on 32.9% of returns)
Here:
$3,503
State:
$4,697
(% of AGI for various income ranges: 0.9% for AGIs below $25k, 1.5% for AGIs $25k-50k, 1.8% for AGIs $50k-75k, 1.6% for AGIs $75k-100k, 2.6% for AGIs $100k-200k, 2.4% for AGIs over 200k)
Taxes paid: $6,529 (reported on 38.0% of returns)
47136:
$6,529
State:
$7,456
(% of AGI for various income ranges: 1.2% for AGIs below $25k, 2.4% for AGIs $25k-50k, 3.2% for AGIs $50k-75k, 4.5% for AGIs $75k-100k, 5.8% for AGIs $100k-200k, 5.1% for AGIs over 200k)
Earned income credit: $1,910 (reported on 9.7% of returns)
Here:
$1,910
State:
$2,265
(% of AGI for various income ranges: 3.0% for AGIs below $25k, 0.9% for AGIs $25k-50k)
Percentage of individuals using paid preparers for their 2012 taxes: 59.3%
Here:
59%
State:
53%
(% for various income ranges: 58.3% for AGIs below $25k, 56.5% for AGIs $25k-50k, 57.1% for AGIs $50k-75k, 63.0% for AGIs $75k-100k, 59.4% for AGIs $100k-200k, 100.0% for AGIs over 200k)
Averages for the 2004 tax year for zip code 47136, filed in 2005:
Average Adjusted Gross Income (AGI) in 2004: $49,067 (Individual Income Tax Returns)
Here:
$49,067
State:
$44,790
Salary/wage: $45,799 (reported on 86.2% of returns)
Here:
$45,799
State:
$39,615
(% of AGI for various income ranges: 129.0% for AGIs below $10k, 75.5% for AGIs $10k-25k, 79.2% for AGIs $25k-50k, 86.0% for AGIs $50k-75k, 86.8% for AGIs $75k-100k, 71.2% for AGIs over 100k)
Taxable interest for individuals: $1,755 (reported on 54.5% of returns)
This zip code:
$1,755
Indiana:
$1,535
(% of AGI for various income ranges: 10.4% for AGIs below $10k, 5.1% for AGIs $10k-25k, 2.4% for AGIs $25k-50k, 1.4% for AGIs $50k-75k, 1.3% for AGIs $75k-100k, 1.5% for AGIs over 100k)
Taxable dividends: $1,302 (reported on 29.8% of returns)
Here:
$1,302
State:
$2,998
(% of AGI for various income ranges: 3.8% for AGIs below $10k, 0.9% for AGIs $10k-25k, 0.8% for AGIs $25k-50k, 0.5% for AGIs $50k-75k, 0.5% for AGIs $75k-100k, 1.1% for AGIs over 100k)
Net capital gain/loss: +$5,908 (reported on 21.0% of returns)
Here:
+$5,908
State:
+$8,619
(% of AGI for various income ranges: -1.3% for AGIs below $10k, 1.0% for AGIs $10k-25k, 1.7% for AGIs $25k-50k, 0.7% for AGIs $50k-75k, 1.3% for AGIs $75k-100k, 5.8% for AGIs over 100k)
Profit/loss from business: +$8,462 (reported on 16.9% of returns)
Here:
+$8,462
State:
+$10,071
(% of AGI for various income ranges: 5.3% for AGIs below $10k, 2.6% for AGIs $10k-25k, 2.6% for AGIs $25k-50k, 1.7% for AGIs $50k-75k, 1.4% for AGIs $75k-100k, 5.0% for AGIs over 100k)
IRA payment deduction: $2,803 (reported on 3.5% of returns)
47136:
$2,803
Indiana:
$2,840
(% of AGI for various income ranges: 1.5% for AGIs below $10k, 0.4% for AGIs $25k-50k, 0.2% for AGIs $50k-75k, 0.3% for AGIs $75k-100k)
Total itemized deductions: $16,428 (20% of AGI, reported on 39.3% of returns)
Here:
$16,428
State:
$17,065
Here:
20.5% of AGI
State:
19.5% of AGI
(% of AGI for various income ranges: 8.1% for AGIs below $10k, 11.4% for AGIs $10k-25k, 10.9% for AGIs $25k-50k, 13.1% for AGIs $50k-75k, 13.9% for AGIs $75k-100k, 14.6% for AGIs over 100k)
Charity contributions deductions: $3,015 (4% of AGI, reported on 35.7% of returns)
Here:
$3,015
State:
$3,550
Here:
3.6% of AGI
State:
3.8% of AGI
(% of AGI for various income ranges: 1.2% for AGIs $10k-25k, 1.6% for AGIs $25k-50k, 1.9% for AGIs $50k-75k, 1.7% for AGIs $75k-100k, 3.4% for AGIs over 100k)
Total tax: $6,373 (reported on 80.4% of returns)
47136:
$6,373
State:
$6,914
(% of AGI for various income ranges: 2.9% for AGIs below $10k, 4.3% for AGIs $10k-25k, 6.8% for AGIs $25k-50k, 8.3% for AGIs $50k-75k, 10.0% for AGIs $75k-100k, 16.2% for AGIs over 100k)
Earned income credit: $1,556 (reported on 8.1% of returns)
Here:
$1,556
State:
$1,685
Percentage of individuals using paid preparers for their 2004 taxes: 59.7%
Here:
60%
State:
59%
(% for various income ranges: 49.9% for AGIs below $10k, 57.7% for AGIs $10k-25k, 62.5% for AGIs $25k-50k, 64.5% for AGIs $50k-75k, 61.8% for AGIs $75k-100k, 63.8% for AGIs over 100k)
Likely homosexual households (counted as self-reported same-sex unmarried-partner households)
Lesbian couples: 1.9% of all households
Gay men: 0.0% of all households
Household received Food Stamps/SNAP in the past 12 months: 96 Household did not receive Food Stamps/SNAP in the past 12 months: 1,537
Women who had a birth in the past 12 months: 22 (0 now married, 18 unmarried) Women who did not have a birth in the past 12 months: 955 (566 now married, 392 unmarried)
Housing units in zip code 47136 with a mortgage: 994 (83 second mortgage, 79 both second mortgage and home equity loan) Houses without a mortgage: 51
Median monthly owner costs for units with a mortgage: $1,446 Median monthly owner costs for units without a mortgage: $432
Residents with income below the poverty level in 2022:
This zip code:
2.2%
Whole state:
12.6%
Residents with income below 50% of the poverty level in 2022:
This zip code:
1.0%
Whole state:
6.3%
Median number of rooms in houses and condos:
Here:
6.6
State:
6.6
Median number of rooms in apartments:
Here:
4.3
State:
4.3
Notable locations in this zip code not listed on our city pages
Size of family households: 474 2-persons, 162 3-persons, 300 4-persons, 138 5-persons, 66 6-persons, 36 7-or-more-persons
Size of nonfamily households: 399 1-person, 53 2-persons
1,045 married couples with children.
106 single-parent households (58 men, 48 women).
93.1% of residents of 47136 zip code speak English at home.
2.6% of residents speak Spanish at home (78% very well, 11% well, 11% not well).
0.1% of residents speak other Indo-European language at home (100% very well).
2.8% of residents speak Asian or Pacific Island language at home (78% very well, 12% well, 10% not well).
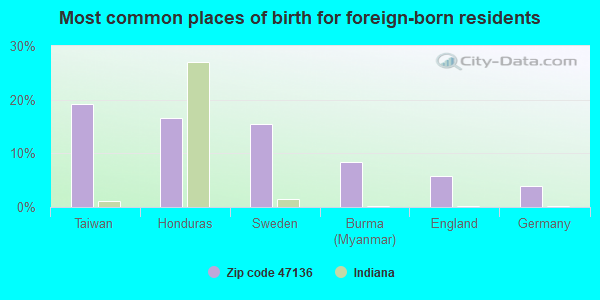
Foreign born population: 157 (3.3%) (52.3% of them are naturalized citizens)
This zip code:
3.3%
Whole state:
6.1%
19%Taiwan
17%Honduras
15%Sweden
8%Burma (Myanmar)
6%England
4%Germany
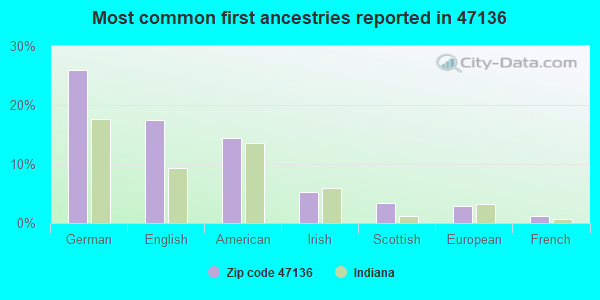
26%German
17%English
14%American
5%Irish
3%Scottish
3%European
1%French
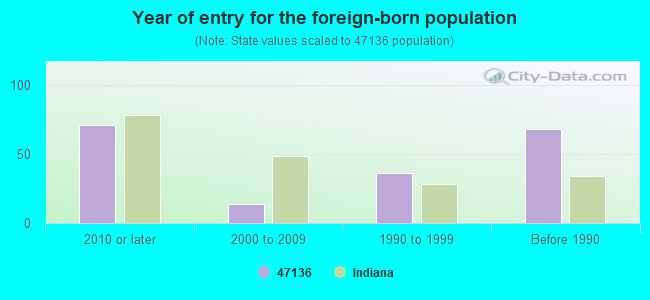
Year of entry for the foreign-born population
712010 or later
142000 to 2009
361990 to 1999
68Before 1990
Facilities with environmental interests located in this zip code:
AT&T CORP (7 MI S OF HWY 62 ON HWY 11 in LANESVILLE, IN)
STATE MASTER (Indiana facility tracking) - CRTK-8068, EPCRA, LUST-199706525, LEAKING STORAGE TANK, UST-781, UNDERGROUND STORAGE TANK PROGRAM Conditionally Exempt Small Quantity Generators, less than 100 kg/month of hazardous waste (Resource Conservation and Recovery Act (tracking hazardous waste)) - notification Organizations: AT & T CORP. (CONTACT/OWNER)
Housing units lacking complete plumbing facilities: 2.8% Housing units lacking complete kitchen facilities: 3.1%
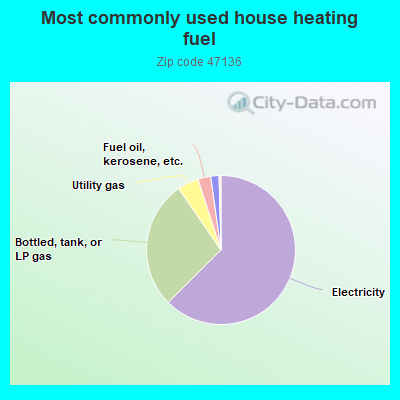
62.7%Electricity
27.9%Bottled, tank, or LP gas
4.6%Utility gas
2.8%Fuel oil, kerosene, etc.
1.8%Wood
Population in 1990: 3,524. Population change in the 1990s: +184 (+5.2%).
Place of birth for U.S.-born residents:
This state: 2,686
Northeast: 67
Midwest: 315
South: 1,323
West: 90
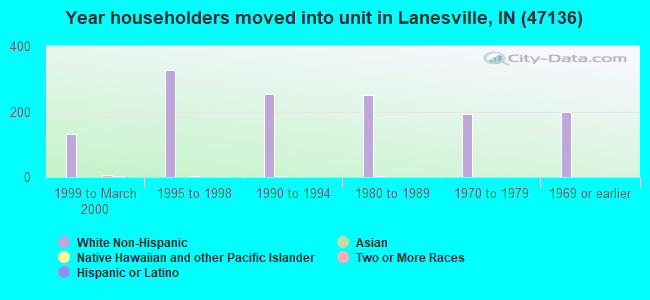
66% of the 47136 zip code residents lived in the same house 5 years ago. Out of people who lived in different houses, 48% lived in this county. Out of people who lived in different counties, 50% lived in Indiana.
90% of the 47136 zip code residents lived in the same house 1 year ago. Out of people who lived in different houses, 51% moved from this county. Out of people who lived in different houses, 31% moved from different county within same state. Out of people who lived in different houses, 16% moved from different state. Out of people who lived in different houses, 2% moved from abroad.
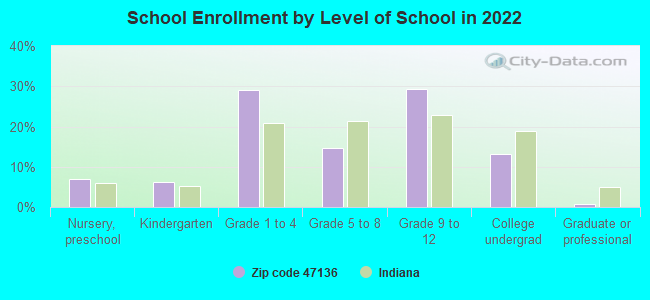
Private vs. public school enrollment:
Students in private schools in grades 1 to 8 (elementary and middle school): 93
Here:
16.1%
Indiana:
14.9%
Students in private schools in grades 9 to 12 (high school):
Here:
0.0%
Indiana:
11.4%
Students in private undergraduate colleges: 14
Here:
8.2%
Indiana:
22.3%
Occupation by median earnings in the past 12 months ($)
95,950Health diagnosing and treating practitioners and other technical occupations
86,321Computer and mathematical occupations
85,116Community and social service occupations
78,857Architecture and engineering occupations
78,460Management occupations
76,283Business and financial operations occupations
Top industries in this zip code by the number of employees in 2005:
Accommodation and Food Services: Limited-Service Restaurants (100-249 employees: 1 establishment)
Other Services (except Public Administration): Religious Organizations (10-19: 1, 5-9: 1)
Construction: Highway, Street, and Bridge Construction (10-19: 1)
Finance and Insurance: Commercial Banking (10-19: 1)
Administrative and Support and Waste Management and Remediation Services: Landscaping Services (5-9: 1, 1-4: 3)
Construction: Site Preparation Contractors (5-9: 1, 1-4: 2)
Construction: New Single-Family Housing Construction (except Operative Builders) (5-9: 1, 1-4: 1)
Construction: Plumbing, Heating, and Air-Conditioning Contractors (1-4: 4)
Fatal accident statistics in 2014:
Fatal accident count: 2
Vehicles involved in fatal accidents: 2
Fatal accidents caused by drunken drivers: 1
Fatalities: 2
Persons involved in fatal accidents: 2
Pedestrians involved in fatal accidents: 1
Fatal accident statistics in 2013:
Fatal accident count: 1
Vehicles involved in fatal accidents: 1
Fatal accidents caused by drunken drivers: 0
Fatalities: 1
Persons involved in fatal accidents: 1
Pedestrians involved in fatal accidents: 0
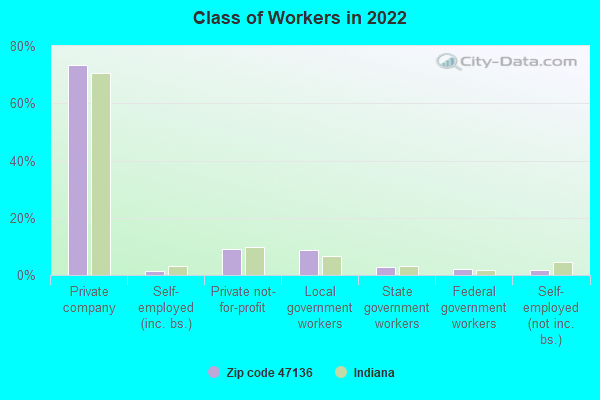
Home Mortgage Disclosure Act Aggregated Statistics For Year 2009 (Based on 6 partial tracts)
A) FHA, FSA/RHS & VA Home Purchase Loans
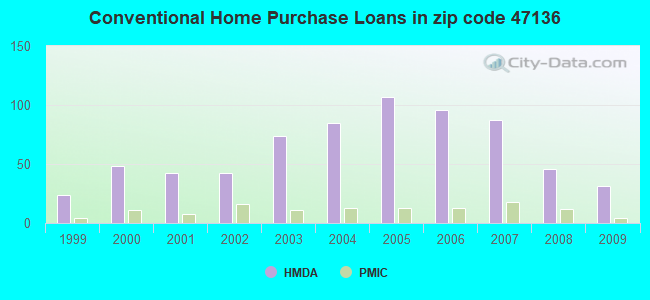
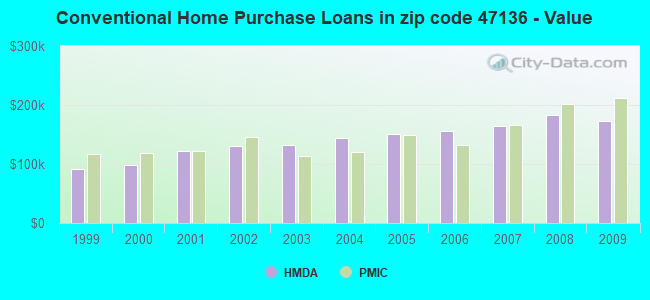
B) Conventional Home Purchase Loans
C) Refinancings
D) Home Improvement Loans
F) Non-occupant Loans on < 5 Family Dwellings (A B C & D)
G) Loans On Manufactured Home Dwelling (A B C & D)
Number
Average Value
Number
Average Value
Number
Average Value
Number
Average Value
Number
Average Value
Number
Average Value
LOANS ORIGINATED
26
$141,509
31
$173,092
200
$162,436
5
$60,892
7
$105,307
12
$76,730
APPLICATIONS APPROVED, NOT ACCEPTED
1
$280,540
1
$153,090
22
$165,839
0
$0
0
$0
0
$0
APPLICATIONS DENIED
6
$149,355
5
$119,840
58
$164,520
4
$44,620
1
$68,450
6
$97,798
APPLICATIONS WITHDRAWN
2
$179,115
4
$145,258
38
$170,009
0
$0
1
$157,380
2
$94,435
FILES CLOSED FOR INCOMPLETENESS
0
$0
0
$0
9
$121,049
0
$0
0
$0
0
$0
Aggregated Statistics For Year 2008 (Based on 6 partial tracts)
A) FHA, FSA/RHS & VA Home Purchase Loans
B) Conventional Home Purchase Loans
C) Refinancings
D) Home Improvement Loans
F) Non-occupant Loans on < 5 Family Dwellings (A B C & D)
G) Loans On Manufactured Home Dwelling (A B C & D)
Number
Average Value
Number
Average Value
Number
Average Value
Number
Average Value
Number
Average Value
Number
Average Value
LOANS ORIGINATED
21
$136,130
46
$182,505
113
$169,650
10
$60,426
7
$115,790
12
$68,062
APPLICATIONS APPROVED, NOT ACCEPTED
1
$190,210
5
$95,986
11
$198,525
2
$42,140
0
$0
1
$96,910
APPLICATIONS DENIED
8
$101,834
6
$100,790
50
$148,401
8
$105,306
3
$91,963
5
$70,812
APPLICATIONS WITHDRAWN
1
$160,860
5
$205,622
29
$159,190
1
$29,830
0
$0
2
$114,490
FILES CLOSED FOR INCOMPLETENESS
0
$0
0
$0
5
$149,624
0
$0
0
$0
0
$0
Aggregated Statistics For Year 2007 (Based on 6 partial tracts)
A) FHA, FSA/RHS & VA Home Purchase Loans
B) Conventional Home Purchase Loans
C) Refinancings
D) Home Improvement Loans
F) Non-occupant Loans on < 5 Family Dwellings (A B C & D)
G) Loans On Manufactured Home Dwelling (A B C & D)
Number
Average Value
Number
Average Value
Number
Average Value
Number
Average Value
Number
Average Value
Number
Average Value
LOANS ORIGINATED
13
$131,992
87
$163,732
115
$141,690
18
$60,421
12
$107,155
10
$84,519
APPLICATIONS APPROVED, NOT ACCEPTED
0
$0
13
$160,732
25
$146,958
1
$191,800
1
$124,330
0
$0
APPLICATIONS DENIED
2
$113,690
17
$145,714
65
$167,033
14
$62,559
4
$172,162
7
$68,533
APPLICATIONS WITHDRAWN
1
$97,180
6
$275,393
17
$194,803
2
$98,845
0
$0
0
$0
FILES CLOSED FOR INCOMPLETENESS
0
$0
1
$91,680
5
$175,956
1
$44,290
0
$0
0
$0
Aggregated Statistics For Year 2006 (Based on 6 partial tracts)
A) FHA, FSA/RHS & VA Home Purchase Loans
B) Conventional Home Purchase Loans
C) Refinancings
D) Home Improvement Loans
F) Non-occupant Loans on < 5 Family Dwellings (A B C & D)
G) Loans On Manufactured Home Dwelling (A B C & D)
Number
Average Value
Number
Average Value
Number
Average Value
Number
Average Value
Number
Average Value
Number
Average Value
LOANS ORIGINATED
12
$125,250
96
$156,617
131
$125,182
29
$31,453
14
$98,300
19
$71,952
APPLICATIONS APPROVED, NOT ACCEPTED
2
$108,480
9
$120,278
24
$148,852
4
$37,730
0
$0
2
$69,555
APPLICATIONS DENIED
1
$117,900
25
$128,098
70
$124,835
11
$40,375
3
$73,877
7
$86,536
APPLICATIONS WITHDRAWN
3
$122,337
8
$157,500
33
$144,323
1
$64,180
1
$70,030
2
$69,850
FILES CLOSED FOR INCOMPLETENESS
0
$0
6
$163,002
16
$152,378
0
$0
1
$59,620
0
$0
Aggregated Statistics For Year 2005 (Based on 6 partial tracts)
A) FHA, FSA/RHS & VA Home Purchase Loans
B) Conventional Home Purchase Loans
C) Refinancings
D) Home Improvement Loans
F) Non-occupant Loans on < 5 Family Dwellings (A B C & D)
G) Loans On Manufactured Home Dwelling (A B C & D)
Number
Average Value
Number
Average Value
Number
Average Value
Number
Average Value
Number
Average Value
Number
Average Value
LOANS ORIGINATED
8
$146,529
107
$150,811
157
$128,301
25
$62,662
8
$109,284
12
$73,641
APPLICATIONS APPROVED, NOT ACCEPTED
0
$0
15
$128,999
13
$128,326
3
$34,280
1
$47,690
4
$55,340
APPLICATIONS DENIED
2
$143,990
19
$106,754
89
$118,041
14
$51,886
2
$85,715
9
$86,639
APPLICATIONS WITHDRAWN
0
$0
8
$110,305
36
$130,882
7
$172,521
1
$45,440
5
$87,082
FILES CLOSED FOR INCOMPLETENESS
0
$0
5
$139,236
21
$165,970
1
$67,570
0
$0
1
$64,180
Aggregated Statistics For Year 2004 (Based on 6 partial tracts)
A) FHA, FSA/RHS & VA Home Purchase Loans
B) Conventional Home Purchase Loans
C) Refinancings
D) Home Improvement Loans
F) Non-occupant Loans on < 5 Family Dwellings (A B C & D)
G) Loans On Manufactured Home Dwelling (A B C & D)
Number
Average Value
Number
Average Value
Number
Average Value
Number
Average Value
Number
Average Value
Number
Average Value
LOANS ORIGINATED
15
$123,775
85
$143,324
163
$122,856
13
$40,339
14
$103,444
18
$81,505
APPLICATIONS APPROVED, NOT ACCEPTED
0
$0
10
$137,658
34
$124,364
3
$63,610
1
$51,510
3
$79,923
APPLICATIONS DENIED
2
$94,610
17
$104,392
87
$116,119
10
$40,680
1
$122,180
13
$75,480
APPLICATIONS WITHDRAWN
2
$71,405
9
$216,800
47
$126,720
2
$113,770
2
$178,475
2
$84,960
FILES CLOSED FOR INCOMPLETENESS
0
$0
2
$142,895
15
$132,946
2
$44,375
0
$0
0
$0
Aggregated Statistics For Year 2003 (Based on 6 partial tracts)
A) FHA, FSA/RHS & VA Home Purchase Loans
B) Conventional Home Purchase Loans
C) Refinancings
D) Home Improvement Loans
E) Loans on Dwellings For 5+ Families
F) Non-occupant Loans on < 5 Family Dwellings (A B C & D)
Number
Average Value
Number
Average Value
Number
Average Value
Number
Average Value
Number
Average Value
Number
Average Value
LOANS ORIGINATED
15
$120,999
74
$131,422
391
$116,684
23
$41,150
1
$749,420
10
$78,129
APPLICATIONS APPROVED, NOT ACCEPTED
1
$49,930
8
$130,012
42
$110,964
1
$81,610
0
$0
0
$0
APPLICATIONS DENIED
1
$65,970
9
$84,362
104
$110,673
10
$62,839
0
$0
4
$63,030
APPLICATIONS WITHDRAWN
1
$78,390
8
$135,302
50
$124,941
1
$35,010
0
$0
0
$0
FILES CLOSED FOR INCOMPLETENESS
0
$0
1
$122,640
17
$125,480
0
$0
0
$0
0
$0
Aggregated Statistics For Year 2002 (Based on 4 partial tracts)
A) FHA, FSA/RHS & VA Home Purchase Loans
B) Conventional Home Purchase Loans
C) Refinancings
D) Home Improvement Loans
F) Non-occupant Loans on < 5 Family Dwellings (A B C & D)
Number
Average Value
Number
Average Value
Number
Average Value
Number
Average Value
Number
Average Value
LOANS ORIGINATED
7
$120,991
42
$130,101
201
$118,474
10
$33,033
10
$74,020
APPLICATIONS APPROVED, NOT ACCEPTED
0
$0
2
$98,170
31
$113,744
2
$102,180
0
$0
APPLICATIONS DENIED
0
$0
4
$72,760
40
$95,261
5
$28,028
2
$27,525
APPLICATIONS WITHDRAWN
1
$47,690
1
$169,580
26
$103,855
0
$0
0
$0
FILES CLOSED FOR INCOMPLETENESS
0
$0
2
$54,930
11
$123,380
0
$0
0
$0
Aggregated Statistics For Year 2001 (Based on 4 partial tracts)
A) FHA, FSA/RHS & VA Home Purchase Loans
B) Conventional Home Purchase Loans
C) Refinancings
D) Home Improvement Loans
F) Non-occupant Loans on < 5 Family Dwellings (A B C & D)
Number
Average Value
Number
Average Value
Number
Average Value
Number
Average Value
Number
Average Value
LOANS ORIGINATED
4
$114,845
42
$121,682
143
$105,724
13
$22,037
9
$88,002
APPLICATIONS APPROVED, NOT ACCEPTED
0
$0
4
$86,878
19
$85,615
3
$15,580
1
$37,280
APPLICATIONS DENIED
0
$0
9
$44,926
35
$92,027
3
$25,780
0
$0
APPLICATIONS WITHDRAWN
1
$11,920
3
$138,087
18
$127,650
1
$38,950
0
$0
FILES CLOSED FOR INCOMPLETENESS
0
$0
3
$75,340
5
$143,838
0
$0
0
$0
Aggregated Statistics For Year 2000 (Based on 4 partial tracts)
A) FHA, FSA/RHS & VA Home Purchase Loans
B) Conventional Home Purchase Loans
C) Refinancings
D) Home Improvement Loans
F) Non-occupant Loans on < 5 Family Dwellings (A B C & D)
Number
Average Value
Number
Average Value
Number
Average Value
Number
Average Value
Number
Average Value
LOANS ORIGINATED
5
$106,920
48
$97,588
59
$76,451
16
$22,594
6
$34,408
APPLICATIONS APPROVED, NOT ACCEPTED
0
$0
6
$58,892
18
$59,281
5
$29,942
3
$53,983
APPLICATIONS DENIED
0
$0
14
$53,021
29
$68,807
6
$15,385
3
$51,420
APPLICATIONS WITHDRAWN
0
$0
4
$91,055
15
$75,944
0
$0
0
$0
FILES CLOSED FOR INCOMPLETENESS
1
$47,690
0
$0
3
$66,443
0
$0
0
$0
Aggregated Statistics For Year 1999 (Based on 2 partial tracts)
A) FHA, FSA/RHS & VA Home Purchase Loans
B) Conventional Home Purchase Loans
C) Refinancings
D) Home Improvement Loans
F) Non-occupant Loans on < 5 Family Dwellings (A B C & D)
2002 - 2018 National Fire Incident Reporting System (NFIRS) incidents
According to the data from the years 2002 - 2018 the average number of fires per year is 14. The highest number of fire incidents - 36 took place in 2010, and the least - 0 in 2003. The data has a declining trend.
When looking into fire subcategories, the most reports belonged to: Outside Fires (44.2%), and Structure Fires (33.9%).
Fire incident types reported to NFIRS in Zip Code 47136

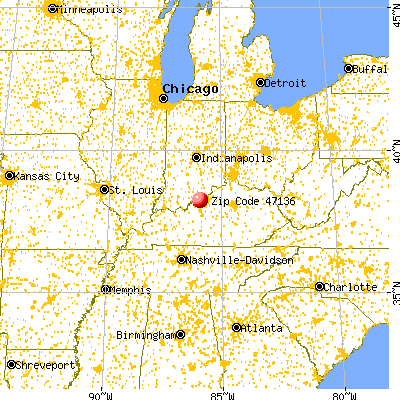


 Nearest zip codes: 47122, 47160, 40258, 47114, 47117, 47150.


 According to the data from the years 2002 - 2018 the average number of fires per year is 14. The highest number of fire incidents - 36 took place in 2010, and the least - 0 in 2003. The data has a declining trend.
 When looking into fire subcategories, the most reports belonged to: Outside Fires (44.2%), and Structure Fires (33.9%).