Estimated zip code population in 2022: 6,067 Zip code population in 2010: 5,951 Zip code population in 2000: 6,002
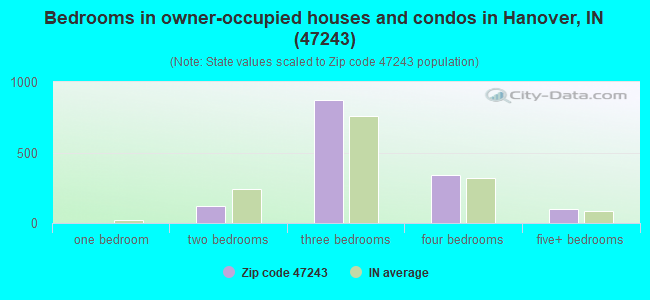
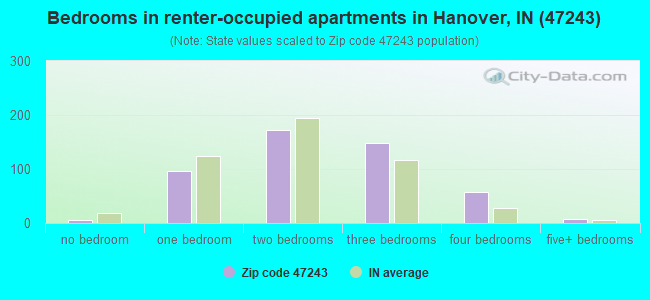
Houses and condos: 2,132 Renter-occupied apartments: 486
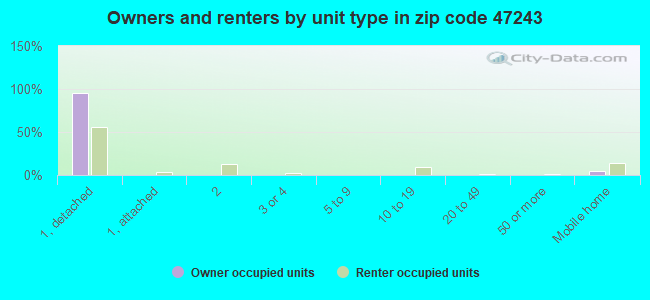
% of renters here:
25%
State:
29%
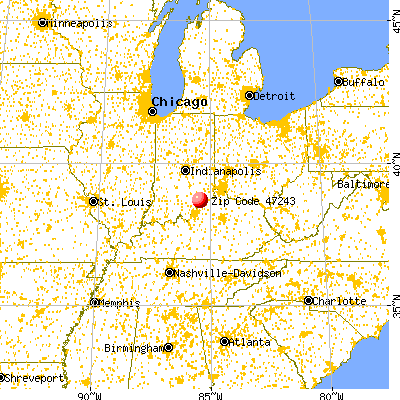
March 2022 cost of living index in zip code 47243: 77.9 (low, U.S. average is 100)
Land area: 34.9 sq. mi. Water area: 0.6 sq. mi.
Population density: 174 people per square mile
(very low).
OSM Map
General Map
Google Map
MSN Map
OSM Map
General Map
Google Map
MSN Map
OSM Map
General Map
Google Map
MSN Map
OSM Map
General Map
Google Map
MSN Map
Please wait while loading the map...
Real estate property taxes paid for housing units in 2022:
This zip code:
0.6% ($1,143)
Indiana:
0.7% ($1,467)
Median real estate property taxes paid for housing units with mortgages in 2022: $1,048 (0.6%) Median real estate property taxes paid for housing units with no mortgage in 2022: $1,318 (0.7%)
Business Search- 14 Million verified businesses
Males: 2,973
(49.0%)
Females: 3,093
(51.0%)
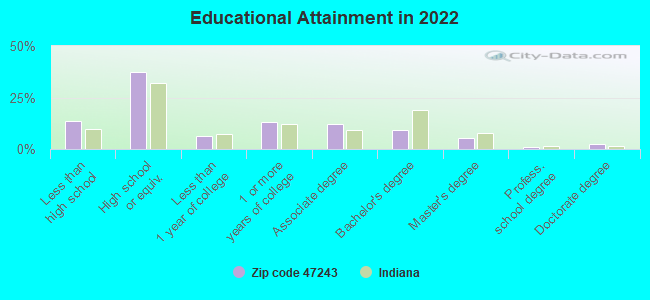
For population 25 years and over in 47243:
High school or higher: 85.9%
Bachelor's degree or higher: 17.9%
Graduate or professional degree: 8.8%
Unemployed: 2.9%
Mean travel time to work (commute): 20.9 minutes
For population 15 years and over in 47243:
Never married: 37.7%
Now married: 45.0%
Separated: 1.4%
Widowed: 5.4%
Divorced: 10.5%
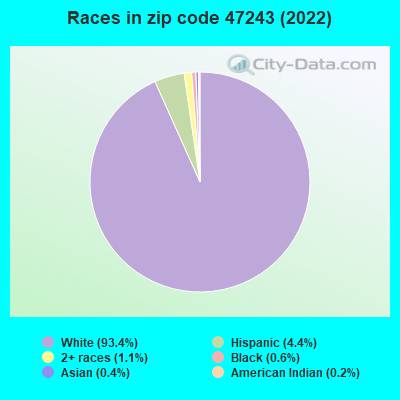
Zip code 47243 compared to state average:
Black race population percentage significantly below state average.
Hispanic race population percentage below state average.
Median age below state average.
Foreign-born population percentage significantly below state average.
Length of stay since moving in above state average.
Number of college students above state average.
Percentage of population with a bachelor's degree or higher below state average.
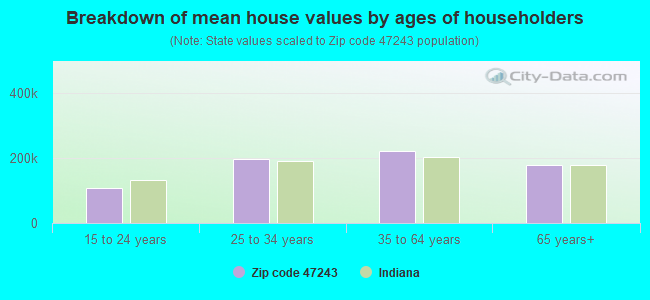
Estimated median house/condo value in 2022: $181,533
47243:
$181,533
Indiana:
$208,700
Median resident age:
This zip code:
33.8 years
Indiana median age:
38.2 years
Average household size:
This zip code:
2.7 people
Indiana:
2.4 people
Averages for the 2020 tax year for zip code 47243, filed in 2021:
Average Adjusted Gross Income (AGI) in 2020: $52,541 (Individual Income Tax Returns)
Here:
$52,541
State:
$64,978
Salary/wage: $45,592 (reported on 81.9% of returns)
Here:
$45,592
State:
$55,245
(% of AGI for various income ranges: 1110.5% for AGIs below $25k, 3462.3% for AGIs $25k-50k, 6120.7% for AGIs $50k-75k, 8563.5% for AGIs $75k-100k, 13985.0% for AGIs $100k-200k)
Taxable interest for individuals: $863 (reported on 20.6% of returns)
This zip code:
$863
Indiana:
$1,351
(% of AGI for various income ranges: 9.7% for AGIs below $25k, 10.2% for AGIs $25k-50k, 20.0% for AGIs $50k-75k, 34.7% for AGIs $75k-100k, 39.4% for AGIs $100k-200k)
Ordinary dividends: $4,221 (reported on 12.2% of returns)
Here:
$4,221
State:
$5,827
(% of AGI for various income ranges: 10.9% for AGIs below $25k, 13.2% for AGIs $25k-50k, 70.7% for AGIs $50k-75k, 170.0% for AGIs $75k-100k, 246.2% for AGIs $100k-200k)
Net capital gain/loss in AGI: +$6,319 (reported on 11.3% of returns)
Here:
+$6,319
State:
+$17,730
(% of AGI for various income ranges: 9.3% for AGIs below $25k, 20.2% for AGIs $25k-50k, 62.4% for AGIs $50k-75k, 104.1% for AGIs $75k-100k, 496.3% for AGIs $100k-200k)
Profit/loss from business: +$11,262 (reported on 10.1% of returns)
Here:
+$11,262
State:
+$12,144
(% of AGI for various income ranges: 54.1% for AGIs below $25k, 102.0% for AGIs $25k-50k, 94.1% for AGIs $50k-75k, 234.7% for AGIs $75k-100k, 690.6% for AGIs $100k-200k)
Taxable individual retirement arrangement distribution: $13,691 (reported on 9.2% of returns)
47243:
$13,691
Indiana:
$18,302
(% of AGI for various income ranges: 49.1% for AGIs below $25k, 76.0% for AGIs $25k-50k, 158.6% for AGIs $50k-75k, 258.8% for AGIs $75k-100k, 856.9% for AGIs $100k-200k)
Total itemized deductions: $36,867 (reported on 2.5% of returns)
Here:
$36,867
State:
$35,601
(% of AGI for various income ranges: 345.9% for AGIs $50k-75k, 755.6% for AGIs $100k-200k)
Charity contributions: $13,450 (reported on 2.5% of returns)
Here:
$13,450
State:
$15,596
(% of AGI for various income ranges: 91.7% for AGIs $50k-75k, 338.1% for AGIs $100k-200k)
Taxes paid: $6,500 (reported on 2.9% of returns)
47243:
$6,500
State:
$7,542
(% of AGI for various income ranges: 56.6% for AGIs $50k-75k, 181.9% for AGIs $100k-200k)
Earned income credit: $2,159 (reported on 19.3% of returns)
Here:
$2,159
State:
$2,298
(% of AGI for various income ranges: 88.4% for AGIs below $25k, 80.0% for AGIs $25k-50k)
Percentage of individuals using paid preparers for their 2020 taxes: 95.8%
Here:
96%
State:
94%
(% for various income ranges: 94.9% for AGIs below $25k, 95.8% for AGIs $25k-50k, 94.6% for AGIs $50k-75k, 95.7% for AGIs $75k-100k, 100.0% for AGIs $100k-200k, 100.0% for AGIs over 200k)
Averages for the 2012 tax year for zip code 47243, filed in 2013:
Average Adjusted Gross Income (AGI) in 2012: $42,416 (Individual Income Tax Returns)
Here:
$42,416
State:
$52,932
Salary/wage: $38,086 (reported on 81.9% of returns)
Here:
$38,086
State:
$45,173
(% of AGI for various income ranges: 72.9% for AGIs below $25k, 80.9% for AGIs $25k-50k, 76.5% for AGIs $50k-75k, 77.9% for AGIs $75k-100k, 63.5% for AGIs $100k-200k)
Taxable interest for individuals: $1,000 (reported on 28.2% of returns)
This zip code:
$1,000
Indiana:
$1,311
(% of AGI for various income ranges: 1.0% for AGIs below $25k, 0.5% for AGIs $25k-50k, 0.5% for AGIs $50k-75k, 0.5% for AGIs $75k-100k, 0.8% for AGIs $100k-200k)
Ordinary dividends: $3,994 (reported on 15.0% of returns)
Here:
$3,994
State:
$4,690
(% of AGI for various income ranges: 0.7% for AGIs below $25k, 0.8% for AGIs $25k-50k, 0.9% for AGIs $50k-75k, 1.9% for AGIs $75k-100k, 2.3% for AGIs $100k-200k)
Net capital gain/loss in AGI: +$2,593 (reported on 12.8% of returns)
Here:
+$2,593
State:
+$10,406
(% of AGI for various income ranges: 0.2% for AGIs $25k-50k, 0.2% for AGIs $50k-75k, 1.1% for AGIs $75k-100k, 1.8% for AGIs $100k-200k)
Profit/loss from business: +$11,422 (reported on 11.9% of returns)
Here:
+$11,422
State:
+$11,105
(% of AGI for various income ranges: 3.4% for AGIs below $25k, 2.6% for AGIs $25k-50k, 3.1% for AGIs $50k-75k, 2.2% for AGIs $75k-100k, 4.3% for AGIs $100k-200k)
Taxable individual retirement arrangement distribution: $13,730 (reported on 8.8% of returns)
47243:
$13,730
Indiana:
$13,841
(% of AGI for various income ranges: 2.2% for AGIs below $25k, 1.9% for AGIs $25k-50k, 2.3% for AGIs $50k-75k, 2.8% for AGIs $75k-100k, 4.3% for AGIs $100k-200k)
Total itemized deductions: $18,891 (23% of AGI, reported on 19.4% of returns)
Here:
$18,891
State:
$20,913
Here:
23.0% of AGI
State:
18.2% of AGI
(% of AGI for various income ranges: 6.8% for AGIs below $25k, 6.2% for AGIs $25k-50k, 7.8% for AGIs $50k-75k, 9.3% for AGIs $75k-100k, 11.4% for AGIs $100k-200k)
Charity contributions: $4,694 (reported on 15.4% of returns)
Here:
$4,694
State:
$4,697
(% of AGI for various income ranges: 0.9% for AGIs below $25k, 0.5% for AGIs $25k-50k, 1.4% for AGIs $50k-75k, 2.3% for AGIs $75k-100k, 2.8% for AGIs $100k-200k)
Taxes paid: $5,009 (reported on 19.4% of returns)
47243:
$5,009
State:
$7,456
(% of AGI for various income ranges: 0.7% for AGIs below $25k, 0.9% for AGIs $25k-50k, 1.8% for AGIs $50k-75k, 2.6% for AGIs $75k-100k, 4.2% for AGIs $100k-200k)
Earned income credit: $2,146 (reported on 21.1% of returns)
Here:
$2,146
State:
$2,265
(% of AGI for various income ranges: 6.4% for AGIs below $25k, 1.4% for AGIs $25k-50k)
Percentage of individuals using paid preparers for their 2012 taxes: 66.5%
Here:
67%
State:
53%
(% for various income ranges: 64.4% for AGIs below $25k, 66.0% for AGIs $25k-50k, 65.7% for AGIs $50k-75k, 75.0% for AGIs $75k-100k, 72.2% for AGIs $100k-200k)
Averages for the 2004 tax year for zip code 47243, filed in 2005:
Average Adjusted Gross Income (AGI) in 2004: $38,606 (Individual Income Tax Returns)
Here:
$38,606
State:
$44,790
Salary/wage: $35,053 (reported on 87.0% of returns)
Here:
$35,053
State:
$39,615
(% of AGI for various income ranges: 91.0% for AGIs below $10k, 78.8% for AGIs $10k-25k, 85.5% for AGIs $25k-50k, 85.1% for AGIs $50k-75k, 79.1% for AGIs $75k-100k, 61.4% for AGIs over 100k)
Taxable interest for individuals: $1,707 (reported on 38.3% of returns)
This zip code:
$1,707
Indiana:
$1,535
(% of AGI for various income ranges: 4.1% for AGIs below $10k, 1.9% for AGIs $10k-25k, 1.5% for AGIs $25k-50k, 0.8% for AGIs $50k-75k, 1.8% for AGIs $75k-100k, 2.7% for AGIs over 100k)
Taxable dividends: $3,071 (reported on 16.1% of returns)
Here:
$3,071
State:
$2,998
(% of AGI for various income ranges: 0.7% for AGIs below $10k, 1.0% for AGIs $10k-25k, 0.5% for AGIs $25k-50k, 1.1% for AGIs $50k-75k, 1.1% for AGIs $75k-100k, 2.8% for AGIs over 100k)
Net capital gain/loss: +$3,114 (reported on 12.8% of returns)
Here:
+$3,114
State:
+$8,619
(% of AGI for various income ranges: -0.4% for AGIs below $10k, -0.3% for AGIs $10k-25k, 0.6% for AGIs $25k-50k, 1.0% for AGIs $50k-75k, 0.7% for AGIs $75k-100k, 2.8% for AGIs over 100k)
Profit/loss from business: +$8,317 (reported on 12.2% of returns)
Here:
+$8,317
State:
+$10,071
(% of AGI for various income ranges: 3.2% for AGIs below $10k, 3.5% for AGIs $10k-25k, 2.4% for AGIs $25k-50k, 2.4% for AGIs $50k-75k, 2.9% for AGIs $75k-100k, 2.5% for AGIs over 100k)
IRA payment deduction: $3,036 (reported on 1.2% of returns)
47243:
$3,036
Indiana:
$2,840
Total itemized deductions: $14,605 (21% of AGI, reported on 23.1% of returns)
Here:
$14,605
State:
$17,065
Here:
20.5% of AGI
State:
19.5% of AGI
(% of AGI for various income ranges: 3.0% for AGIs below $10k, 5.2% for AGIs $10k-25k, 6.6% for AGIs $25k-50k, 9.6% for AGIs $50k-75k, 10.9% for AGIs $75k-100k, 11.0% for AGIs over 100k)
Charity contributions deductions: $3,505 (5% of AGI, reported on 18.8% of returns)
Here:
$3,505
State:
$3,550
Here:
4.5% of AGI
State:
3.8% of AGI
(% of AGI for various income ranges: 0.7% for AGIs $10k-25k, 0.9% for AGIs $25k-50k, 1.7% for AGIs $50k-75k, 2.3% for AGIs $75k-100k, 3.0% for AGIs over 100k)
Total tax: $4,995 (reported on 73.0% of returns)
47243:
$4,995
State:
$6,914
(% of AGI for various income ranges: 2.0% for AGIs below $10k, 4.0% for AGIs $10k-25k, 6.5% for AGIs $25k-50k, 8.4% for AGIs $50k-75k, 10.9% for AGIs $75k-100k, 17.0% for AGIs over 100k)
Earned income credit: $1,716 (reported on 16.1% of returns)
Here:
$1,716
State:
$1,685
Percentage of individuals using paid preparers for their 2004 taxes: 69.2%
Here:
69%
State:
59%
(% for various income ranges: 58.4% for AGIs below $10k, 72.0% for AGIs $10k-25k, 75.1% for AGIs $25k-50k, 70.2% for AGIs $50k-75k, 67.5% for AGIs $75k-100k, 68.4% for AGIs over 100k)
Household received Food Stamps/SNAP in the past 12 months: 152 Household did not receive Food Stamps/SNAP in the past 12 months: 1,755
Women who had a birth in the past 12 months: 63 (40 now married, 22 unmarried) Women who did not have a birth in the past 12 months: 1,583 (489 now married, 1,090 unmarried)
Housing units in zip code 47243 with a mortgage: 823 (109 second mortgage, 78 both second mortgage and home equity loan) Houses without a mortgage: 47
Median monthly owner costs for units with a mortgage: $1,068 Median monthly owner costs for units without a mortgage: $538
Residents with income below the poverty level in 2022:
This zip code:
10.3%
Whole state:
12.6%
Residents with income below 50% of the poverty level in 2022:
This zip code:
4.5%
Whole state:
6.3%
Median number of rooms in houses and condos:
Here:
7.0
State:
6.6
Median number of rooms in apartments:
Here:
5.0
State:
4.3
Notable locations in this zip code not listed on our city pages
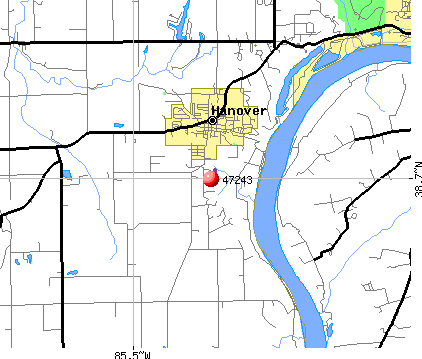
Notable locations in zip code 47243: Marble Hill Nuclear Power Station (A), New London (B), King Landing (C), Hanover Volunteer Fire Company (D). Display/hide their locations on the map
Cemeteries: Zion Cemetery (1), Greenbriar Cemetery (2), Old Bethel Cemetery (3), Carmel Cemetery (4), Hanover Cemetery (5). Display/hide their locations on the map
In group quarters: 973 (-1 institutionalized population)
Size of family households: 587 2-persons, 415 3-persons, 225 4-persons, 97 5-persons, 21 6-persons, 68 7-or-more-persons
Size of nonfamily households: 458 1-person, 28 2-persons, 7 4-persons
771 married couples with children.
407 single-parent households (247 men, 160 women).
94.7% of residents of 47243 zip code speak English at home.
1.9% of residents speak Spanish at home (75% very well, 25% well).
2.6% of residents speak other Indo-European language at home (100% very well).
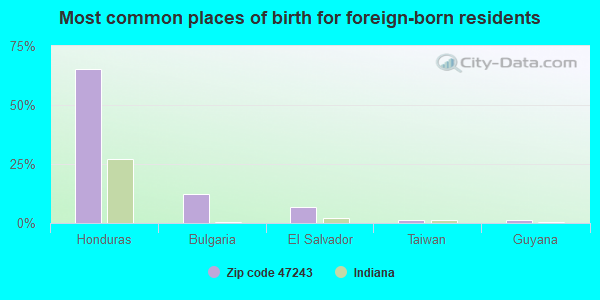
Foreign born population: 72 (1.2%) (55.8% of them are naturalized citizens)
This zip code:
1.2%
Whole state:
6.1%
65%Honduras
12%Bulgaria
7%El Salvador
1%Taiwan
1%Guyana
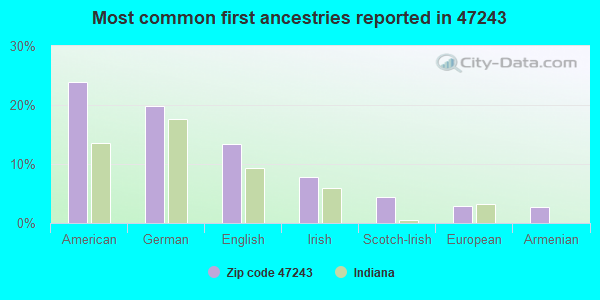
24%American
20%German
13%English
8%Irish
4%Scotch-Irish
3%European
3%Armenian
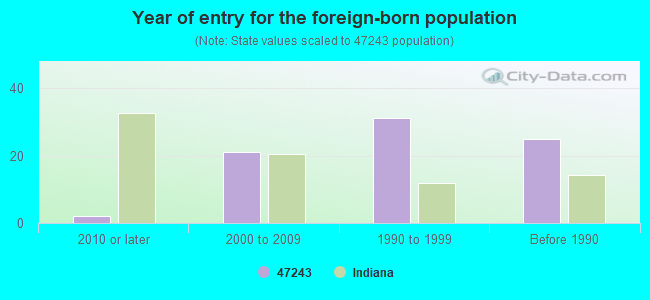
Year of entry for the foreign-born population
22010 or later
212000 to 2009
311990 to 1999
25Before 1990
Facilities with environmental interests located in this zip code:
HANOVER WWTP (HANOVER BEACH HILL RD & MAIN ST in HANOVER, IN)
STATE MASTER (Indiana facility tracking) - CRTK-816, EPCRA National Pollutant Discharge Elimination System NON-MAJOR (Tracking pollutant discharge elimination systems) - permit Business SIC classification: SEWERAGE SYSTEMS Organizations: K. SCOTT WILLIAMS, CERT #12315 (CONTACT/OPERATOR)
, TOWN COUNCIL OF HANOVER (CONTACT/OWNER)
Alternative names: HANOVER MUNICIPAL STP
PSI MARBLE HILL NUCLEAR GENERATING STATION (MARBLE HILL RD in PAYNESVILLE, IN)
STATE MASTER (Indiana facility tracking) (Resource Conservation and Recovery Act (tracking hazardous waste))
BULK TRUCK AND TRANSPORT (HWY 56 AND 62 W in HANOVER, IN)
STATE MASTER (Indiana facility tracking) Small Quantity Generators, between 100 kg and 1000 kg of hazardous waste/month (Resource Conservation and Recovery Act (tracking hazardous waste)) Organizations: BULK TRUCK & TRANSPORT (CONTACT/OPERATOR)
, MAURICE AUXIER (CONTACT/OWNER)
HANOVER COLLEGE SCIENCE CTR (607 BALL DR in HANOVER, IN)
STATE MASTER (Indiana facility tracking) Conditionally Exempt Small Quantity Generators, less than 100 kg/month of hazardous waste (Resource Conservation and Recovery Act (tracking hazardous waste)) Organizations: BD OF TRUSTEES HANOVER COLLEGE (CONTACT/OWNER)
DAVE OMARA CONTRACTOR PLANT 3 (2311 S. STATE RD. 62 in HANOVER, IN)
STATE MASTER (Indiana facility tracking) TRI REPORTER (Tracking of toxic chemicals releasing facilities) Business SIC classification: ASPHALT PAVING MIXTURES AND BLOCKS
Housing units lacking complete plumbing facilities: 1.8% Housing units lacking complete kitchen facilities: 4.3%
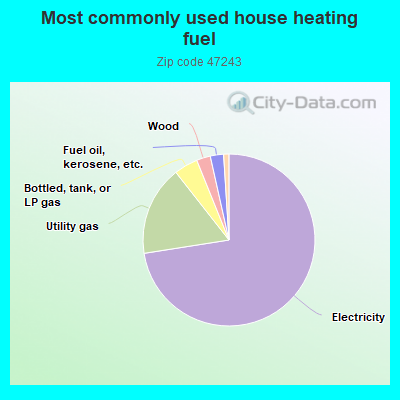
72.6%Electricity
16.9%Utility gas
4.5%Bottled, tank, or LP gas
2.6%Wood
2.5%Fuel oil, kerosene, etc.
1.0%Other fuel
Population in 1990: 4,900. Population change in the 1990s: +1,102 (+22.5%).
Place of birth for U.S.-born residents:
This state: 3,999
Northeast: 162
Midwest: 562
South: 976
West: 241
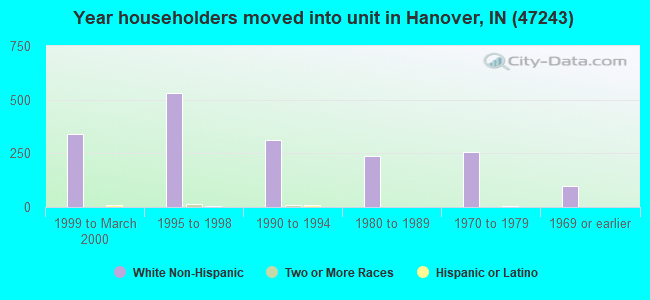
48% of the 47243 zip code residents lived in the same house 5 years ago. Out of people who lived in different houses, 40% lived in this county. Out of people who lived in different counties, 50% lived in Indiana.
87% of the 47243 zip code residents lived in the same house 1 year ago. Out of people who lived in different houses, 66% moved from this county. Out of people who lived in different houses, 13% moved from different county within same state. Out of people who lived in different houses, 19% moved from different state.
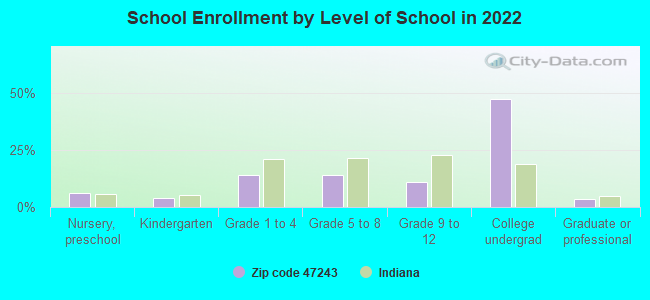
Private vs. public school enrollment:
Students in private schools in grades 1 to 8 (elementary and middle school): 114
Here:
21.1%
Indiana:
14.9%
Students in private schools in grades 9 to 12 (high school): 27
Here:
12.6%
Indiana:
11.4%
Students in private undergraduate colleges: 805
Here:
84.7%
Indiana:
22.3%
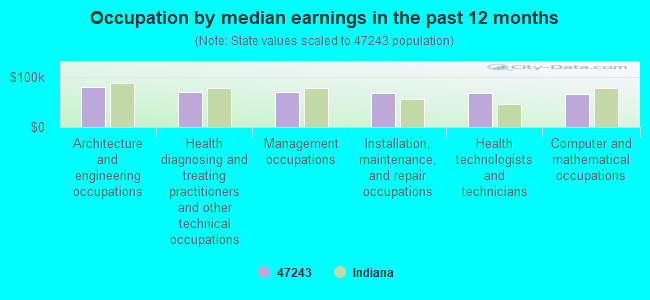
Occupation by median earnings in the past 12 months ($)
79,473Architecture and engineering occupations
70,277Health diagnosing and treating practitioners and other technical occupations
69,500Management occupations
68,040Installation, maintenance, and repair occupations
66,833Health technologists and technicians
66,724Computer and mathematical occupations
Top industries in this zip code by the number of employees in 2005:
Educational Services: Colleges, Universities, and Professional Schools (500-999 employees: 1 establishment)
Health Care and Social Assistance: Nursing Care Facilities (100-249: 1, 50-99: 1)
Accommodation and Food Services: Food Service Contractors (50-99: 1, 1-4: 1)
Accommodation and Food Services: Limited-Service Restaurants (50-99: 1, 1-4: 1)
Accommodation and Food Services: Full-Service Restaurants (20-49: 2, 1-4: 1)
Accommodation and Food Services: Rooming and Boarding Houses (10-19: 1, 5-9: 4, 1-4: 3)
Construction: New Single-Family Housing Construction (except Operative Builders) (10-19: 1, 5-9: 2, 1-4: 1)
People in group quarters in 2010:
814 people in college/university student housing
119 people in nursing facilities/skilled-nursing facilities
3 people in residential treatment centers for adults
People in group quarters in 2000:
973 people in college dormitories (includes college quarters off campus)
121 people in nursing homes
4 people in religious group quarters
Fatal accident statistics in 2014:
Fatal accident count: 2
Vehicles involved in fatal accidents: 5
Fatal accidents caused by drunken drivers: 1
Fatalities: 2
Persons involved in fatal accidents: 7
Pedestrians involved in fatal accidents: 0
Fatal accident statistics in 2013:
Fatal accident count: 1
Vehicles involved in fatal accidents: 1
Fatal accidents caused by drunken drivers: 0
Fatalities: 1
Persons involved in fatal accidents: 1
Pedestrians involved in fatal accidents: 0
2002 - 2018 National Fire Incident Reporting System (NFIRS) incidents
According to the data from the years 2002 - 2018 the average number of fires per year is 17. The highest number of fire incidents - 45 took place in 2010, and the least - 1 in 2015. The data has a declining trend.
When looking into fire subcategories, the most reports belonged to: Structure Fires (49.5%), and Outside Fires (32.0%).
Fire incident types reported to NFIRS in Zip Code 47243


 Nearest zip codes: 47147, 47138, 47162, 40045, 47104, 40006.


 According to the data from the years 2002 - 2018 the average number of fires per year is 17. The highest number of fire incidents - 45 took place in 2010, and the least - 1 in 2015. The data has a declining trend.
 When looking into fire subcategories, the most reports belonged to: Structure Fires (49.5%), and Outside Fires (32.0%).