Estimated zip code population in 2022: 2,068 Zip code population in 2010: 1,849 Zip code population in 2000: 1,863
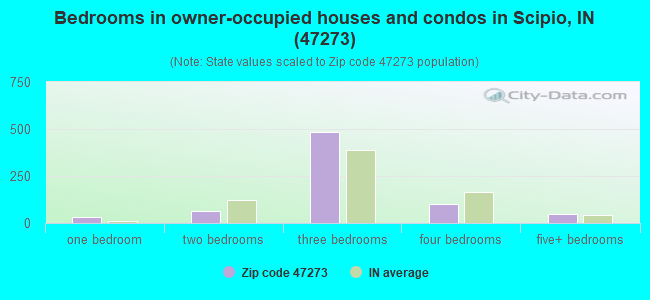
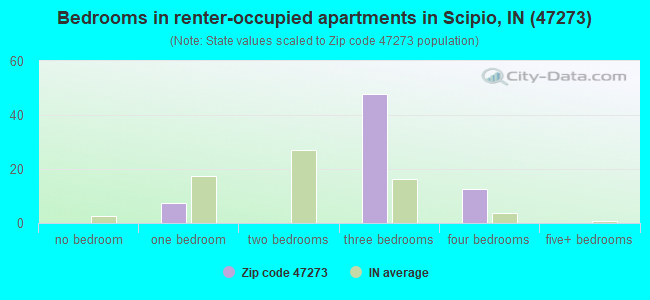
Houses and condos: 870 Renter-occupied apartments: 68
% of renters here:
9%
State:
29%
March 2022 cost of living index in zip code 47273: 84.8 (less than average, U.S. average is 100)
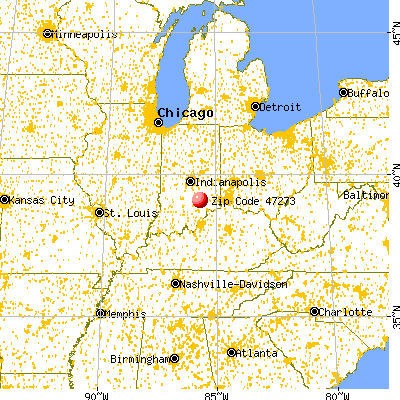
Land area: 30.9 sq. mi. Water area: 0.3 sq. mi.
Population density: 67 people per square mile
(very low).
OSM Map
General Map
Google Map
MSN Map
OSM Map
General Map
Google Map
MSN Map
OSM Map
General Map
Google Map
MSN Map
OSM Map
General Map
Google Map
MSN Map
Please wait while loading the map...
Real estate property taxes paid for housing units in 2022:
This zip code:
0.6% ($1,276)
Indiana:
0.7% ($1,467)
Median real estate property taxes paid for housing units with mortgages in 2022: $1,276 (0.6%) Median real estate property taxes paid for housing units with no mortgage in 2022: $1,342 (0.7%)
Business Search- 14 Million verified businesses
Males: 981
(47.4%)
Females: 1,087
(52.6%)
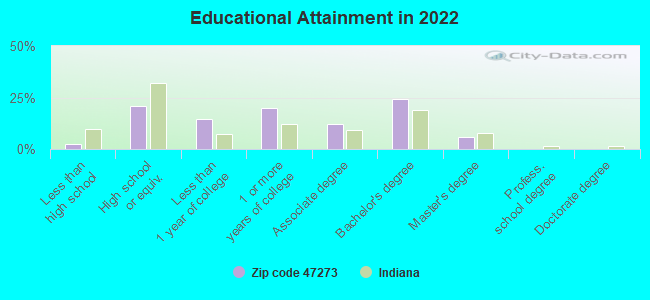
For population 25 years and over in 47273:
High school or higher: 97.5%
Bachelor's degree or higher: 29.8%
Graduate or professional degree: 5.7%
Unemployed: 2.1%
Mean travel time to work (commute): 28.5 minutes
For population 15 years and over in 47273:
Never married: 22.1%
Now married: 64.0%
Separated: 0.4%
Widowed: 3.4%
Divorced: 10.0%
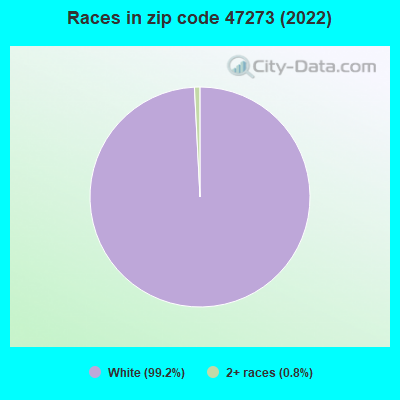
Zip code 47273 compared to state average:
Black race population percentage significantly below state average.
Hispanic race population percentage significantly below state average.
Foreign-born population percentage significantly below state average.
Renting percentage significantly below state average.
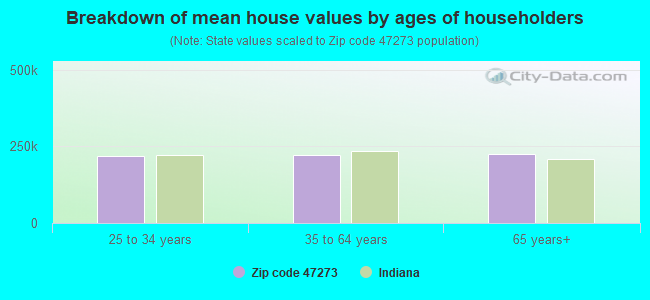
Estimated median house/condo value in 2022: $212,792
47273:
$212,792
Indiana:
$208,700
Median resident age:
This zip code:
37.3 years
Indiana median age:
38.2 years
Average household size:
This zip code:
2.6 people
Indiana:
2.4 people
Averages for the 2020 tax year for zip code 47273, filed in 2021:
Average Adjusted Gross Income (AGI) in 2020: $56,912 (Individual Income Tax Returns)
Here:
$56,912
State:
$64,978
Salary/wage: $52,891 (reported on 81.7% of returns)
Here:
$52,891
State:
$55,245
(% of AGI for various income ranges: 835.0% for AGIs below $25k, 3491.6% for AGIs $25k-50k, 7113.3% for AGIs $50k-75k, 9390.0% for AGIs $75k-100k, 15518.9% for AGIs $100k-200k)
Taxable interest for individuals: $404 (reported on 28.0% of returns)
This zip code:
$404
Indiana:
$1,351
(% of AGI for various income ranges: 21.5% for AGIs below $25k, 7.9% for AGIs $25k-50k, 15.0% for AGIs $50k-75k, 11.0% for AGIs $75k-100k, 20.0% for AGIs $100k-200k)
Ordinary dividends: $1,233 (reported on 12.9% of returns)
Here:
$1,233
State:
$5,827
(% of AGI for various income ranges: 22.5% for AGIs below $25k, 21.6% for AGIs $25k-50k, 25.0% for AGIs $50k-75k, 35.6% for AGIs $100k-200k)
Net capital gain/loss in AGI: +$6,264 (reported on 11.8% of returns)
Here:
+$6,264
State:
+$17,730
(% of AGI for various income ranges: 15.0% for AGIs below $25k, 21.6% for AGIs $25k-50k, 18.3% for AGIs $50k-75k, 31.0% for AGIs $75k-100k, 627.8% for AGIs $100k-200k)
Profit/loss from business: +$5,345 (reported on 11.8% of returns)
Here:
+$5,345
State:
+$12,144
(% of AGI for various income ranges: 101.5% for AGIs below $25k, 135.3% for AGIs $25k-50k, 67.0% for AGIs $75k-100k, 67.8% for AGIs $100k-200k)
Taxable individual retirement arrangement distribution: $10,729 (reported on 7.5% of returns)
47273:
$10,729
Indiana:
$18,302
(% of AGI for various income ranges: 159.5% for AGIs below $25k, 360.0% for AGIs $50k-75k)
Total itemized deductions: $21,833 (reported on 3.2% of returns)
Here:
$21,833
State:
$35,601
(% of AGI for various income ranges: 545.8% for AGIs $50k-75k)
Taxes paid: $5,333 (reported on 3.2% of returns)
47273:
$5,333
State:
$7,542
(% of AGI for various income ranges: 84.2% for AGIs $25k-50k)
Earned income credit: $1,829 (reported on 15.1% of returns)
Here:
$1,829
State:
$2,298
(% of AGI for various income ranges: 63.5% for AGIs below $25k, 67.9% for AGIs $25k-50k)
Percentage of individuals using paid preparers for their 2020 taxes: 94.6%
Here:
95%
State:
94%
(% for various income ranges: 92.6% for AGIs below $25k, 95.7% for AGIs $25k-50k, 94.1% for AGIs $50k-75k, 92.3% for AGIs $75k-100k, 100.0% for AGIs $100k-200k)
Averages for the 2012 tax year for zip code 47273, filed in 2013:
Average Adjusted Gross Income (AGI) in 2012: $46,075 (Individual Income Tax Returns)
Here:
$46,075
State:
$52,932
Salary/wage: $44,688 (reported on 84.1% of returns)
Here:
$44,688
State:
$45,173
(% of AGI for various income ranges: 68.8% for AGIs below $25k, 81.6% for AGIs $25k-50k, 85.1% for AGIs $50k-75k, 80.6% for AGIs $75k-100k, 83.9% for AGIs $100k-200k)
Taxable interest for individuals: $500 (reported on 28.4% of returns)
This zip code:
$500
Indiana:
$1,311
(% of AGI for various income ranges: 1.5% for AGIs below $25k, 0.2% for AGIs $25k-50k, 0.3% for AGIs $50k-75k, 0.2% for AGIs $75k-100k)
Ordinary dividends: $940 (reported on 11.4% of returns)
Here:
$940
State:
$4,690
(% of AGI for various income ranges: 0.9% for AGIs below $25k, 0.5% for AGIs $25k-50k, 0.2% for AGIs $75k-100k)
Net capital gain/loss in AGI: +$511 (reported on 10.2% of returns)
Here:
+$511
State:
+$10,406
(% of AGI for various income ranges: 0.4% for AGIs $25k-50k, 0.4% for AGIs $75k-100k)
Profit/loss from business: +$4,383 (reported on 13.6% of returns)
Here:
+$4,383
State:
+$11,105
(% of AGI for various income ranges: 2.4% for AGIs below $25k, 2.2% for AGIs $25k-50k, 1.7% for AGIs $50k-75k, 1.0% for AGIs $75k-100k)
Taxable individual retirement arrangement distribution: $8,475 (reported on 9.1% of returns)
47273:
$8,475
Indiana:
$13,841
Total itemized deductions: $16,235 (18% of AGI, reported on 19.3% of returns)
Here:
$16,235
State:
$20,913
Here:
18.5% of AGI
State:
18.2% of AGI
(% of AGI for various income ranges: 7.7% for AGIs $25k-50k, 6.0% for AGIs $50k-75k, 6.0% for AGIs $75k-100k, 10.0% for AGIs $100k-200k)
Charity contributions: $3,658 (reported on 13.6% of returns)
Here:
$3,658
State:
$4,697
(% of AGI for various income ranges: 0.7% for AGIs $25k-50k, 0.4% for AGIs $50k-75k, 1.2% for AGIs $75k-100k, 2.3% for AGIs $100k-200k)
Taxes paid: $5,294 (reported on 19.3% of returns)
47273:
$5,294
State:
$7,456
(% of AGI for various income ranges: 1.6% for AGIs $25k-50k, 1.9% for AGIs $50k-75k, 1.9% for AGIs $75k-100k, 4.1% for AGIs $100k-200k)
Earned income credit: $1,867 (reported on 17.0% of returns)
Here:
$1,867
State:
$2,265
(% of AGI for various income ranges: 4.9% for AGIs below $25k, 1.0% for AGIs $25k-50k)
Percentage of individuals using paid preparers for their 2012 taxes: 59.1%
Here:
59%
State:
53%
(% for various income ranges: 54.5% for AGIs below $25k, 59.1% for AGIs $25k-50k, 66.7% for AGIs $50k-75k, 60.0% for AGIs $75k-100k, 62.5% for AGIs $100k-200k)
Averages for the 2004 tax year for zip code 47273, filed in 2005:
Average Adjusted Gross Income (AGI) in 2004: $38,062 (Individual Income Tax Returns)
Here:
$38,062
State:
$44,790
Salary/wage: $37,140 (reported on 87.1% of returns)
Here:
$37,140
State:
$39,615
(% of AGI for various income ranges: 111.5% for AGIs below $10k, 72.6% for AGIs $10k-25k, 80.0% for AGIs $25k-50k, 88.5% for AGIs $50k-75k, 91.0% for AGIs $75k-100k, 84.8% for AGIs over 100k)
Taxable interest for individuals: $805 (reported on 40.5% of returns)
This zip code:
$805
Indiana:
$1,535
(% of AGI for various income ranges: 7.4% for AGIs below $10k, 2.6% for AGIs $10k-25k, 0.6% for AGIs $25k-50k, 0.7% for AGIs $50k-75k, 0.2% for AGIs $75k-100k, 0.7% for AGIs over 100k)
Taxable dividends: $339 (reported on 13.7% of returns)
Here:
$339
State:
$2,998
(% of AGI for various income ranges: 0.6% for AGIs below $10k, 0.2% for AGIs $10k-25k, 0.1% for AGIs $25k-50k, 0.0% for AGIs $50k-75k, 0.1% for AGIs $75k-100k, 0.2% for AGIs over 100k)
Net capital gain/loss: +$43 (reported on 10.3% of returns)
Here:
+$43
State:
+$8,619
(% of AGI for various income ranges: -0.5% for AGIs $10k-25k, 0.4% for AGIs $25k-50k, -0.1% for AGIs $50k-75k, 0.0% for AGIs $75k-100k)
Profit/loss from business: +$4,954 (reported on 14.5% of returns)
Here:
+$4,954
State:
+$10,071
(% of AGI for various income ranges: 3.8% for AGIs below $10k, 4.3% for AGIs $10k-25k, 2.6% for AGIs $25k-50k, 1.9% for AGIs $50k-75k, 0.6% for AGIs $75k-100k)
IRA payment deduction: $1,364 (reported on 1.2% of returns)
47273:
$1,364
Indiana:
$2,840
Total itemized deductions: $13,258 (21% of AGI, reported on 25.4% of returns)
Here:
$13,258
State:
$17,065
Here:
21.1% of AGI
State:
19.5% of AGI
(% of AGI for various income ranges: 6.7% for AGIs $10k-25k, 7.9% for AGIs $25k-50k, 8.6% for AGIs $50k-75k, 10.7% for AGIs $75k-100k, 11.6% for AGIs over 100k)
Charity contributions deductions: $2,559 (4% of AGI, reported on 18.8% of returns)
Here:
$2,559
State:
$3,550
Here:
3.8% of AGI
State:
3.8% of AGI
(% of AGI for various income ranges: 1.1% for AGIs $10k-25k, 0.6% for AGIs $25k-50k, 1.1% for AGIs $50k-75k, 2.0% for AGIs $75k-100k, 2.5% for AGIs over 100k)
Total tax: $4,143 (reported on 78.2% of returns)
47273:
$4,143
State:
$6,914
(% of AGI for various income ranges: 3.0% for AGIs below $10k, 3.8% for AGIs $10k-25k, 6.8% for AGIs $25k-50k, 8.3% for AGIs $50k-75k, 10.5% for AGIs $75k-100k, 14.7% for AGIs over 100k)
Earned income credit: $1,678 (reported on 13.4% of returns)
Here:
$1,678
State:
$1,685
Percentage of individuals using paid preparers for their 2004 taxes: 63.9%
Here:
64%
State:
59%
(% for various income ranges: 56.4% for AGIs below $10k, 65.4% for AGIs $10k-25k, 66.9% for AGIs $25k-50k, 62.6% for AGIs $50k-75k, 70.5% for AGIs $75k-100k, 56.7% for AGIs over 100k)
Household received Food Stamps/SNAP in the past 12 months: 21 Household did not receive Food Stamps/SNAP in the past 12 months: 766
Women who had a birth in the past 12 months: 50 (46 now married, 6 unmarried) Women who did not have a birth in the past 12 months: 438 (297 now married, 143 unmarried)
Housing units in zip code 47273 with a mortgage: 595 (61 second mortgage, 63 both second mortgage and home equity loan) Houses without a mortgage: 47
Median monthly owner costs for units with a mortgage: $1,301 Median monthly owner costs for units without a mortgage: $485
Residents with income below the poverty level in 2022:
This zip code:
2.2%
Whole state:
12.6%
Residents with income below 50% of the poverty level in 2022:
This zip code:
2.2%
Whole state:
6.3%
Median number of rooms in houses and condos:
Here:
6.5
State:
6.6
Median number of rooms in apartments:
Here:
6.1
State:
4.3
Notable locations in this zip code not listed on our city pages
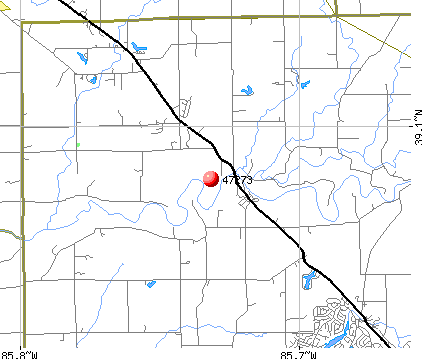
Streams, rivers, and creeks: Rock Creek (A), Wyaloosing Creek (B), Nettle Creek (C), Bennetts Branch (D), Bear Creek (E). Display/hide their locations on the map
Size of family households: 191 2-persons, 189 3-persons, 189 4-persons, 35 5-persons, 11 6-persons
Size of nonfamily households: 161 1-person, 6 2-persons
386 married couples with children.
26 single-parent households (26 men).
98.7% of residents of 47273 zip code speak English at home.
Foreign born population: 19 (0.9%) (100.0% of them are naturalized citizens)
This zip code:
0.9%
Whole state:
6.1%
89%Sweden
78%England
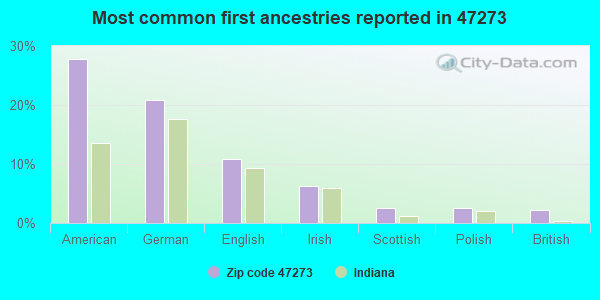
28%American
21%German
11%English
6%Irish
3%Scottish
3%Polish
2%British
Year of entry for the foreign-born population
202010 or later
02000 to 2009
01990 to 1999
27Before 1990
Facilities with environmental interests located in this zip code:
SCIPIO ELEMENTARY SCHOOL (6320 N HWY 7 in SCIPIO, IN)
(Geographic Names Information System) (National Center for Education Statistics) - STATE ID-3357 Organizations: JENNINGS COUNTY SCHOOLS (SCHOOL DISTRICT)
Housing units lacking complete plumbing facilities: 2.4% Housing units lacking complete kitchen facilities: 1.9%
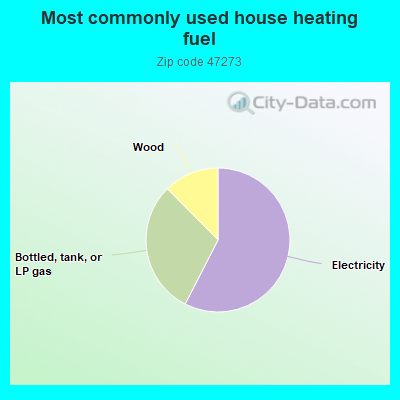
57.6%Electricity
30.1%Bottled, tank, or LP gas
12.4%Wood
Population in 1990: 5,043.
Place of birth for U.S.-born residents:
This state: 1,588
Northeast: 74
Midwest: 160
South: 118
West: 71
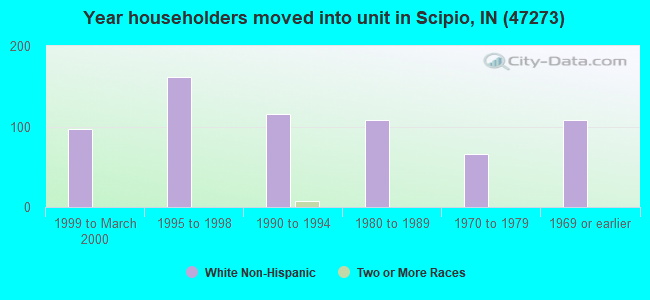
59% of the 47273 zip code residents lived in the same house 5 years ago. Out of people who lived in different houses, 59% lived in this county. Out of people who lived in different counties, 50% lived in Indiana.
85% of the 47273 zip code residents lived in the same house 1 year ago. Out of people who lived in different houses, 11% moved from this county. Out of people who lived in different houses, 87% moved from different county within same state.
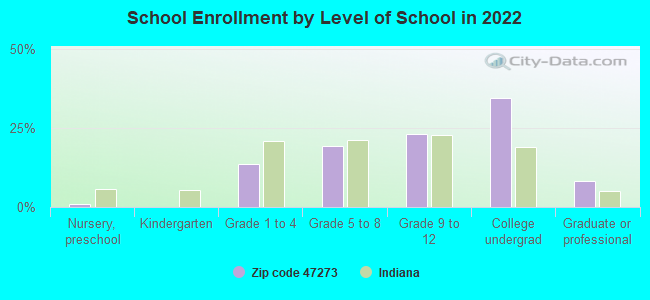
Private vs. public school enrollment:
Students in private schools in grades 1 to 8 (elementary and middle school): 19
Here:
13.5%
Indiana:
14.9%
Students in private schools in grades 9 to 12 (high school): 8
Here:
8.8%
Indiana:
11.4%
Students in private undergraduate colleges: 36
Here:
24.1%
Indiana:
22.3%
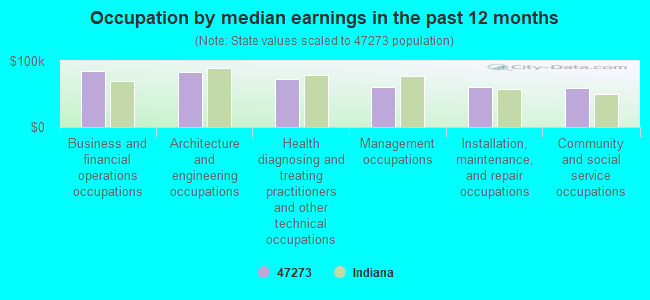
Occupation by median earnings in the past 12 months ($)
85,239Business and financial operations occupations
83,848Architecture and engineering occupations
72,509Health diagnosing and treating practitioners and other technical occupations
61,177Management occupations
60,574Installation, maintenance, and repair occupations
59,180Community and social service occupations
Top industries in this zip code by the number of employees in 2005:
Health Care and Social Assistance: Vocational Rehabilitation Services (50-99 employees: 1 establishment)
Other Services (except Public Administration): Religious Organizations (5-9: 1, 1-4: 1)
Wholesale Trade: Farm and Garden Machinery and Equipment Merchant Wholesalers (1-4: 2)
Construction: New Single-Family Housing Construction (except Operative Builders) (1-4: 2)
Finance and Insurance: Insurance Agencies and Brokerages (1-4: 1)
Construction: Site Preparation Contractors (1-4: 1)
Construction: Plumbing, Heating, and Air-Conditioning Contractors (1-4: 1)
Construction: Masonry Contractors (1-4: 1)
People in group quarters in 2010:
4 people in group homes intended for adults
Fatal accident statistics in 2013:
Fatal accident count: 1
Vehicles involved in fatal accidents: 1
Fatal accidents caused by drunken drivers: 0
Fatalities: 1
Persons involved in fatal accidents: 1
Pedestrians involved in fatal accidents: 0
Fatal accident statistics in 2012:
Fatal accident count: 1
Vehicles involved in fatal accidents: 1
Fatal accidents caused by drunken drivers: 1
Fatalities: 1
Persons involved in fatal accidents: 1
Pedestrians involved in fatal accidents: 0
2004 - 2018 National Fire Incident Reporting System (NFIRS) incidents
According to the data from the years 2004 - 2018 the average number of fire incidents per year is 22. The highest number of fire incidents - 65 took place in 2008, and the least - 0 in 2013. The data has a dropping trend.
When looking into fire subcategories, the most incidents belonged to: Outside Fires (45.3%), and Structure Fires (34.3%).
Fire incident types reported to NFIRS in Zip Code 47273


 Nearest zip codes: 47232, 47265, 47244, 47247, 47282, 47283.


 According to the data from the years 2004 - 2018 the average number of fire incidents per year is 22. The highest number of fire incidents - 65 took place in 2008, and the least - 0 in 2013. The data has a dropping trend.
 When looking into fire subcategories, the most incidents belonged to: Outside Fires (45.3%), and Structure Fires (34.3%).