Estimated zip code population in 2022: 1,414 Zip code population in 2010: 1,546 Zip code population in 2000: 1,431
Houses and condos: 579 Renter-occupied apartments: 115
% of renters here:
21%
State:
29%
March 2022 cost of living index in zip code 47360: 85.7 (less than average, U.S. average is 100)
Land area: 34.4 sq. mi. Water area: 0.6 sq. mi.
Population density: 41 people per square mile
(very low).
OSM Map
General Map
Google Map
MSN Map
OSM Map
General Map
Google Map
MSN Map
OSM Map
General Map
Google Map
MSN Map
OSM Map
General Map
Google Map
MSN Map
Please wait while loading the map...
Real estate property taxes paid for housing units in 2022:
This zip code:
0.6% ($1,082)
Indiana:
0.7% ($1,467)
Median real estate property taxes paid for housing units with mortgages in 2022: $1,241 (0.6%) Median real estate property taxes paid for housing units with no mortgage in 2022: $936 (0.6%)
Business Search- 14 Million verified businesses
Males: 707
(50.0%)
Females: 706
(50.0%)
For population 25 years and over in 47360:
High school or higher: 84.7%
Bachelor's degree or higher: 20.4%
Graduate or professional degree: 9.4%
Unemployed: 7.2%
Mean travel time to work (commute): 25.6 minutes
For population 15 years and over in 47360:
Never married: 30.9%
Now married: 48.4%
Separated: 2.1%
Widowed: 5.4%
Divorced: 13.2%
Zip code 47360 compared to state average:
Unemployed percentage above state average.
Black race population percentage significantly below state average.
Foreign-born population percentage significantly below state average.
Estimated median house/condo value in 2022: $171,302
47360:
$171,302
Indiana:
$208,700
Median resident age:
This zip code:
41.9 years
Indiana median age:
38.2 years
Average household size:
This zip code:
2.6 people
Indiana:
2.4 people
Averages for the 2020 tax year for zip code 47360, filed in 2021:
Average Adjusted Gross Income (AGI) in 2020: $57,200 (Individual Income Tax Returns)
Here:
$57,200
State:
$64,978
Salary/wage: $49,863 (reported on 77.1% of returns)
Here:
$49,863
State:
$55,245
(% of AGI for various income ranges: 939.4% for AGIs below $25k, 3125.0% for AGIs $25k-50k, 6168.9% for AGIs $50k-75k, 9748.0% for AGIs $75k-100k, 18588.3% for AGIs $100k-200k)
Taxable interest for individuals: $659 (reported on 24.3% of returns)
This zip code:
$659
Indiana:
$1,351
(% of AGI for various income ranges: 15.3% for AGIs below $25k, 5.8% for AGIs $25k-50k, 11.1% for AGIs $50k-75k, 12.0% for AGIs $75k-100k, 105.0% for AGIs $100k-200k)
Ordinary dividends: $1,933 (reported on 12.9% of returns)
Here:
$1,933
State:
$5,827
(% of AGI for various income ranges: 5.9% for AGIs below $25k, 26.7% for AGIs $25k-50k, 23.3% for AGIs $50k-75k, 185.0% for AGIs $100k-200k)
Net capital gain/loss in AGI: +$14,744 (reported on 12.9% of returns)
Here:
+$14,744
State:
+$17,730
(% of AGI for various income ranges: 37.6% for AGIs below $25k, 36.7% for AGIs $50k-75k, 2050.0% for AGIs $100k-200k)
Profit/loss from business: +$9,830 (reported on 14.3% of returns)
Here:
+$9,830
State:
+$12,144
(% of AGI for various income ranges: 131.8% for AGIs below $25k, 233.3% for AGIs $25k-50k, 467.8% for AGIs $50k-75k, 96.7% for AGIs $100k-200k)
Taxable individual retirement arrangement distribution: $13,629 (reported on 10.0% of returns)
47360:
$13,629
Indiana:
$18,302
(% of AGI for various income ranges: 80.0% for AGIs below $25k, 297.5% for AGIs $25k-50k, 922.0% for AGIs $75k-100k)
Earned income credit: $2,336 (reported on 15.7% of returns)
Here:
$2,336
State:
$2,298
(% of AGI for various income ranges: 100.0% for AGIs below $25k, 72.5% for AGIs $25k-50k)
Percentage of individuals using paid preparers for their 2020 taxes: 94.3%
Here:
94%
State:
94%
(% for various income ranges: 95.8% for AGIs below $25k, 93.3% for AGIs $25k-50k, 91.7% for AGIs $50k-75k, 87.5% for AGIs $75k-100k, 100.0% for AGIs $100k-200k)
Averages for the 2012 tax year for zip code 47360, filed in 2013:
Average Adjusted Gross Income (AGI) in 2012: $47,062 (Individual Income Tax Returns)
Here:
$47,062
State:
$52,932
Salary/wage: $38,839 (reported on 82.4% of returns)
Here:
$38,839
State:
$45,173
(% of AGI for various income ranges: 56.0% for AGIs below $25k, 69.8% for AGIs $25k-50k, 74.7% for AGIs $50k-75k, 81.3% for AGIs $75k-100k, 59.2% for AGIs $100k-200k)
Taxable interest for individuals: $591 (reported on 33.8% of returns)
This zip code:
$591
Indiana:
$1,311
(% of AGI for various income ranges: 1.5% for AGIs below $25k, 0.5% for AGIs $25k-50k, 0.2% for AGIs $50k-75k, 0.2% for AGIs $75k-100k, 0.3% for AGIs $100k-200k)
Ordinary dividends: $1,320 (reported on 14.7% of returns)
Here:
$1,320
State:
$4,690
(% of AGI for various income ranges: 0.5% for AGIs below $25k, 0.3% for AGIs $25k-50k, 0.5% for AGIs $50k-75k, 1.1% for AGIs $75k-100k)
Net capital gain/loss in AGI: +$1,088 (reported on 11.8% of returns)
Here:
+$1,088
State:
+$10,406
Profit/loss from business: +$9,260 (reported on 14.7% of returns)
Here:
+$9,260
State:
+$11,105
(% of AGI for various income ranges: 8.9% for AGIs below $25k, 7.1% for AGIs $25k-50k, 3.6% for AGIs $75k-100k)
Taxable individual retirement arrangement distribution: $9,612 (reported on 11.8% of returns)
47360:
$9,612
Indiana:
$13,841
Total itemized deductions: $19,564 (18% of AGI, reported on 16.2% of returns)
Here:
$19,564
State:
$20,913
Here:
18.3% of AGI
State:
18.2% of AGI
(% of AGI for various income ranges: 8.8% for AGIs below $25k, 5.9% for AGIs $50k-75k, 7.0% for AGIs $75k-100k, 10.3% for AGIs $100k-200k)
Charity contributions: $3,338 (reported on 11.8% of returns)
Here:
$3,338
State:
$4,697
Taxes paid: $7,255 (reported on 16.2% of returns)
47360:
$7,255
State:
$7,456
(% of AGI for various income ranges: 2.5% for AGIs $50k-75k, 2.4% for AGIs $75k-100k, 4.8% for AGIs $100k-200k)
Earned income credit: $2,109 (reported on 16.2% of returns)
Here:
$2,109
State:
$2,265
(% of AGI for various income ranges: 4.9% for AGIs below $25k, 1.1% for AGIs $25k-50k)
Percentage of individuals using paid preparers for their 2012 taxes: 61.8%
Here:
62%
State:
53%
(% for various income ranges: 60.7% for AGIs below $25k, 62.5% for AGIs $25k-50k, 63.6% for AGIs $50k-75k, 66.7% for AGIs $75k-100k, 57.1% for AGIs $100k-200k)
Averages for the 2004 tax year for zip code 47360, filed in 2005:
Average Adjusted Gross Income (AGI) in 2004: $42,461 (Individual Income Tax Returns)
Here:
$42,461
State:
$44,790
Salary/wage: $37,573 (reported on 86.4% of returns)
Here:
$37,573
State:
$39,615
(% of AGI for various income ranges: 92.0% for AGIs below $10k, 65.5% for AGIs $10k-25k, 77.3% for AGIs $25k-50k, 85.9% for AGIs $50k-75k, 83.0% for AGIs $75k-100k, 63.9% for AGIs over 100k)
Taxable interest for individuals: $809 (reported on 49.9% of returns)
This zip code:
$809
Indiana:
$1,535
(% of AGI for various income ranges: 6.9% for AGIs below $10k, 3.0% for AGIs $10k-25k, 1.2% for AGIs $25k-50k, 0.6% for AGIs $50k-75k, 0.6% for AGIs $75k-100k, 0.3% for AGIs over 100k)
Taxable dividends: $1,340 (reported on 20.5% of returns)
Here:
$1,340
State:
$2,998
(% of AGI for various income ranges: 1.5% for AGIs below $10k, 0.7% for AGIs $10k-25k, 0.5% for AGIs $25k-50k, 0.6% for AGIs $50k-75k, 0.1% for AGIs $75k-100k, 1.1% for AGIs over 100k)
Net capital gain/loss: +$3,860 (reported on 12.3% of returns)
Here:
+$3,860
State:
+$8,619
(% of AGI for various income ranges: 0.5% for AGIs $10k-25k, -0.0% for AGIs $25k-50k, 0.3% for AGIs $50k-75k, 4.1% for AGIs over 100k)
Profit/loss from business: +$1,843 (reported on 11.8% of returns)
Here:
+$1,843
State:
+$10,071
(% of AGI for various income ranges: -5.7% for AGIs below $10k, 0.1% for AGIs $25k-50k, 2.8% for AGIs $50k-75k, -1.1% for AGIs $75k-100k)
Total itemized deductions: $14,568 (20% of AGI, reported on 27.1% of returns)
Here:
$14,568
State:
$17,065
Here:
20.0% of AGI
State:
19.5% of AGI
(% of AGI for various income ranges: 7.5% for AGIs $10k-25k, 7.7% for AGIs $25k-50k, 9.8% for AGIs $50k-75k, 11.8% for AGIs $75k-100k, 10.1% for AGIs over 100k)
Charity contributions deductions: $2,538 (3% of AGI, reported on 20.7% of returns)
Here:
$2,538
State:
$3,550
Here:
3.3% of AGI
State:
3.8% of AGI
(% of AGI for various income ranges: 1.2% for AGIs $25k-50k, 1.4% for AGIs $50k-75k, 1.1% for AGIs $75k-100k, 1.7% for AGIs over 100k)
Total tax: $5,442 (reported on 75.6% of returns)
47360:
$5,442
State:
$6,914
(% of AGI for various income ranges: 1.9% for AGIs below $10k, 3.1% for AGIs $10k-25k, 5.9% for AGIs $25k-50k, 8.1% for AGIs $50k-75k, 10.6% for AGIs $75k-100k, 17.2% for AGIs over 100k)
Earned income credit: $1,420 (reported on 11.6% of returns)
Here:
$1,420
State:
$1,685
Percentage of individuals using paid preparers for their 2004 taxes: 63.9%
Here:
64%
State:
59%
(% for various income ranges: 63.4% for AGIs below $10k, 67.9% for AGIs $10k-25k, 62.6% for AGIs $25k-50k, 66.2% for AGIs $50k-75k, 45.1% for AGIs $75k-100k, 73.1% for AGIs over 100k)
Household received Food Stamps/SNAP in the past 12 months: 37 Household did not receive Food Stamps/SNAP in the past 12 months: 503
Women who had a birth in the past 12 months: 32 (0 now married, 27 unmarried) Women who did not have a birth in the past 12 months: 285 (134 now married, 150 unmarried)
Housing units in zip code 47360 with a mortgage: 246 (30 second mortgage, 5 home equity loan, 26 both second mortgage and home equity loan) Houses without a mortgage: 13
Median monthly owner costs for units with a mortgage: $1,081 Median monthly owner costs for units without a mortgage: $483
Residents with income below the poverty level in 2022:
This zip code:
7.2%
Whole state:
12.6%
Residents with income below 50% of the poverty level in 2022:
This zip code:
4.9%
Whole state:
6.3%
Median number of rooms in houses and condos:
Here:
6.6
State:
6.6
Median number of rooms in apartments:
Here:
5.9
State:
4.3
Notable locations in this zip code not listed on our city pages
Notable locations in zip code 47360: Pool Hog Farms (A), Blue River Township Fire Department (B), Blue River Township Volunteer Fire Department (C). Display/hide their locations on the map
Size of family households: 184 2-persons, 92 3-persons, 72 4-persons, 39 5-persons, 9 7-or-more-persons
Size of nonfamily households: 112 1-person, 16 2-persons, 16 5-persons
139 married couples with children.
67 single-parent households (24 men, 43 women).
95.8% of residents of 47360 zip code speak English at home.
0.2% of residents speak Spanish at home (100% very well).
4.0% of residents speak other Indo-European language at home (100% very well).
Foreign born population: 0 (0.0%)
:
0.0%
Whole state:
6.1%
25%American
20%English
17%Irish
12%German
2%African
2%Scottish
1%Italian
Year of entry for the foreign-born population
02010 or later
62000 to 2009
01990 to 1999
0Before 1990
Facilities with environmental interests located in this zip code:
MOORELAND MUNICIPAL WWTP (CR 300 N & WILBUR WRIGHT RD in MOORELAND, IN)
STATE MASTER (Indiana facility tracking) - CRTK-2999, EPCRA, IN-NPDES-IN0040398, National Pollutant Discharge Elimination System Permit National Pollutant Discharge Elimination System NON-MAJOR (Tracking pollutant discharge elimination systems) - permit Business SIC classification: SEWERAGE SYSTEMS Organizations: JERRY SHERWOOD CERT OPER (CONTACT/OPERATOR)
, MOORELAND TOWN COUNCIL (CONTACT/OWNER)
Alternative names: JERRY SHERWOOD, MOORELAND MUNICIPAL STP
Housing units lacking complete plumbing facilities: 2.3% Housing units lacking complete kitchen facilities: 3.4%
40.9%Bottled, tank, or LP gas
34.8%Electricity
10.1%Fuel oil, kerosene, etc.
9.7%Wood
3.1%Other fuel
2.1%No fuel used
Population in 1990: 1,265. Population change in the 1990s: +166 (+13.1%).
Place of birth for U.S.-born residents:
This state: 1,162
Northeast: 24
Midwest: 30
South: 134
West: 43
72% of the 47360 zip code residents lived in the same house 5 years ago. Out of people who lived in different houses, 68% lived in this county. Out of people who lived in different counties, 50% lived in Indiana.
94% of the 47360 zip code residents lived in the same house 1 year ago. Out of people who lived in different houses, 21% moved from this county. Out of people who lived in different houses, 84% moved from different county within same state.
Private vs. public school enrollment:
Students in private schools in grades 1 to 8 (elementary and middle school): 13
Here:
9.5%
Indiana:
14.9%
Students in private schools in grades 9 to 12 (high school): 1
Here:
4.0%
Indiana:
11.4%
Students in private undergraduate colleges:
Here:
0.0%
Indiana:
22.3%
Occupation by median earnings in the past 12 months ($)
82,457Health diagnosing and treating practitioners and other technical occupations
54,945Computer and mathematical occupations
52,057Production occupations
47,855Construction and extraction occupations
41,748Material moving occupations
39,396Office and administrative support occupations
Top industries in this zip code by the number of employees in 2005:
Construction: Other Heavy and Civil Engineering Construction (5-9 employees: 1 establishment)
Finance and Insurance: Commercial Banking (5-9: 1)
Construction: Highway, Street, and Bridge Construction (5-9: 1)
Professional, Scientific, and Technical Services: Veterinary Services (5-9: 1)
Other Services (except Public Administration): Religious Organizations (1-4: 2)
Health Care and Social Assistance: Child Day Care Services (1-4: 1)
Construction: Residential Remodelers (1-4: 1)
Construction: Commercial and Institutional Building Construction (1-4: 1)
Fatal accident statistics in 2013:
Fatal accident count: 1
Vehicles involved in fatal accidents: 2
Fatal accidents caused by drunken drivers: 0
Fatalities: 1
Persons involved in fatal accidents: 4
Pedestrians involved in fatal accidents: 0
2002 - 2018 National Fire Incident Reporting System (NFIRS) incidents
According to the data from the years 2002 - 2018 the average number of fires per year is 9. The highest number of fires - 23 took place in 2008, and the least - 0 in 2013. The data has a decreasing trend.
When looking into fire subcategories, the most incidents belonged to: Structure Fires (53.0%), and Outside Fires (34.2%).
Fire incident types reported to NFIRS in Zip Code 47360


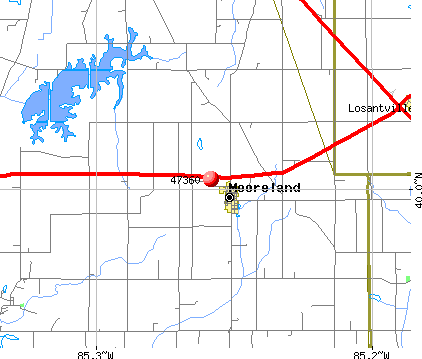 Nearest zip codes: 47354, 47346, 47361, 47383, 47386, 47362.


 According to the data from the years 2002 - 2018 the average number of fires per year is 9. The highest number of fires - 23 took place in 2008, and the least - 0 in 2013. The data has a decreasing trend.
 When looking into fire subcategories, the most incidents belonged to: Structure Fires (53.0%), and Outside Fires (34.2%).