Estimated zip code population in 2022: 1,486 Zip code population in 2010: 2,004 Zip code population in 2000: 2,193
Houses and condos: 707 Renter-occupied apartments: 92
% of renters here:
14%
State:
29%
March 2022 cost of living index in zip code 47380: 83.7 (less than average, U.S. average is 100)
Land area: 60.9 sq. mi. Water area: 0.3 sq. mi.
Population density: 24 people per square mile
(very low).
OSM Map
General Map
Google Map
MSN Map
OSM Map
General Map
Google Map
MSN Map
OSM Map
General Map
Google Map
MSN Map
OSM Map
General Map
Google Map
MSN Map
Please wait while loading the map...
Real estate property taxes paid for housing units in 2022:
This zip code:
0.9% ($817)
Indiana:
0.7% ($1,467)
Median real estate property taxes paid for housing units with mortgages in 2022: $665 (0.6%) Median real estate property taxes paid for housing units with no mortgage in 2022: $1,127 (1.5%)
Business Search- 14 Million verified businesses
Males: 811
(54.6%)
Females: 675
(45.4%)
For population 25 years and over in 47380:
High school or higher: 84.7%
Bachelor's degree or higher: 10.1%
Graduate or professional degree: 1.4%
Unemployed: 2.0%
Mean travel time to work (commute): 25.5 minutes
For population 15 years and over in 47380:
Never married: 27.7%
Now married: 50.0%
Separated: 0.9%
Widowed: 4.8%
Divorced: 16.5%
Zip code 47380 compared to state average:
Median house value below state average.
Unemployed percentage below state average.
Black race population percentage significantly below state average.
Hispanic race population percentage below state average.
Median age significantly above state average.
Renting percentage below state average.
Length of stay since moving in significantly above state average.
House age above state average.
Percentage of population with a bachelor's degree or higher significantly below state average.
Estimated median house/condo value in 2022: $95,029
47380:
$95,029
Indiana:
$208,700
According to our research of Indiana and other state lists, there was 1 registered sex offender living in 47380 zip code as of May 28, 2024. The ratio of all residents to sex offenders in zip code 47380 is 1,797 to 1. The ratio of registered sex offenders to all residents in this zip code is much lower than the state average.
Median resident age:
This zip code:
46.6 years
Indiana median age:
38.2 years
Average household size:
This zip code:
2.3 people
Indiana:
2.4 people
Averages for the 2020 tax year for zip code 47380, filed in 2021:
Average Adjusted Gross Income (AGI) in 2020: $46,553 (Individual Income Tax Returns)
Here:
$46,553
State:
$64,978
Salary/wage: $41,468 (reported on 79.8% of returns)
Here:
$41,468
State:
$55,245
(% of AGI for various income ranges: 1124.5% for AGIs below $25k, 3440.0% for AGIs $25k-50k, 6564.0% for AGIs $50k-75k, 11066.0% for AGIs $75k-100k, 19977.5% for AGIs $100k-200k)
Taxable interest for individuals: $537 (reported on 21.3% of returns)
This zip code:
$537
Indiana:
$1,351
(% of AGI for various income ranges: 8.2% for AGIs below $25k, 13.5% for AGIs $25k-50k, 14.0% for AGIs $50k-75k, 58.0% for AGIs $75k-100k, 35.0% for AGIs $100k-200k)
Ordinary dividends: $1,817 (reported on 13.5% of returns)
Here:
$1,817
State:
$5,827
(% of AGI for various income ranges: 6.4% for AGIs below $25k, 15.5% for AGIs $25k-50k, 97.0% for AGIs $50k-75k, 190.0% for AGIs $100k-200k)
Net capital gain/loss in AGI: +$7,230 (reported on 11.2% of returns)
Here:
+$7,230
State:
+$17,730
(% of AGI for various income ranges: 5.5% for AGIs below $25k, 25.5% for AGIs $25k-50k, 71.0% for AGIs $50k-75k, 1472.5% for AGIs $100k-200k)
Profit/loss from business: +$6,392 (reported on 13.5% of returns)
Here:
+$6,392
State:
+$12,144
(% of AGI for various income ranges: 142.3% for AGIs below $25k, 126.5% for AGIs $25k-50k, 220.0% for AGIs $50k-75k)
Taxable individual retirement arrangement distribution: $9,662 (reported on 9.0% of returns)
47380:
$9,662
Indiana:
$18,302
(% of AGI for various income ranges: 57.7% for AGIs below $25k, 169.0% for AGIs $25k-50k, 616.0% for AGIs $75k-100k)
Earned income credit: $2,413 (reported on 16.9% of returns)
Here:
$2,413
State:
$2,298
(% of AGI for various income ranges: 95.9% for AGIs below $25k, 75.5% for AGIs $25k-50k)
Percentage of individuals using paid preparers for their 2020 taxes: 96.6%
Here:
97%
State:
94%
(% for various income ranges: 93.9% for AGIs below $25k, 96.0% for AGIs $25k-50k, 100.0% for AGIs $50k-75k, 100.0% for AGIs $75k-100k, 100.0% for AGIs $100k-200k)
Averages for the 2012 tax year for zip code 47380, filed in 2013:
Average Adjusted Gross Income (AGI) in 2012: $38,037 (Individual Income Tax Returns)
Here:
$38,037
State:
$52,932
Salary/wage: $34,351 (reported on 81.1% of returns)
Here:
$34,351
State:
$45,173
(% of AGI for various income ranges: 74.2% for AGIs below $25k, 76.5% for AGIs $25k-50k, 83.3% for AGIs $50k-75k, 79.1% for AGIs $75k-100k, 48.3% for AGIs $100k-200k)
Taxable interest for individuals: $679 (reported on 26.7% of returns)
This zip code:
$679
Indiana:
$1,311
(% of AGI for various income ranges: 1.4% for AGIs below $25k, 0.5% for AGIs $25k-50k, 0.2% for AGIs $50k-75k, 0.3% for AGIs $75k-100k, 0.1% for AGIs $100k-200k)
Ordinary dividends: $789 (reported on 10.0% of returns)
Here:
$789
State:
$4,690
(% of AGI for various income ranges: 0.2% for AGIs below $25k, 0.4% for AGIs $25k-50k, 0.4% for AGIs $75k-100k)
Net capital gain/loss in AGI: +$943 (reported on 7.8% of returns)
Here:
+$943
State:
+$10,406
Profit/loss from business: +$7,292 (reported on 13.3% of returns)
Here:
+$7,292
State:
+$11,105
(% of AGI for various income ranges: 6.3% for AGIs below $25k, 4.7% for AGIs $25k-50k, 1.6% for AGIs $50k-75k)
Taxable individual retirement arrangement distribution: $10,612 (reported on 8.9% of returns)
47380:
$10,612
Indiana:
$13,841
Total itemized deductions: $17,700 (22% of AGI, reported on 11.1% of returns)
Here:
$17,700
State:
$20,913
Here:
22.5% of AGI
State:
18.2% of AGI
(% of AGI for various income ranges: 5.5% for AGIs $25k-50k, 9.0% for AGIs $50k-75k, 9.1% for AGIs $100k-200k)
Charity contributions: $3,317 (reported on 6.7% of returns)
Here:
$3,317
State:
$4,697
(% of AGI for various income ranges: 1.0% for AGIs below $25k, 1.0% for AGIs $50k-75k, 1.2% for AGIs $75k-100k)
Taxes paid: $5,050 (reported on 11.1% of returns)
47380:
$5,050
State:
$7,456
(% of AGI for various income ranges: 0.8% for AGIs $25k-50k, 2.6% for AGIs $50k-75k, 3.7% for AGIs $100k-200k)
Earned income credit: $2,364 (reported on 24.4% of returns)
Here:
$2,364
State:
$2,265
(% of AGI for various income ranges: 7.7% for AGIs below $25k, 1.4% for AGIs $25k-50k)
Percentage of individuals using paid preparers for their 2012 taxes: 62.2%
Here:
62%
State:
53%
(% for various income ranges: 57.5% for AGIs below $25k, 61.5% for AGIs $25k-50k, 69.2% for AGIs $50k-75k, 71.4% for AGIs $75k-100k, 75.0% for AGIs $100k-200k)
Averages for the 2004 tax year for zip code 47380, filed in 2005:
Average Adjusted Gross Income (AGI) in 2004: $32,584 (Individual Income Tax Returns)
Here:
$32,584
State:
$44,790
Salary/wage: $31,649 (reported on 84.6% of returns)
Here:
$31,649
State:
$39,615
(% of AGI for various income ranges: 89.5% for AGIs below $10k, 71.7% for AGIs $10k-25k, 86.7% for AGIs $25k-50k, 88.9% for AGIs $50k-75k, 81.5% for AGIs $75k-100k, 58.3% for AGIs over 100k)
Taxable interest for individuals: $756 (reported on 39.2% of returns)
This zip code:
$756
Indiana:
$1,535
(% of AGI for various income ranges: 7.5% for AGIs below $10k, 2.1% for AGIs $10k-25k, 0.8% for AGIs $25k-50k, 0.3% for AGIs $50k-75k, 0.2% for AGIs $75k-100k, 0.5% for AGIs over 100k)
Taxable dividends: $689 (reported on 16.1% of returns)
Here:
$689
State:
$2,998
(% of AGI for various income ranges: 2.4% for AGIs below $10k, 0.8% for AGIs $10k-25k, 0.2% for AGIs $25k-50k, 0.3% for AGIs $50k-75k, 0.2% for AGIs $75k-100k)
Net capital gain/loss: +$44 (reported on 9.8% of returns)
Here:
+$44
State:
+$8,619
(% of AGI for various income ranges: 1.0% for AGIs below $10k, -0.1% for AGIs $10k-25k, -0.2% for AGIs $25k-50k, 0.1% for AGIs $50k-75k, 0.3% for AGIs $75k-100k)
Profit/loss from business: +$4,715 (reported on 18.0% of returns)
Here:
+$4,715
State:
+$10,071
(% of AGI for various income ranges: -1.0% for AGIs below $10k, 5.0% for AGIs $10k-25k, 3.8% for AGIs $25k-50k, 1.4% for AGIs $50k-75k, 1.9% for AGIs $75k-100k)
IRA payment deduction: $2,267 (reported on 1.6% of returns)
47380:
$2,267
Indiana:
$2,840
Total itemized deductions: $12,823 (23% of AGI, reported on 13.5% of returns)
Here:
$12,823
State:
$17,065
Here:
22.6% of AGI
State:
19.5% of AGI
(% of AGI for various income ranges: 5.8% for AGIs $10k-25k, 3.7% for AGIs $25k-50k, 5.6% for AGIs $50k-75k, 8.0% for AGIs $75k-100k, 6.9% for AGIs over 100k)
Charity contributions deductions: $1,890 (3% of AGI, reported on 8.0% of returns)
Here:
$1,890
State:
$3,550
Here:
3.3% of AGI
State:
3.8% of AGI
(% of AGI for various income ranges: 0.3% for AGIs $10k-25k, 0.2% for AGIs $25k-50k, 0.8% for AGIs $50k-75k, 1.0% for AGIs $75k-100k)
Total tax: $3,674 (reported on 71.8% of returns)
47380:
$3,674
State:
$6,914
(% of AGI for various income ranges: 2.9% for AGIs below $10k, 3.9% for AGIs $10k-25k, 6.5% for AGIs $25k-50k, 8.7% for AGIs $50k-75k, 11.1% for AGIs $75k-100k, 16.0% for AGIs over 100k)
Earned income credit: $1,749 (reported on 19.1% of returns)
Here:
$1,749
State:
$1,685
Percentage of individuals using paid preparers for their 2004 taxes: 66.7%
Here:
67%
State:
59%
(% for various income ranges: 59.7% for AGIs below $10k, 62.8% for AGIs $10k-25k, 66.4% for AGIs $25k-50k, 77.3% for AGIs $50k-75k, 80.4% for AGIs $75k-100k, 82.4% for AGIs over 100k)
Household received Food Stamps/SNAP in the past 12 months: 83 Household did not receive Food Stamps/SNAP in the past 12 months: 565
Women who had a birth in the past 12 months: 11 (9 now married, 2 unmarried) Women who did not have a birth in the past 12 months: 299 (99 now married, 199 unmarried)
Housing units in zip code 47380 with a mortgage: 266 (22 second mortgage, 18 both second mortgage and home equity loan) Houses without a mortgage: 8
Median monthly owner costs for units with a mortgage: $840 Median monthly owner costs for units without a mortgage: $419
Residents with income below the poverty level in 2022:
This zip code:
11.0%
Whole state:
12.6%
Residents with income below 50% of the poverty level in 2022:
This zip code:
4.8%
Whole state:
6.3%
Median number of rooms in houses and condos:
Here:
7.0
State:
6.6
Median number of rooms in apartments:
Here:
4.3
State:
4.3
Notable locations in this zip code not listed on our city pages
Notable locations in zip code 47380: Flesher Farms (A), Woodbury Farms (B), Edwards Farms (C), Smithson Farms (D), Deer Ridge Farm (E), Ridgeville Elevator (F), Flyin S Ranch (G), Ridgeville Fire Department (H). Display/hide their locations on the map
Cemeteries: Weimer Cemetery (1), Veterans Cemetery (2), Reitenour Cemetery (3), Riverside Cemetery (4), Lawn Dale Cemetery (5), Cherry Grove Cemetery (6), Odd Fellows Cemetery (7). Display/hide their locations on the map
Streams, rivers, and creeks: Potent Run (A), Polar Run (B), Carder Creek (C), Tough Run (D), Ridge Run (E), Virile Run (F), Ville Run (G), Great Run (H), Goshen Creek (I). Display/hide their locations on the map
Size of family households: 275 2-persons, 84 3-persons, 37 4-persons, 31 5-persons, 2 6-persons, 10 7-or-more-persons
Size of nonfamily households: 136 1-person, 57 2-persons, 13 3-persons
162 married couples with children.
79 single-parent households (37 men, 42 women).
94.2% of residents of 47380 zip code speak English at home.
3.5% of residents speak Spanish at home (25% well, 75% not well).
2.3% of residents speak other Indo-European language at home (76% very well, 24% well).
Foreign born population: 74 (5.0%) (4.6% of them are naturalized citizens)
This zip code:
5.0%
Whole state:
6.1%
65%Honduras
32%Norway
13%El Salvador
3%Bosnia and Herzegovina
29%German
17%American
13%Irish
11%English
3%European
3%Italian
2%Portuguese
Year of entry for the foreign-born population
682010 or later
322000 to 2009
21990 to 1999
0Before 1990
Facilities with environmental interests located in this zip code:
MESHBERGER BROTHERS STONE CORP (1972 W SR 28 in RIDGEVILLE, IN)
AIR MINOR (AIRS/AFS) AIR SYNTHETIC MINOR (AIRS/AFS) STATE MASTER (Indiana facility tracking) - ACES-OP-13500001, AIR PROGRAM, ACES-OP-13503158, CRTK-9679, EPCRA, UST-9862, UNDERGROUND STORAGE TANK PROGRAM National Pollutant Discharge Elimination System NON-MAJOR (Tracking pollutant discharge elimination systems) - permit Business SIC classification: CRUSHED AND BROKEN LIMESTONE; ASPHALT PAVING MIXTURES AND BLOCKS Organizations: RONAD FRYBACK (CONTACT/OPERATOR)
, MESHBERGER BROS STONE (CONTACT/OWNER)
Alternative names: MESHBERGER BROS. STONE, RIDGEV
COX MANUFACTURING CO INC (108 W SECOND ST in RIDGEVILLE, IN)
STATE MASTER (Indiana facility tracking) - SPILL-198902078, RELEASE ASSESSMENT (Resource Conservation and Recovery Act (tracking hazardous waste)) Organizations: MESTEK INC (CONTACT/OWNER)
Alternative names: COX HEATING-A MESTEK CO
DEERFIELD ELEMENTARY SCHOOL (213 W SR 28 in RIDGEVILLE, IN)
(Geographic Names Information System) (National Center for Education Statistics) - STATE ID-7146 Organizations: RANDOLPH CENTRAL SCHOOL CORP (SCHOOL DISTRICT)
RIDGEVILLE MUNICIPAL WWTP (MAIN ST E & SHERIDAN in RIDGEVILLE, IN)
STATE MASTER (Indiana facility tracking) National Pollutant Discharge Elimination System NON-MAJOR (Tracking pollutant discharge elimination systems) - permit Business SIC classification: SEWERAGE SYSTEMS Organizations: MARK RAMSEY (CONTACT/OPERATOR)
, TOWN COUNCIL PRESIDENT (CONTACT/OWNER)
Alternative names: RIDGEVILLE MUNICIPAL STP
CHAMPION HOME BUILDERS COMPANY (700 N. PORTLAND RD. in RIDGEVILLE, IN)
STATE MASTER (Indiana facility tracking) CRITERIA AND HAZARDOUS AIR POLLUTANT INVENTORY (Inventory of air pollution sources) TRI REPORTER (Tracking of toxic chemicals releasing facilities) Business SIC classification: MOBILE HOMES Business NAICS classification: MANUFACTURED HOME (MOBILE HOME) MANUFACTURING.
Housing units lacking complete plumbing facilities: 6.1% Housing units lacking complete kitchen facilities: 4.4%
41.5%Utility gas
26.6%Bottled, tank, or LP gas
16.7%Electricity
14.5%Wood
0.8%Other fuel
Population in 1990: 1,343. Population change in the 1990s: +850 (+63.3%).
Place of birth for U.S.-born residents:
This state: 1,179
Northeast: 27
Midwest: 103
South: 43
West: 33
66% of the 47380 zip code residents lived in the same house 5 years ago. Out of people who lived in different houses, 51% lived in this county. Out of people who lived in different counties, 50% lived in Indiana.
96% of the 47380 zip code residents lived in the same house 1 year ago. Out of people who lived in different houses, 70% moved from this county. Out of people who lived in different houses, 9% moved from different county within same state. Out of people who lived in different houses, 20% moved from different state. Out of people who lived in different houses, 9% moved from abroad.
Private vs. public school enrollment:
Students in private schools in grades 1 to 8 (elementary and middle school): 20
Here:
19.2%
Indiana:
14.9%
Students in private schools in grades 9 to 12 (high school): 11
Here:
7.4%
Indiana:
11.4%
Students in private undergraduate colleges: 15
Here:
21.3%
Indiana:
22.3%
Occupation by median earnings in the past 12 months ($)
83,559Management occupations
54,483Installation, maintenance, and repair occupations
53,416Health diagnosing and treating practitioners and other technical occupations
51,645Community and social service occupations
43,591Construction and extraction occupations
41,080Material moving occupations
Top industries in this zip code by the number of employees in 2005:
Mining: Crushed and Broken Limestone Mining and Quarrying (10-19 employees: 1 establishment)
Construction: Siding Contractors (10-19: 1)
Wholesale Trade: Wholesale Trade Agents and Brokers (10-19: 1)
Other Services (except Public Administration): Civic and Social Organizations (5-9: 1)
Construction: Residential Remodelers (1-4: 1)
Fatal accident statistics in 2014:
Fatal accident count: 1
Vehicles involved in fatal accidents: 2
Fatal accidents caused by drunken drivers: 1
Fatalities: 1
Persons involved in fatal accidents: 2
Pedestrians involved in fatal accidents: 0
Fatal accident statistics in 2012:
Fatal accident count: 1
Vehicles involved in fatal accidents: 2
Fatal accidents caused by drunken drivers: 0
Fatalities: 1
Persons involved in fatal accidents: 2
Pedestrians involved in fatal accidents: 0
2003 - 2018 National Fire Incident Reporting System (NFIRS) incidents
Based on the data from the years 2003 - 2018 the average number of fires per year is 12. The highest number of fires - 30 took place in 2011, and the least - 2 in 2003. The data has an increasing trend.
When looking into fire subcategories, the most incidents belonged to: Structure Fires (56.5%), and Outside Fires (33.7%).
Fire incident types reported to NFIRS in Zip Code 47380


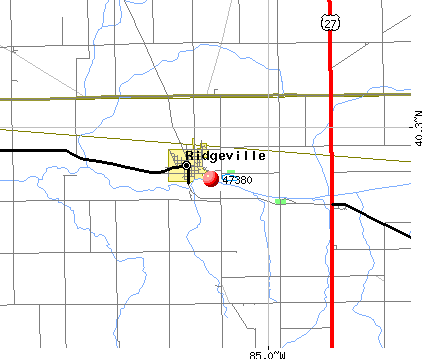 Nearest zip codes: 47382, 47394, 47373, 47340, 47371, 47381.


 Based on the data from the years 2003 - 2018 the average number of fires per year is 12. The highest number of fires - 30 took place in 2011, and the least - 2 in 2003. The data has an increasing trend.
 When looking into fire subcategories, the most incidents belonged to: Structure Fires (56.5%), and Outside Fires (33.7%).