Estimated zip code population in 2022: 1,829 Zip code population in 2010: 1,612 Zip code population in 2000: 1,593
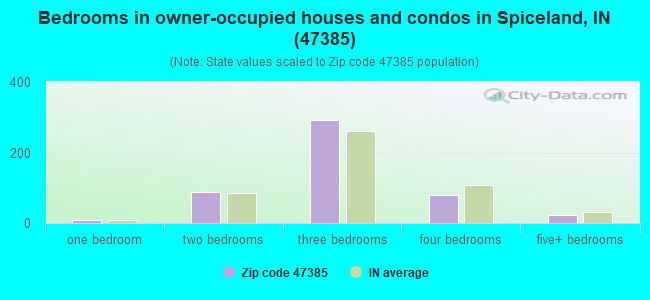
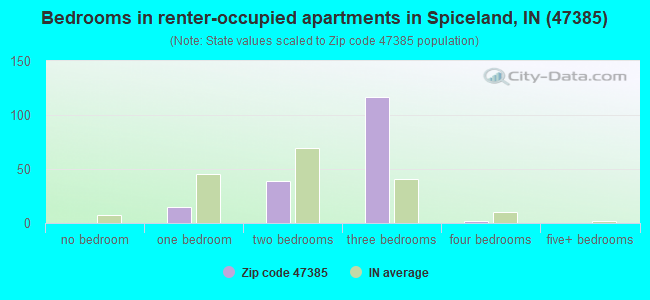
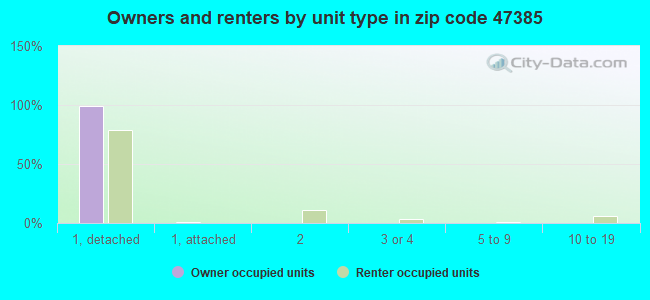
Houses and condos: 773 Renter-occupied apartments: 175
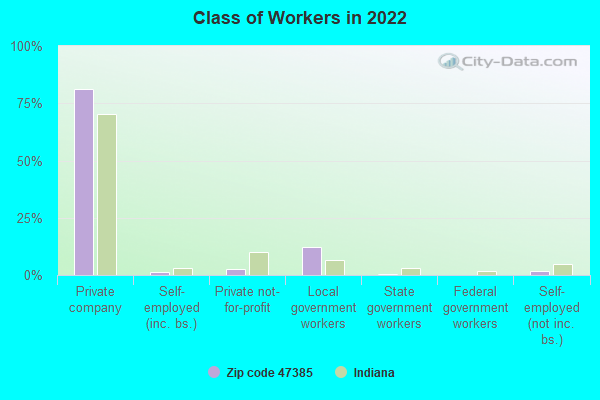
% of renters here:
24%
State:
29%
March 2022 cost of living index in zip code 47385: 83.8 (less than average, U.S. average is 100)
Land area: 14.9 sq. mi. Water area: 0.0 sq. mi.
Population density: 123 people per square mile
(very low).
OSM Map
General Map
Google Map
MSN Map
OSM Map
General Map
Google Map
MSN Map
OSM Map
General Map
Google Map
MSN Map
OSM Map
General Map
Google Map
MSN Map
Please wait while loading the map...
Real estate property taxes paid for housing units in 2022:
This zip code:
0.7% ($914)
Indiana:
0.7% ($1,467)
Median real estate property taxes paid for housing units with mortgages in 2022: $956 (0.7%) Median real estate property taxes paid for housing units with no mortgage in 2022: $799 (0.7%)
Business Search- 14 Million verified businesses
Males: 925
(50.6%)
Females: 903
(49.4%)
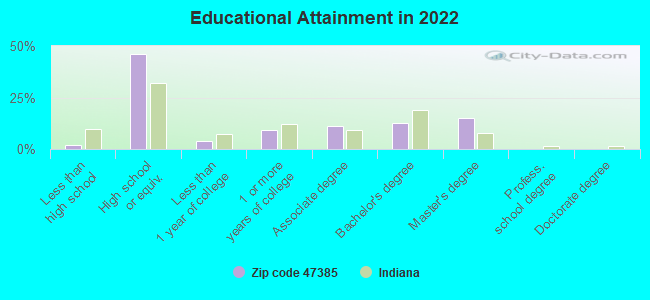
For population 25 years and over in 47385:
High school or higher: 97.2%
Bachelor's degree or higher: 27.5%
Graduate or professional degree: 15.0%
Unemployed: 1.4%
Mean travel time to work (commute): 26.6 minutes
For population 15 years and over in 47385:
Never married: 23.2%
Now married: 62.3%
Separated: 0.5%
Widowed: 6.9%
Divorced: 7.0%
Zip code 47385 compared to state average:
Median house value below state average.
Unemployed percentage below state average.
Black race population percentage significantly below state average.
Hispanic race population percentage significantly below state average.
Foreign-born population percentage significantly below state average.
Length of stay since moving in significantly above state average.
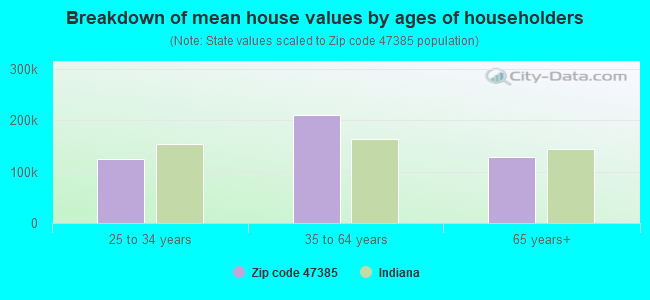
Estimated median house/condo value in 2022: $135,723
47385:
$135,723
Indiana:
$208,700
Median resident age:
This zip code:
36.8 years
Indiana median age:
38.2 years
Average household size:
This zip code:
2.5 people
Indiana:
2.4 people
Averages for the 2020 tax year for zip code 47385, filed in 2021:
Average Adjusted Gross Income (AGI) in 2020: $54,280 (Individual Income Tax Returns)
Here:
$54,280
State:
$64,978
Salary/wage: $49,761 (reported on 77.5% of returns)
Here:
$49,761
State:
$55,245
(% of AGI for various income ranges: 880.5% for AGIs below $25k, 3300.0% for AGIs $25k-50k, 5627.8% for AGIs $50k-75k, 8995.7% for AGIs $75k-100k, 16967.1% for AGIs $100k-200k)
Taxable interest for individuals: $500 (reported on 21.2% of returns)
This zip code:
$500
Indiana:
$1,351
(% of AGI for various income ranges: 8.9% for AGIs below $25k, 6.1% for AGIs $25k-50k, 53.3% for AGIs $50k-75k, 12.9% for AGIs $100k-200k)
Ordinary dividends: $1,138 (reported on 16.2% of returns)
Here:
$1,138
State:
$5,827
(% of AGI for various income ranges: 13.7% for AGIs below $25k, 22.8% for AGIs $25k-50k, 34.4% for AGIs $50k-75k, 71.4% for AGIs $75k-100k)
Net capital gain/loss in AGI: +$8,027 (reported on 13.8% of returns)
Here:
+$8,027
State:
+$17,730
(% of AGI for various income ranges: 26.8% for AGIs below $25k, 8.9% for AGIs $25k-50k, 98.9% for AGIs $50k-75k, 1038.6% for AGIs $100k-200k)
Profit/loss from business: +$6,538 (reported on 10.0% of returns)
Here:
+$6,538
State:
+$12,144
(% of AGI for various income ranges: 163.2% for AGIs below $25k, 28.9% for AGIs $50k-75k, 267.1% for AGIs $100k-200k)
Taxable individual retirement arrangement distribution: $11,988 (reported on 10.0% of returns)
47385:
$11,988
Indiana:
$18,302
(% of AGI for various income ranges: 70.0% for AGIs below $25k, 135.6% for AGIs $25k-50k, 646.7% for AGIs $50k-75k)
Earned income credit: $2,378 (reported on 11.2% of returns)
Here:
$2,378
State:
$2,298
(% of AGI for various income ranges: 48.4% for AGIs below $25k, 67.8% for AGIs $25k-50k)
Percentage of individuals using paid preparers for their 2020 taxes: 95.0%
Here:
95%
State:
94%
(% for various income ranges: 92.3% for AGIs below $25k, 95.5% for AGIs $25k-50k, 100.0% for AGIs $50k-75k, 100.0% for AGIs $75k-100k, 91.7% for AGIs $100k-200k)
Averages for the 2012 tax year for zip code 47385, filed in 2013:
Average Adjusted Gross Income (AGI) in 2012: $42,589 (Individual Income Tax Returns)
Here:
$42,589
State:
$52,932
Salary/wage: $39,836 (reported on 79.7% of returns)
Here:
$39,836
State:
$45,173
(% of AGI for various income ranges: 54.7% for AGIs below $25k, 73.0% for AGIs $25k-50k, 77.8% for AGIs $50k-75k, 75.4% for AGIs $75k-100k, 82.6% for AGIs $100k-200k)
Taxable interest for individuals: $777 (reported on 35.1% of returns)
This zip code:
$777
Indiana:
$1,311
(% of AGI for various income ranges: 1.7% for AGIs below $25k, 0.8% for AGIs $25k-50k, 0.5% for AGIs $50k-75k, 0.4% for AGIs $75k-100k, 0.4% for AGIs $100k-200k)
Ordinary dividends: $1,975 (reported on 16.2% of returns)
Here:
$1,975
State:
$4,690
(% of AGI for various income ranges: 0.8% for AGIs below $25k, 1.3% for AGIs $25k-50k, 1.6% for AGIs $75k-100k)
Net capital gain/loss in AGI: +$271 (reported on 9.5% of returns)
Here:
+$271
State:
+$10,406
Profit/loss from business: +$3,312 (reported on 10.8% of returns)
Here:
+$3,312
State:
+$11,105
(% of AGI for various income ranges: 4.2% for AGIs below $25k, 0.8% for AGIs $25k-50k, 0.8% for AGIs $50k-75k)
Taxable individual retirement arrangement distribution: $10,400 (reported on 9.5% of returns)
47385:
$10,400
Indiana:
$13,841
(% of AGI for various income ranges: 3.1% for AGIs below $25k, 2.5% for AGIs $25k-50k, 5.4% for AGIs $50k-75k)
Total itemized deductions: $15,885 (24% of AGI, reported on 17.6% of returns)
Here:
$15,885
State:
$20,913
Here:
24.1% of AGI
State:
18.2% of AGI
(% of AGI for various income ranges: 7.5% for AGIs $25k-50k, 6.8% for AGIs $50k-75k, 6.1% for AGIs $75k-100k, 9.4% for AGIs $100k-200k)
Charity contributions: $3,644 (reported on 12.2% of returns)
Here:
$3,644
State:
$4,697
(% of AGI for various income ranges: 2.7% for AGIs below $25k, 1.1% for AGIs $50k-75k, 2.1% for AGIs $75k-100k)
Taxes paid: $4,177 (reported on 17.6% of returns)
47385:
$4,177
State:
$7,456
(% of AGI for various income ranges: 1.2% for AGIs $25k-50k, 1.8% for AGIs $50k-75k, 1.7% for AGIs $75k-100k, 3.4% for AGIs $100k-200k)
Earned income credit: $2,356 (reported on 12.2% of returns)
Here:
$2,356
State:
$2,265
(% of AGI for various income ranges: 4.4% for AGIs below $25k, 0.9% for AGIs $25k-50k)
Percentage of individuals using paid preparers for their 2012 taxes: 63.5%
Here:
64%
State:
53%
(% for various income ranges: 59.3% for AGIs below $25k, 60.0% for AGIs $25k-50k, 69.2% for AGIs $50k-75k, 66.7% for AGIs $75k-100k, 80.0% for AGIs $100k-200k)
Averages for the 2004 tax year for zip code 47385, filed in 2005:
Average Adjusted Gross Income (AGI) in 2004: $42,336 (Individual Income Tax Returns)
Here:
$42,336
State:
$44,790
Salary/wage: $38,741 (reported on 87.6% of returns)
Here:
$38,741
State:
$39,615
(% of AGI for various income ranges: 64.3% for AGIs below $10k, 60.3% for AGIs $10k-25k, 77.6% for AGIs $25k-50k, 82.0% for AGIs $50k-75k, 85.5% for AGIs $75k-100k, 87.1% for AGIs over 100k)
Taxable interest for individuals: $707 (reported on 54.5% of returns)
This zip code:
$707
Indiana:
$1,535
(% of AGI for various income ranges: 4.2% for AGIs below $10k, 4.2% for AGIs $10k-25k, 0.6% for AGIs $25k-50k, 0.6% for AGIs $50k-75k, 0.5% for AGIs $75k-100k, 0.3% for AGIs over 100k)
Taxable dividends: $874 (reported on 15.3% of returns)
Here:
$874
State:
$2,998
(% of AGI for various income ranges: 0.3% for AGIs below $10k, 1.2% for AGIs $10k-25k, 0.2% for AGIs $25k-50k, 0.2% for AGIs $50k-75k, 0.4% for AGIs $75k-100k, 0.1% for AGIs over 100k)
Net capital gain/loss: +$904 (reported on 10.1% of returns)
Here:
+$904
State:
+$8,619
(% of AGI for various income ranges: 0.4% for AGIs $10k-25k, 0.5% for AGIs $25k-50k, 0.0% for AGIs $50k-75k, 0.3% for AGIs $75k-100k)
Profit/loss from business: +$4,398 (reported on 12.1% of returns)
Here:
+$4,398
State:
+$10,071
(% of AGI for various income ranges: 2.7% for AGIs below $10k, 3.9% for AGIs $10k-25k, 3.1% for AGIs $25k-50k, 0.2% for AGIs $50k-75k)
Total itemized deductions: $13,313 (20% of AGI, reported on 25.1% of returns)
Here:
$13,313
State:
$17,065
Here:
20.1% of AGI
State:
19.5% of AGI
(% of AGI for various income ranges: 7.9% for AGIs $10k-25k, 6.1% for AGIs $25k-50k, 8.7% for AGIs $50k-75k, 11.0% for AGIs $75k-100k, 7.2% for AGIs over 100k)
Charity contributions deductions: $2,450 (4% of AGI, reported on 16.5% of returns)
Here:
$2,450
State:
$3,550
Here:
3.5% of AGI
State:
3.8% of AGI
(% of AGI for various income ranges: 2.4% for AGIs below $10k, 0.7% for AGIs $25k-50k, 0.9% for AGIs $50k-75k, 2.0% for AGIs $75k-100k, 0.8% for AGIs over 100k)
Total tax: $4,696 (reported on 82.1% of returns)
47385:
$4,696
State:
$6,914
(% of AGI for various income ranges: 1.5% for AGIs below $10k, 4.0% for AGIs $10k-25k, 6.9% for AGIs $25k-50k, 8.3% for AGIs $50k-75k, 10.2% for AGIs $75k-100k, 15.3% for AGIs over 100k)
Earned income credit: $1,354 (reported on 10.9% of returns)
Here:
$1,354
State:
$1,685
Percentage of individuals using paid preparers for their 2004 taxes: 66.8%
Here:
67%
State:
59%
(% for various income ranges: 62.4% for AGIs below $10k, 60.9% for AGIs $10k-25k, 72.6% for AGIs $25k-50k, 66.7% for AGIs $50k-75k, 65.6% for AGIs $75k-100k, 72.9% for AGIs over 100k)
Household received Food Stamps/SNAP in the past 12 months: 65 Household did not receive Food Stamps/SNAP in the past 12 months: 662
Women who had a birth in the past 12 months: 23 (25 now married, 0 unmarried) Women who did not have a birth in the past 12 months: 331 (225 now married, 107 unmarried)
Housing units in zip code 47385 with a mortgage: 404 (21 second mortgage, 9 both second mortgage and home equity loan) Median monthly owner costs for units with a mortgage: $1,041 Median monthly owner costs for units without a mortgage: $390
Residents with income below the poverty level in 2022:
This zip code:
13.3%
Whole state:
12.6%
Residents with income below 50% of the poverty level in 2022:
This zip code:
7.4%
Whole state:
6.3%
Median number of rooms in houses and condos:
Here:
6.8
State:
6.6
Median number of rooms in apartments:
Here:
5.8
State:
4.3
Notable locations in this zip code not listed on our city pages
Size of family households: 198 2-persons, 45 3-persons, 199 4-persons, 72 5-persons
Size of nonfamily households: 174 1-person, 15 2-persons, 13 4-persons
411 married couples with children.
21 single-parent households (2 men, 19 women).
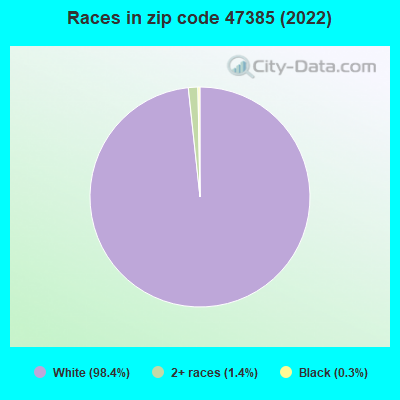
98.4% of residents of 47385 zip code speak English at home.
0.3% of residents speak Spanish at home (100% very well).
Foreign born population: 1 (0.1%) (0.0% of them are naturalized citizens)
:
0.1%
Whole state:
6.1%
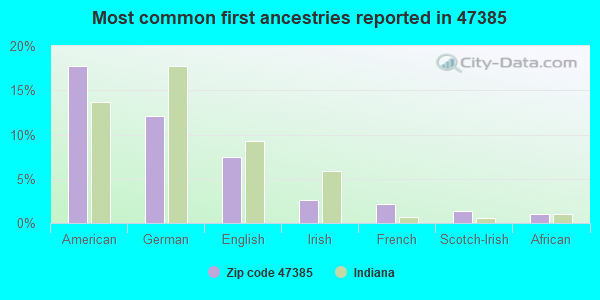
18%American
12%German
7%English
3%Irish
2%French
1%Scotch-Irish
1%African
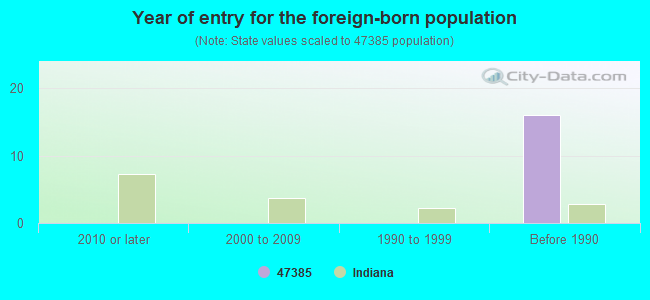
Year of entry for the foreign-born population
02010 or later
02000 to 2009
01990 to 1999
22Before 1990
Facilities with environmental interests located in this zip code:
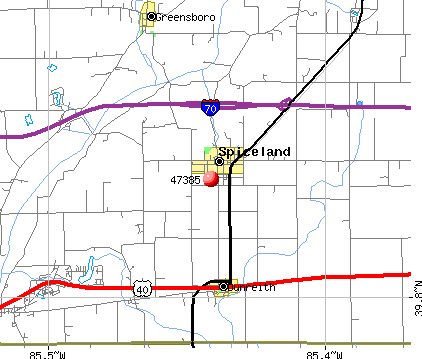
DRAPER SHAD & SCREEN (411 S PEARL ST in SPICELAND, IN)
AIR SYNTHETIC MINOR (AIRS/AFS) STATE MASTER (Indiana facility tracking) - ACES-OP-06500029, AIR PROGRAM Business SIC classification: DRAPERY HARDWARE AND WINDOW BLINDS AND SHADES
Housing units lacking complete plumbing facilities: 2.6% Housing units lacking complete kitchen facilities: 6.3%
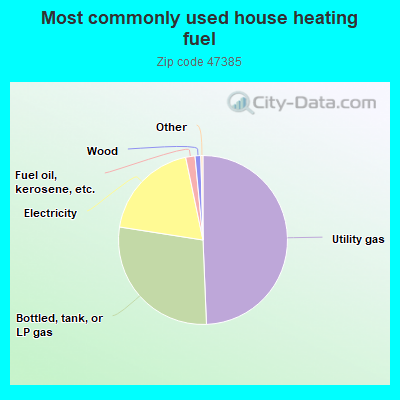
49.5%Utility gas
28.2%Bottled, tank, or LP gas
19.3%Electricity
1.8%Fuel oil, kerosene, etc.
1.1%Wood
Population in 1990: 2,270.
Place of birth for U.S.-born residents:
This state: 1,638
Northeast: 2
Midwest: 109
South: 26
West: 15
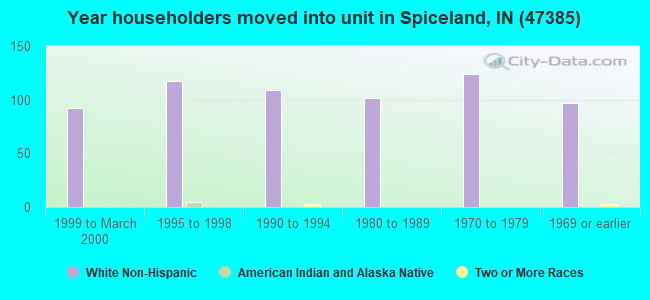
67% of the 47385 zip code residents lived in the same house 5 years ago. Out of people who lived in different houses, 59% lived in this county. Out of people who lived in different counties, 50% lived in Indiana.
90% of the 47385 zip code residents lived in the same house 1 year ago. Out of people who lived in different houses, 44% moved from this county. Out of people who lived in different houses, 30% moved from different county within same state. Out of people who lived in different houses, 26% moved from different state.
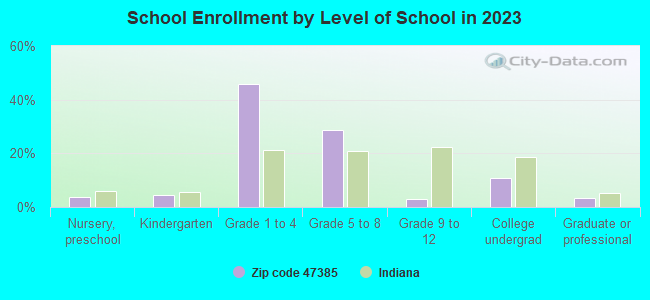
Private vs. public school enrollment:
Students in private schools in grades 1 to 8 (elementary and middle school): 61
Here:
18.8%
Indiana:
14.9%
Students in private schools in grades 9 to 12 (high school):
Here:
0.0%
Indiana:
11.4%
Students in private undergraduate colleges:
Here:
0.0%
Indiana:
22.3%
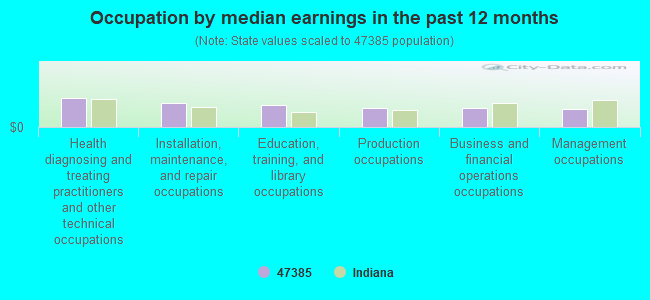
Occupation by median earnings in the past 12 months ($)
113,385Health diagnosing and treating practitioners and other technical occupations
88,522Health technologists and technicians
62,687Education, training, and library occupations
55,310Installation, maintenance, and repair occupations
54,327Business and financial operations occupations
53,668Production occupations
Top industries in this zip code by the number of employees in 2005:
Wholesale Trade: Other Grocery and Related Products Merchant Wholesalers (20-49 employees: 1 establishment)
Other Services (except Public Administration): Religious Organizations (1-4: 3)
Construction: Framing Contractors (1-4: 1)
Fatal accident statistics in 2014:
Fatal accident count: 1
Vehicles involved in fatal accidents: 2
Fatal accidents caused by drunken drivers: 0
Fatalities: 1
Persons involved in fatal accidents: 3
Pedestrians involved in fatal accidents: 0
Fatal accident statistics in 2013:
Fatal accident count: 2
Vehicles involved in fatal accidents: 3
Fatal accidents caused by drunken drivers: 0
Fatalities: 2
Persons involved in fatal accidents: 3
Pedestrians involved in fatal accidents: 0
2002 - 2018 National Fire Incident Reporting System (NFIRS) incidents
According to the data from the years 2002 - 2018 the average number of fire incidents per year is 12. The highest number of fire incidents - 28 took place in 2010, and the least - 0 in 2016. The data has a dropping trend.
When looking into fire subcategories, the most incidents belonged to: Outside Fires (38.5%), and Structure Fires (31.7%).
Fire incident types reported to NFIRS in Zip Code 47385

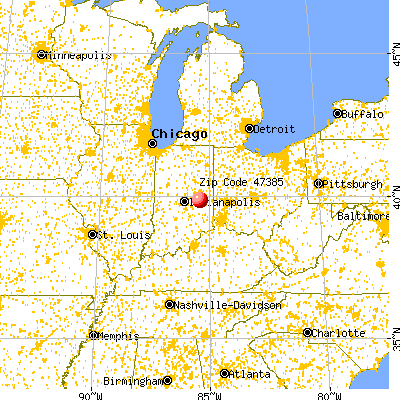


 Nearest zip codes: 47337, 47344, 46148, 47352, 46155, 47351.


 According to the data from the years 2002 - 2018 the average number of fire incidents per year is 12. The highest number of fire incidents - 28 took place in 2010, and the least - 0 in 2016. The data has a dropping trend.
 When looking into fire subcategories, the most incidents belonged to: Outside Fires (38.5%), and Structure Fires (31.7%).