Estimated zip code population in 2022: 1,552 Zip code population in 2010: 1,663 Zip code population in 2000: 1,232
Houses and condos: 721 Renter-occupied apartments: 99
% of renters here:
18%
State:
29%
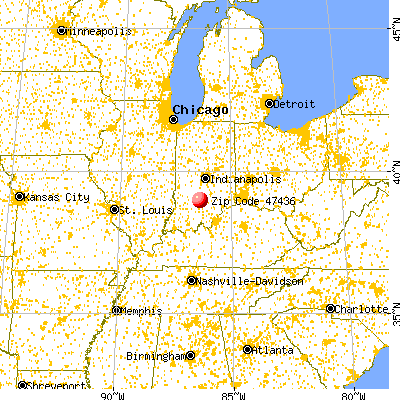
March 2022 cost of living index in zip code 47436: 84.0 (less than average, U.S. average is 100)
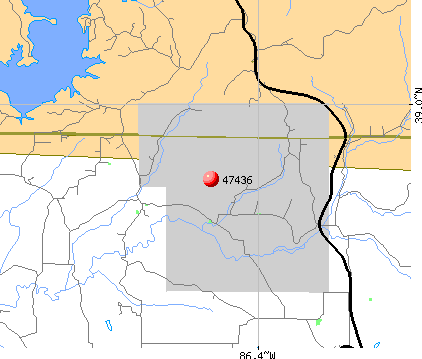
Land area: 45.8 sq. mi. Water area: 0.3 sq. mi.
Population density: 34 people per square mile
(very low).
OSM Map
General Map
Google Map
MSN Map
OSM Map
General Map
Google Map
MSN Map
OSM Map
General Map
Google Map
MSN Map
OSM Map
General Map
Google Map
MSN Map
Please wait while loading the map...
Real estate property taxes paid for housing units in 2022:
This zip code:
0.6% ($1,333)
Indiana:
0.7% ($1,467)
Median real estate property taxes paid for housing units with mortgages in 2022: $1,309 (0.4%) Median real estate property taxes paid for housing units with no mortgage in 2022: $1,354 (0.7%)
Business Search- 14 Million verified businesses
Males: 840
(54.1%)
Females: 711
(45.9%)
For population 25 years and over in 47436:
High school or higher: 80.4%
Bachelor's degree or higher: 21.6%
Graduate or professional degree: 13.5%
Unemployed: 7.1%
Mean travel time to work (commute): 28.5 minutes
For population 15 years and over in 47436:
Never married: 26.5%
Now married: 58.9%
Separated: 0.0%
Widowed: 6.2%
Divorced: 8.5%
Zip code 47436 compared to state average:
Unemployed percentage above state average.
Black race population percentage significantly below state average.
Hispanic race population percentage significantly below state average.
Median age above state average.
Foreign-born population percentage significantly below state average.
Renting percentage below state average.
Length of stay since moving in significantly above state average.
Estimated median house/condo value in 2022: $233,139
47436:
$233,139
Indiana:
$208,700
Median resident age:
This zip code:
44.4 years
Indiana median age:
38.2 years
Average household size:
This zip code:
2.8 people
Indiana:
2.4 people
Averages for the 2020 tax year for zip code 47436, filed in 2021:
Average Adjusted Gross Income (AGI) in 2020: $63,653 (Individual Income Tax Returns)
Here:
$63,653
State:
$64,978
Salary/wage: $48,853 (reported on 79.2% of returns)
Here:
$48,853
State:
$55,245
(% of AGI for various income ranges: 1061.9% for AGIs below $25k, 3888.6% for AGIs $25k-50k, 6345.0% for AGIs $50k-75k, 8425.0% for AGIs $75k-100k, 15102.9% for AGIs $100k-200k)
Taxable interest for individuals: $850 (reported on 33.3% of returns)
This zip code:
$850
Indiana:
$1,351
(% of AGI for various income ranges: 13.8% for AGIs below $25k, 43.6% for AGIs $25k-50k, 50.0% for AGIs $50k-75k, 26.7% for AGIs $75k-100k, 92.9% for AGIs $100k-200k)
Ordinary dividends: $3,030 (reported on 13.9% of returns)
Here:
$3,030
State:
$5,827
(% of AGI for various income ranges: 47.1% for AGIs $25k-50k, 57.5% for AGIs $50k-75k, 272.9% for AGIs $100k-200k)
Net capital gain/loss in AGI: +$5,670 (reported on 13.9% of returns)
Here:
+$5,670
State:
+$17,730
(% of AGI for various income ranges: 10.6% for AGIs below $25k, 58.8% for AGIs $50k-75k, 718.6% for AGIs $100k-200k)
Profit/loss from business: +$3,562 (reported on 11.1% of returns)
Here:
+$3,562
State:
+$12,144
(% of AGI for various income ranges: 76.2% for AGIs below $25k, 45.7% for AGIs $25k-50k, 123.8% for AGIs $50k-75k)
Taxable individual retirement arrangement distribution: $12,625 (reported on 11.1% of returns)
47436:
$12,625
Indiana:
$18,302
(% of AGI for various income ranges: 112.5% for AGIs below $25k, 224.3% for AGIs $25k-50k, 860.0% for AGIs $75k-100k)
Earned income credit: $2,167 (reported on 12.5% of returns)
Here:
$2,167
State:
$2,298
(% of AGI for various income ranges: 73.8% for AGIs below $25k, 55.0% for AGIs $25k-50k)
Percentage of individuals using paid preparers for their 2020 taxes: 95.8%
Here:
96%
State:
94%
(% for various income ranges: 96.0% for AGIs below $25k, 94.4% for AGIs $25k-50k, 100.0% for AGIs $50k-75k, 100.0% for AGIs $75k-100k, 90.9% for AGIs $100k-200k)
Averages for the 2012 tax year for zip code 47436, filed in 2013:
Average Adjusted Gross Income (AGI) in 2012: $41,929 (Individual Income Tax Returns)
Here:
$41,929
State:
$52,932
Salary/wage: $36,003 (reported on 85.5% of returns)
Here:
$36,003
State:
$45,173
(% of AGI for various income ranges: 62.1% for AGIs below $25k, 76.7% for AGIs $25k-50k, 69.9% for AGIs $50k-75k, 81.7% for AGIs $75k-100k, 71.7% for AGIs $100k-200k)
Taxable interest for individuals: $1,322 (reported on 33.3% of returns)
This zip code:
$1,322
Indiana:
$1,311
(% of AGI for various income ranges: 1.4% for AGIs below $25k, 1.0% for AGIs $25k-50k, 2.5% for AGIs $50k-75k, 0.4% for AGIs $75k-100k, 0.2% for AGIs $100k-200k)
Ordinary dividends: $1,525 (reported on 11.6% of returns)
Here:
$1,525
State:
$4,690
Net capital gain/loss in AGI: +$3,183 (reported on 8.7% of returns)
Here:
+$3,183
State:
+$10,406
Profit/loss from business: +$9,638 (reported on 11.6% of returns)
Here:
+$9,638
State:
+$11,105
Taxable individual retirement arrangement distribution: $7,457 (reported on 10.1% of returns)
47436:
$7,457
Indiana:
$13,841
Total itemized deductions: $14,493 (22% of AGI, reported on 20.3% of returns)
Here:
$14,493
State:
$20,913
Here:
21.8% of AGI
State:
18.2% of AGI
(% of AGI for various income ranges: 7.7% for AGIs below $25k, 5.0% for AGIs $25k-50k, 6.8% for AGIs $50k-75k, 7.1% for AGIs $75k-100k, 8.7% for AGIs $100k-200k)
Charity contributions: $3,725 (reported on 11.6% of returns)
Here:
$3,725
State:
$4,697
(% of AGI for various income ranges: 0.8% for AGIs below $25k, 1.9% for AGIs $50k-75k, 2.3% for AGIs $100k-200k)
Taxes paid: $4,507 (reported on 20.3% of returns)
47436:
$4,507
State:
$7,456
(% of AGI for various income ranges: 1.0% for AGIs below $25k, 1.1% for AGIs $25k-50k, 2.1% for AGIs $50k-75k, 2.3% for AGIs $75k-100k, 3.8% for AGIs $100k-200k)
Earned income credit: $1,809 (reported on 15.9% of returns)
Here:
$1,809
State:
$2,265
(% of AGI for various income ranges: 3.7% for AGIs below $25k, 1.1% for AGIs $25k-50k)
Percentage of individuals using paid preparers for their 2012 taxes: 60.9%
Here:
61%
State:
53%
(% for various income ranges: 58.6% for AGIs below $25k, 61.1% for AGIs $25k-50k, 60.0% for AGIs $50k-75k, 71.4% for AGIs $75k-100k, 60.0% for AGIs $100k-200k)
Averages for the 2004 tax year for zip code 47436, filed in 2005:
Average Adjusted Gross Income (AGI) in 2004: $39,507 (Individual Income Tax Returns)
Here:
$39,507
State:
$44,790
Salary/wage: $35,290 (reported on 88.5% of returns)
Here:
$35,290
State:
$39,615
(% of AGI for various income ranges: 79.7% for AGIs below $10k, 71.6% for AGIs $10k-25k, 83.7% for AGIs $25k-50k, 85.6% for AGIs $50k-75k, 83.8% for AGIs $75k-100k, 62.5% for AGIs over 100k)
Taxable interest for individuals: $1,140 (reported on 48.4% of returns)
This zip code:
$1,140
Indiana:
$1,535
(% of AGI for various income ranges: 7.1% for AGIs below $10k, 1.6% for AGIs $10k-25k, 1.5% for AGIs $25k-50k, 0.6% for AGIs $50k-75k, 2.0% for AGIs $75k-100k, 1.0% for AGIs over 100k)
Taxable dividends: $536 (reported on 15.9% of returns)
Here:
$536
State:
$2,998
(% of AGI for various income ranges: 0.8% for AGIs below $10k, 0.6% for AGIs $10k-25k, 0.3% for AGIs $25k-50k, 0.1% for AGIs $50k-75k, 0.2% for AGIs $75k-100k)
Net capital gain/loss: +$1,474 (reported on 11.0% of returns)
Here:
+$1,474
State:
+$8,619
(% of AGI for various income ranges: 1.2% for AGIs below $10k, 0.0% for AGIs $10k-25k, 0.2% for AGIs $25k-50k, 0.7% for AGIs $50k-75k, 0.9% for AGIs $75k-100k)
Profit/loss from business: +$5,480 (reported on 14.7% of returns)
Here:
+$5,480
State:
+$10,071
(% of AGI for various income ranges: 12.2% for AGIs below $10k, 6.8% for AGIs $10k-25k, 2.2% for AGIs $25k-50k, 1.7% for AGIs $50k-75k)
Total itemized deductions: $15,813 (21% of AGI, reported on 22.3% of returns)
Here:
$15,813
State:
$17,065
Here:
21.3% of AGI
State:
19.5% of AGI
(% of AGI for various income ranges: 4.3% for AGIs $10k-25k, 7.5% for AGIs $25k-50k, 10.0% for AGIs $50k-75k, 11.1% for AGIs $75k-100k, 11.4% for AGIs over 100k)
Charity contributions deductions: $3,307 (4% of AGI, reported on 19.7% of returns)
Here:
$3,307
State:
$3,550
Here:
4.3% of AGI
State:
3.8% of AGI
(% of AGI for various income ranges: 2.2% for AGIs below $10k, 1.2% for AGIs $25k-50k, 1.2% for AGIs $50k-75k, 1.5% for AGIs $75k-100k, 3.9% for AGIs over 100k)
Total tax: $4,807 (reported on 78.4% of returns)
47436:
$4,807
State:
$6,914
(% of AGI for various income ranges: 2.7% for AGIs below $10k, 4.6% for AGIs $10k-25k, 6.4% for AGIs $25k-50k, 8.1% for AGIs $50k-75k, 10.1% for AGIs $75k-100k, 19.4% for AGIs over 100k)
Earned income credit: $1,382 (reported on 15.9% of returns)
Here:
$1,382
State:
$1,685
Percentage of individuals using paid preparers for their 2004 taxes: 63.1%
Here:
63%
State:
59%
(% for various income ranges: 48.9% for AGIs below $10k, 67.1% for AGIs $10k-25k, 60.9% for AGIs $25k-50k, 78.0% for AGIs $50k-75k, 57.7% for AGIs $75k-100k, 69.0% for AGIs over 100k)
Household received Food Stamps/SNAP in the past 12 months: 47 Household did not receive Food Stamps/SNAP in the past 12 months: 515
Women who had a birth in the past 12 months: 39 (42 now married, 0 unmarried) Women who did not have a birth in the past 12 months: 333 (224 now married, 110 unmarried)
Housing units in zip code 47436 with a mortgage: 186 (44 second mortgage, 46 both second mortgage and home equity loan) Median monthly owner costs for units with a mortgage: $1,453 Median monthly owner costs for units without a mortgage: $491
Residents with income below the poverty level in 2022:
This zip code:
21.3%
Whole state:
12.6%
Residents with income below 50% of the poverty level in 2022:
This zip code:
19.3%
Whole state:
6.3%
Median number of rooms in houses and condos:
Here:
6.2
State:
6.6
Median number of rooms in apartments:
Here:
4.7
State:
4.3
Notable locations in this zip code not listed on our city pages
Churches in zip code 47436 include: Gil Gal Church (A), Mundell Church (B), Pleasant Run Church (C), Ramsey Ridge Church (D), The Meadows Church (E). Display/hide their locations on the map
Streams, rivers, and creeks: Howe Creek (A), Bowlen Branch (B), Pole Branch (C), Orchard Run (D), Henderson Creek (E). Display/hide their locations on the map
Size of family households: 143 2-persons, 133 3-persons, 133 4-persons, 12 5-persons
Size of nonfamily households: 131 1-person, 6 2-persons
135 married couples with children.
63 single-parent households (63 women).
96.5% of residents of 47436 zip code speak English at home.
2.1% of residents speak Asian or Pacific Island language at home (78% very well, 22% well).
Foreign born population: 24 (1.6%) (42.1% of them are naturalized citizens)
This zip code:
1.6%
Whole state:
6.1%
50%Sweden
42%American
22%Irish
13%English
5%German
4%Finnish
2%European
1%Slovak
Year of entry for the foreign-born population
162010 or later
02000 to 2009
01990 to 1999
8Before 1990
Facilities with environmental interests located in this zip code:
BLOOMINGTON SALEM RD AND MACKEY (BLOOMINGTON SALEM RD & MACKEY in HELTONVILLE, IN)
STATE MASTER (Indiana facility tracking) (Resource Conservation and Recovery Act (tracking hazardous waste)) Organizations: INDIANA BELL TELEPHONE CO INC (CONTACT/OWNER)
36.6%Electricity
34.6%Bottled, tank, or LP gas
17.8%Wood
8.4%Utility gas
1.6%Fuel oil, kerosene, etc.
1.3%No fuel used
Population in 1990: 1,402.
Place of birth for U.S.-born residents:
This state: 1,226
Northeast: 106
Midwest: 25
South: 36
West: 134
70% of the 47436 zip code residents lived in the same house 5 years ago. Out of people who lived in different houses, 39% lived in this county. Out of people who lived in different counties, 50% lived in Indiana.
92% of the 47436 zip code residents lived in the same house 1 year ago. Out of people who lived in different houses, 50% moved from this county. Out of people who lived in different houses, 50% moved from different county within same state.
Private vs. public school enrollment:
Students in private schools in grades 1 to 8 (elementary and middle school): 9
Here:
10.1%
Indiana:
14.9%
Students in private schools in grades 9 to 12 (high school):
Here:
0.0%
Indiana:
11.4%
Students in private undergraduate colleges:
Here:
0.0%
Indiana:
22.3%
Occupation by median earnings in the past 12 months ($)
93,081Sales and related occupations
67,034Production occupations
48,284Construction and extraction occupations
46,016Education, training, and library occupations
34,665Management occupations
18,838Healthcare support occupations
Top industries in this zip code by the number of employees in 2005:
Construction: Power and Communication Line and Related Structures Construction (5-9 employees: 2 establishments)
Information: Periodical Publishers (5-9: 1)
Accommodation and Food Services: Snack and Nonalcoholic Beverage Bars (1-4: 1)
Fatal accident statistics in 2010:
Fatal accident count: 1
Vehicles involved in fatal accidents: 1
Fatal accidents caused by drunken drivers: 1
Fatalities: 1
Persons involved in fatal accidents: 2
Pedestrians involved in fatal accidents: 0
2002 - 2018 National Fire Incident Reporting System (NFIRS) incidents
Based on the data from the years 2002 - 2018 the average number of fires per year is 10. The highest number of fires - 23 took place in 2009, and the least - 0 in 2015. The data has a decreasing trend.
When looking into fire subcategories, the most incidents belonged to: Structure Fires (45.4%), and Outside Fires (37.9%).
Fire incident types reported to NFIRS in Zip Code 47436


 Nearest zip codes: 47421, 47264, 47451, 47401, 47458, 47420.


 Based on the data from the years 2002 - 2018 the average number of fires per year is 10. The highest number of fires - 23 took place in 2009, and the least - 0 in 2015. The data has a decreasing trend.
 When looking into fire subcategories, the most incidents belonged to: Structure Fires (45.4%), and Outside Fires (37.9%).