Estimated zip code population in 2022: 1,835 Zip code population in 2010: 1,841 Zip code population in 2000: 1,932
Houses and condos: 1,024 Renter-occupied apartments: 64
% of renters here:
9%
State:
29%
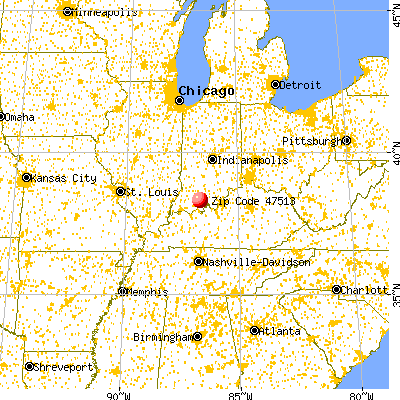
March 2022 cost of living index in zip code 47513: 83.8 (less than average, U.S. average is 100)
Land area: 59.3 sq. mi. Water area: 0.4 sq. mi.
Population density: 31 people per square mile
(very low).
OSM Map
General Map
Google Map
MSN Map
OSM Map
General Map
Google Map
MSN Map
OSM Map
General Map
Google Map
MSN Map
OSM Map
General Map
Google Map
MSN Map
Please wait while loading the map...
Real estate property taxes paid for housing units in 2022:
This zip code:
0.6% ($664)
Indiana:
0.7% ($1,467)
Median real estate property taxes paid for housing units with mortgages in 2022: $644 (0.6%) Median real estate property taxes paid for housing units with no mortgage in 2022: $729 (0.6%)
Business Search- 14 Million verified businesses
Males: 1,021
(55.7%)
Females: 813
(44.3%)
For population 25 years and over in 47513:
High school or higher: 88.4%
Bachelor's degree or higher: 13.2%
Graduate or professional degree: 3.2%
Unemployed: 0.7%
Mean travel time to work (commute): 31.4 minutes
For population 15 years and over in 47513:
Never married: 19.9%
Now married: 54.2%
Separated: 0.3%
Widowed: 10.5%
Divorced: 15.2%
Zip code 47513 compared to state average:
Median house value below state average.
Unemployed percentage significantly below state average.
Black race population percentage significantly below state average.
Hispanic race population percentage below state average.
Foreign-born population percentage significantly below state average.
Renting percentage significantly below state average.
Length of stay since moving in significantly above state average.
Number of rooms per house below state average.
Percentage of population with a bachelor's degree or higher significantly below state average.
Estimated median house/condo value in 2022: $111,511
47513:
$111,511
Indiana:
$208,700
Median resident age:
This zip code:
39.8 years
Indiana median age:
38.2 years
Average household size:
This zip code:
2.5 people
Indiana:
2.4 people
Averages for the 2020 tax year for zip code 47513, filed in 2021:
Average Adjusted Gross Income (AGI) in 2020: $52,041 (Individual Income Tax Returns)
Here:
$52,041
State:
$64,978
Salary/wage: $47,150 (reported on 82.0% of returns)
Here:
$47,150
State:
$55,245
(% of AGI for various income ranges: 1030.5% for AGIs below $25k, 3845.2% for AGIs $25k-50k, 6713.1% for AGIs $50k-75k, 9252.2% for AGIs $75k-100k, 16390.0% for AGIs $100k-200k)
Taxable interest for individuals: $1,018 (reported on 28.0% of returns)
This zip code:
$1,018
Indiana:
$1,351
(% of AGI for various income ranges: 16.0% for AGIs below $25k, 43.8% for AGIs $25k-50k, 55.4% for AGIs $50k-75k, 52.2% for AGIs $75k-100k, 60.0% for AGIs $100k-200k)
Ordinary dividends: $1,653 (reported on 17.0% of returns)
Here:
$1,653
State:
$5,827
(% of AGI for various income ranges: 25.5% for AGIs below $25k, 17.6% for AGIs $25k-50k, 76.2% for AGIs $50k-75k, 26.7% for AGIs $75k-100k, 100.0% for AGIs $100k-200k)
Net capital gain/loss in AGI: +$6,353 (reported on 15.0% of returns)
Here:
+$6,353
State:
+$17,730
(% of AGI for various income ranges: 14.5% for AGIs below $25k, 27.1% for AGIs $25k-50k, 133.1% for AGIs $50k-75k, 71.1% for AGIs $75k-100k, 900.0% for AGIs $100k-200k)
Profit/loss from business: +$5,900 (reported on 9.0% of returns)
Here:
+$5,900
State:
+$12,144
(% of AGI for various income ranges: 90.5% for AGIs below $25k, 216.2% for AGIs $50k-75k, 76.7% for AGIs $75k-100k)
Taxable individual retirement arrangement distribution: $10,236 (reported on 11.0% of returns)
47513:
$10,236
Indiana:
$18,302
(% of AGI for various income ranges: 122.0% for AGIs below $25k, 106.2% for AGIs $25k-50k, 304.6% for AGIs $50k-75k, 292.2% for AGIs $75k-100k)
Earned income credit: $2,282 (reported on 11.0% of returns)
Here:
$2,282
State:
$2,298
(% of AGI for various income ranges: 62.5% for AGIs below $25k, 60.0% for AGIs $25k-50k)
Percentage of individuals using paid preparers for their 2020 taxes: 96.0%
Here:
96%
State:
94%
(% for various income ranges: 93.8% for AGIs below $25k, 92.6% for AGIs $25k-50k, 100.0% for AGIs $50k-75k, 100.0% for AGIs $75k-100k, 100.0% for AGIs $100k-200k)
Averages for the 2012 tax year for zip code 47513, filed in 2013:
Average Adjusted Gross Income (AGI) in 2012: $39,132 (Individual Income Tax Returns)
Here:
$39,132
State:
$52,932
Salary/wage: $37,695 (reported on 85.1% of returns)
Here:
$37,695
State:
$45,173
(% of AGI for various income ranges: 71.0% for AGIs below $25k, 85.8% for AGIs $25k-50k, 85.1% for AGIs $50k-75k, 86.8% for AGIs $75k-100k, 72.0% for AGIs $100k-200k)
Taxable interest for individuals: $880 (reported on 31.9% of returns)
This zip code:
$880
Indiana:
$1,311
(% of AGI for various income ranges: 2.1% for AGIs below $25k, 0.9% for AGIs $25k-50k, 0.4% for AGIs $50k-75k, 0.4% for AGIs $75k-100k, 0.4% for AGIs $100k-200k)
Ordinary dividends: $940 (reported on 16.0% of returns)
Here:
$940
State:
$4,690
(% of AGI for various income ranges: 0.9% for AGIs below $25k, 0.4% for AGIs $25k-50k, 0.3% for AGIs $50k-75k, 0.5% for AGIs $75k-100k)
Net capital gain/loss in AGI: +$2,520 (reported on 10.6% of returns)
Here:
+$2,520
State:
+$10,406
(% of AGI for various income ranges: 19.7% for AGIs below $25k, 0.4% for AGIs $25k-50k, 2.9% for AGIs $75k-100k)
Profit/loss from business: +$4,882 (reported on 11.7% of returns)
Here:
+$4,882
State:
+$11,105
(% of AGI for various income ranges: 1.7% for AGIs below $25k, 2.3% for AGIs $25k-50k, 0.7% for AGIs $50k-75k, 2.6% for AGIs $75k-100k)
Taxable individual retirement arrangement distribution: $9,133 (reported on 9.6% of returns)
47513:
$9,133
Indiana:
$13,841
(% of AGI for various income ranges: 6.6% for AGIs below $25k, 2.7% for AGIs $25k-50k, 4.2% for AGIs $75k-100k)
Total itemized deductions: $14,231 (22% of AGI, reported on 13.8% of returns)
Here:
$14,231
State:
$20,913
Here:
22.3% of AGI
State:
18.2% of AGI
(% of AGI for various income ranges: 5.2% for AGIs $25k-50k, 5.3% for AGIs $50k-75k, 4.6% for AGIs $75k-100k, 8.3% for AGIs $100k-200k)
Charity contributions: $1,786 (reported on 7.4% of returns)
Here:
$1,786
State:
$4,697
Taxes paid: $4,608 (reported on 12.8% of returns)
47513:
$4,608
State:
$7,456
(% of AGI for various income ranges: 1.2% for AGIs $25k-50k, 1.4% for AGIs $50k-75k, 1.4% for AGIs $75k-100k, 3.4% for AGIs $100k-200k)
Earned income credit: $1,967 (reported on 12.8% of returns)
Here:
$1,967
State:
$2,265
(% of AGI for various income ranges: 3.8% for AGIs below $25k, 0.8% for AGIs $25k-50k)
Percentage of individuals using paid preparers for their 2012 taxes: 75.5%
Here:
76%
State:
53%
(% for various income ranges: 70.3% for AGIs below $25k, 77.8% for AGIs $25k-50k, 76.5% for AGIs $50k-75k, 87.5% for AGIs $75k-100k, 80.0% for AGIs $100k-200k)
Averages for the 2004 tax year for zip code 47513, filed in 2005:
Average Adjusted Gross Income (AGI) in 2004: $34,066 (Individual Income Tax Returns)
Here:
$34,066
State:
$44,790
Salary/wage: $33,046 (reported on 87.9% of returns)
Here:
$33,046
State:
$39,615
(% of AGI for various income ranges: 114.3% for AGIs below $10k, 80.1% for AGIs $10k-25k, 86.4% for AGIs $25k-50k, 87.7% for AGIs $50k-75k, 85.5% for AGIs $75k-100k, 67.7% for AGIs over 100k)
Taxable interest for individuals: $1,081 (reported on 50.9% of returns)
This zip code:
$1,081
Indiana:
$1,535
(% of AGI for various income ranges: 10.4% for AGIs below $10k, 2.8% for AGIs $10k-25k, 1.6% for AGIs $25k-50k, 1.2% for AGIs $50k-75k, 0.8% for AGIs $75k-100k, 0.0% for AGIs over 100k)
Taxable dividends: $758 (reported on 18.4% of returns)
Here:
$758
State:
$2,998
(% of AGI for various income ranges: 1.8% for AGIs below $10k, 0.2% for AGIs $10k-25k, 0.5% for AGIs $25k-50k, 0.3% for AGIs $50k-75k, 0.5% for AGIs $75k-100k)
Net capital gain/loss: +$3,389 (reported on 12.3% of returns)
Here:
+$3,389
State:
+$8,619
(% of AGI for various income ranges: 0.9% for AGIs below $10k, 0.3% for AGIs $10k-25k, 0.9% for AGIs $25k-50k, 1.3% for AGIs $50k-75k, 3.0% for AGIs $75k-100k)
Profit/loss from business: +$5,628 (reported on 10.7% of returns)
Here:
+$5,628
State:
+$10,071
(% of AGI for various income ranges: 4.6% for AGIs below $10k, 5.2% for AGIs $10k-25k, 2.3% for AGIs $25k-50k, 1.1% for AGIs $50k-75k)
IRA payment deduction: $2,833 (reported on 1.4% of returns)
47513:
$2,833
Indiana:
$2,840
Total itemized deductions: $13,575 (22% of AGI, reported on 16.7% of returns)
Here:
$13,575
State:
$17,065
Here:
21.5% of AGI
State:
19.5% of AGI
(% of AGI for various income ranges: 11.3% for AGIs below $10k, 6.5% for AGIs $25k-50k, 6.6% for AGIs $50k-75k, 9.2% for AGIs $75k-100k, 10.1% for AGIs over 100k)
Charity contributions deductions: $2,000 (3% of AGI, reported on 10.1% of returns)
Here:
$2,000
State:
$3,550
Here:
2.8% of AGI
State:
3.8% of AGI
Total tax: $3,435 (reported on 72.8% of returns)
47513:
$3,435
State:
$6,914
(% of AGI for various income ranges: 2.2% for AGIs below $10k, 4.8% for AGIs $10k-25k, 5.7% for AGIs $25k-50k, 8.0% for AGIs $50k-75k, 10.3% for AGIs $75k-100k, 10.7% for AGIs over 100k)
Earned income credit: $1,412 (reported on 13.6% of returns)
Here:
$1,412
State:
$1,685
Percentage of individuals using paid preparers for their 2004 taxes: 73.4%
Here:
73%
State:
59%
(% for various income ranges: 61.1% for AGIs below $10k, 70.4% for AGIs $10k-25k, 83.3% for AGIs $25k-50k, 75.5% for AGIs $50k-75k, 75.0% for AGIs $75k-100k, 80.0% for AGIs over 100k)
Household received Food Stamps/SNAP in the past 12 months: 29 Household did not receive Food Stamps/SNAP in the past 12 months: 716
Women who had a birth in the past 12 months: 32 (33 now married, 1 unmarried) Women who did not have a birth in the past 12 months: 271 (132 now married, 139 unmarried)
Housing units in zip code 47513 with a mortgage: 238 (27 second mortgage, 16 both second mortgage and home equity loan) Houses without a mortgage: 39
Median monthly owner costs for units with a mortgage: $935 Median monthly owner costs for units without a mortgage: $369
Residents with income below the poverty level in 2022:
This zip code:
14.9%
Whole state:
12.6%
Residents with income below 50% of the poverty level in 2022:
This zip code:
7.7%
Whole state:
6.3%
Median number of rooms in houses and condos:
Here:
5.5
State:
6.6
Median number of rooms in apartments:
Here:
5.5
State:
4.3
Notable locations in this zip code not listed on our city pages
Churches in zip code 47513 include: Anderson Valley Church (A), Saint Joe Church (B), Birdseye Christian Church (C). Display/hide their locations on the map
Cemeteries: Spencer Cemetery (1), Sigler Cemetery (2), Garland Cemetery (3), Fox Ridge Cemetery (4), Enlow Cemetery (5), Cox Cemetery (6), Waddle Cemetery (7). Display/hide their locations on the map
Size of family households: 185 2-persons, 48 3-persons, 130 4-persons, 19 5-persons, 16 6-persons, 14 7-or-more-persons
Size of nonfamily households: 313 1-person, 16 2-persons
407 married couples with children.
65 single-parent households (10 men, 55 women).
97.5% of residents of 47513 zip code speak English at home.
1.7% of residents speak Spanish at home (100% very well).
0.2% of residents speak other Indo-European language at home (100% very well).
Foreign born population: 2 (0.1%) (100.0% of them are naturalized citizens)
This zip code:
0.1%
Whole state:
6.1%
50%Serbia
30%German
15%English
10%American
9%Irish
6%European
5%Scottish
1%British
Year of entry for the foreign-born population
22010 or later
02000 to 2009
01990 to 1999
0Before 1990
Facilities with environmental interests located in this zip code:
PINE RIDGE ELEM SCHOOL (4613 S PINE RIDGE RD in BIRDSEYE, IN)
STATE MASTER (Indiana facility tracking) (National Center for Education Statistics) - STATE ID-1563 National Pollutant Discharge Elimination System NON-MAJOR (Tracking pollutant discharge elimination systems) - permit Business SIC classification: ELEMENTARY AND SECONDARY SCHOOLS Organizations: RON GROESCHEN 9117 (CONTACT/OPERATOR)
, SE DUBOIS COUNTY SCHOOL CORP (CONTACT/OWNER)
, SOUTHEAST DUBOIS CO SCH CORP (SCHOOL DISTRICT)
Alternative names: PINE RIDGE ELEMENTARY SCHOOL
BIRDSEYE MUNICIPAL WWTP (9 W 1ST ST in BIRDSEYE, IN)
STATE MASTER (Indiana facility tracking) - CRTK-10112, EPCRA National Pollutant Discharge Elimination System NON-MAJOR (Tracking pollutant discharge elimination systems) - permit Business SIC classification: SEWERAGE SYSTEMS Organizations: RONALD GROESCHEN CERT 8472 (CONTACT/OPERATOR)
, TOWN COUNCIL PRESIDENT (CONTACT/OWNER)
Alternative names: BIRDSEYE MUNICIPAL STP
AT AND T LONG LINES BIRDSEYE IND (CONSERVATION CLUB RD ONE POINT in BIRDSEYE, IN)
STATE MASTER (Indiana facility tracking) - CRTK-1129, EPCRA Conditionally Exempt Small Quantity Generators, less than 100 kg/month of hazardous waste (Resource Conservation and Recovery Act (tracking hazardous waste)) - notification
Housing units lacking complete plumbing facilities: 5.2% Housing units lacking complete kitchen facilities: 0.3%
42.8%Electricity
28.3%Bottled, tank, or LP gas
26.8%Utility gas
2.3%Wood
Population in 1990: 1,591. Population change in the 1990s: +341 (+21.4%).
Place of birth for U.S.-born residents:
This state: 1,478
Northeast: 19
Midwest: 45
South: 234
West: 36
70% of the 47513 zip code residents lived in the same house 5 years ago. Out of people who lived in different houses, 49% lived in this county. Out of people who lived in different counties, 50% lived in Indiana.
95% of the 47513 zip code residents lived in the same house 1 year ago. Out of people who lived in different houses, 53% moved from this county. Out of people who lived in different houses, 52% moved from different county within same state. Out of people who lived in different houses, 2% moved from different state.
Private vs. public school enrollment:
Students in private schools in grades 1 to 8 (elementary and middle school):
Here:
0.0%
Indiana:
14.9%
Students in private schools in grades 9 to 12 (high school): 1
Here:
3.0%
Indiana:
11.4%
Students in private undergraduate colleges: 22
Here:
41.2%
Indiana:
22.3%
Occupation by median earnings in the past 12 months ($)
82,595Sales and related occupations
70,432Transportation occupations
52,930Business and financial operations occupations
45,136Construction and extraction occupations
44,461Installation, maintenance, and repair occupations
43,996Health diagnosing and treating practitioners and other technical occupations
Top industries in this zip code by the number of employees in 2005:
Arts, Entertainment, and Recreation: Marinas (10-19 employees: 1 establishment)
Construction: New Single-Family Housing Construction (except Operative Builders) (1-4: 7)
Accommodation and Food Services: Full-Service Restaurants (5-9: 2)
Construction: Land Subdivision (5-9: 1)
Real Estate and Rental and Leasing: Recreational Goods Rental (5-9: 1)
Other Services (except Public Administration): Other Similar Organizations (except Business, Professional, Labor, and Political Organizations) (5-9: 1)
Accommodation and Food Services: Snack and Nonalcoholic Beverage Bars (5-9: 1)
Fatal accident statistics in 2014:
Fatal accident count: 1
Vehicles involved in fatal accidents: 1
Fatal accidents caused by drunken drivers: 0
Fatalities: 1
Persons involved in fatal accidents: 3
Pedestrians involved in fatal accidents: 0
Fatal accident statistics in 2013:
Fatal accident count: 2
Vehicles involved in fatal accidents: 2
Fatal accidents caused by drunken drivers: 1
Fatalities: 2
Persons involved in fatal accidents: 2
Pedestrians involved in fatal accidents: 0
2002 - 2018 National Fire Incident Reporting System (NFIRS) incidents
Based on the data from the years 2002 - 2018 the average number of fire incidents per year is 8. The highest number of reported fires - 21 took place in 2010, and the least - 1 in 2002. The data has a rising trend.
When looking into fire subcategories, the most incidents belonged to: Structure Fires (37.6%), and Outside Fires (35.3%).
Fire incident types reported to NFIRS in Zip Code 47513


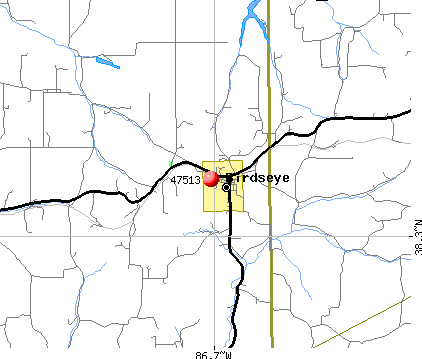 Nearest zip codes: 47580, 47575, 47521, 47116, 47515, 47576.


 Based on the data from the years 2002 - 2018 the average number of fire incidents per year is 8. The highest number of reported fires - 21 took place in 2010, and the least - 1 in 2002. The data has a rising trend.
 When looking into fire subcategories, the most incidents belonged to: Structure Fires (37.6%), and Outside Fires (35.3%).