Estimated zip code population in 2022: 2,311 Zip code population in 2010: 2,456 Zip code population in 2000: 2,648
Houses and condos: 1,008 Renter-occupied apartments: 119
% of renters here:
13%
State:
29%
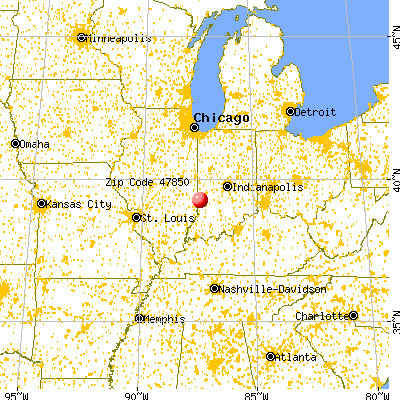
March 2022 cost of living index in zip code 47850: 83.6 (less than average, U.S. average is 100)
Land area: 51.0 sq. mi. Water area: 0.2 sq. mi.
Population density: 45 people per square mile
(very low).
OSM Map
General Map
Google Map
MSN Map
OSM Map
General Map
Google Map
MSN Map
OSM Map
General Map
Google Map
MSN Map
OSM Map
General Map
Google Map
MSN Map
Please wait while loading the map...
Real estate property taxes paid for housing units in 2022:
This zip code:
0.6% ($725)
Indiana:
0.7% ($1,467)
Median real estate property taxes paid for housing units with mortgages in 2022: $799 (0.7%) Median real estate property taxes paid for housing units with no mortgage in 2022: $655 (0.7%)
Business Search- 14 Million verified businesses
Males: 1,181
(51.1%)
Females: 1,130
(48.9%)
For population 25 years and over in 47850:
High school or higher: 83.7%
Bachelor's degree or higher: 16.1%
Graduate or professional degree: 3.0%
Unemployed: 4.5%
Mean travel time to work (commute): 20.3 minutes
For population 15 years and over in 47850:
Never married: 20.5%
Now married: 61.1%
Separated: 0.0%
Widowed: 5.5%
Divorced: 12.9%
Zip code 47850 compared to state average:
Median house value below state average.
Black race population percentage significantly below state average.
Hispanic race population percentage significantly below state average.
Median age significantly above state average.
Foreign-born population percentage significantly below state average.
Renting percentage significantly below state average.
Length of stay since moving in significantly above state average.
Percentage of population with a bachelor's degree or higher below state average.
Estimated median house/condo value in 2022: $115,603
47850:
$115,603
Indiana:
$208,700
According to our research of Indiana and other state lists, there was 1 registered sex offender living in 47850 zip code as of May 28, 2024. The ratio of all residents to sex offenders in zip code 47850 is 2,502 to 1. The ratio of registered sex offenders to all residents in this zip code is much lower than the state average.
Median resident age:
This zip code:
48.0 years
Indiana median age:
38.2 years
Average household size:
This zip code:
2.4 people
Indiana:
2.4 people
Averages for the 2020 tax year for zip code 47850, filed in 2021:
Average Adjusted Gross Income (AGI) in 2020: $53,151 (Individual Income Tax Returns)
Here:
$53,151
State:
$64,978
Salary/wage: $47,136 (reported on 77.9% of returns)
Here:
$47,136
State:
$55,245
(% of AGI for various income ranges: 992.9% for AGIs below $25k, 3329.1% for AGIs $25k-50k, 5764.3% for AGIs $50k-75k, 9932.9% for AGIs $75k-100k, 15722.0% for AGIs $100k-200k)
Taxable interest for individuals: $396 (reported on 23.9% of returns)
This zip code:
$396
Indiana:
$1,351
(% of AGI for various income ranges: 5.2% for AGIs below $25k, 7.4% for AGIs $25k-50k, 13.6% for AGIs $50k-75k, 7.1% for AGIs $75k-100k, 50.0% for AGIs $100k-200k)
Ordinary dividends: $2,843 (reported on 12.4% of returns)
Here:
$2,843
State:
$5,827
(% of AGI for various income ranges: 8.1% for AGIs below $25k, 23.5% for AGIs $25k-50k, 82.9% for AGIs $50k-75k, 203.0% for AGIs $100k-200k)
Net capital gain/loss in AGI: +$3,267 (reported on 10.6% of returns)
Here:
+$3,267
State:
+$17,730
(% of AGI for various income ranges: 14.3% for AGIs $25k-50k, 90.0% for AGIs $50k-75k, 234.0% for AGIs $100k-200k)
Profit/loss from business: +$9,233 (reported on 10.6% of returns)
Here:
+$9,233
State:
+$12,144
(% of AGI for various income ranges: 56.5% for AGIs below $25k, 83.5% for AGIs $25k-50k, 209.3% for AGIs $50k-75k, 640.0% for AGIs $75k-100k)
Taxable individual retirement arrangement distribution: $15,053 (reported on 13.3% of returns)
47850:
$15,053
Indiana:
$18,302
(% of AGI for various income ranges: 74.8% for AGIs below $25k, 167.4% for AGIs $25k-50k, 445.0% for AGIs $50k-75k, 1018.0% for AGIs $100k-200k)
Taxes paid: $6,500 (reported on 1.8% of returns)
47850:
$6,500
State:
$7,542
(% of AGI for various income ranges: 56.5% for AGIs $25k-50k)
Earned income credit: $2,350 (reported on 15.9% of returns)
Here:
$2,350
State:
$2,298
(% of AGI for various income ranges: 90.6% for AGIs below $25k, 61.7% for AGIs $25k-50k)
Percentage of individuals using paid preparers for their 2020 taxes: 98.2%
Here:
98%
State:
94%
(% for various income ranges: 97.5% for AGIs below $25k, 100.0% for AGIs $25k-50k, 100.0% for AGIs $50k-75k, 100.0% for AGIs $75k-100k, 94.1% for AGIs $100k-200k)
Averages for the 2012 tax year for zip code 47850, filed in 2013:
Average Adjusted Gross Income (AGI) in 2012: $44,453 (Individual Income Tax Returns)
Here:
$44,453
State:
$52,932
Salary/wage: $38,638 (reported on 84.1% of returns)
Here:
$38,638
State:
$45,173
(% of AGI for various income ranges: 68.9% for AGIs below $25k, 79.2% for AGIs $25k-50k, 83.2% for AGIs $50k-75k, 78.2% for AGIs $75k-100k, 58.4% for AGIs $100k-200k)
Taxable interest for individuals: $697 (reported on 25.7% of returns)
This zip code:
$697
Indiana:
$1,311
(% of AGI for various income ranges: 1.2% for AGIs below $25k, 0.6% for AGIs $25k-50k, 0.2% for AGIs $50k-75k, 0.3% for AGIs $75k-100k, 0.2% for AGIs $100k-200k)
Ordinary dividends: $1,606 (reported on 14.2% of returns)
Here:
$1,606
State:
$4,690
(% of AGI for various income ranges: 0.5% for AGIs below $25k, 0.5% for AGIs $25k-50k, 0.5% for AGIs $50k-75k, 0.6% for AGIs $75k-100k, 0.4% for AGIs $100k-200k)
Net capital gain/loss in AGI: +$370 (reported on 8.8% of returns)
Here:
+$370
State:
+$10,406
(% of AGI for various income ranges: 0.4% for AGIs $100k-200k)
Profit/loss from business: +$5,515 (reported on 11.5% of returns)
Here:
+$5,515
State:
+$11,105
(% of AGI for various income ranges: 3.5% for AGIs below $25k, 0.6% for AGIs $25k-50k, 1.5% for AGIs $50k-75k, 3.2% for AGIs $75k-100k)
Taxable individual retirement arrangement distribution: $11,560 (reported on 13.3% of returns)
47850:
$11,560
Indiana:
$13,841
(% of AGI for various income ranges: 3.3% for AGIs below $25k, 2.9% for AGIs $25k-50k, 3.4% for AGIs $50k-75k, 9.6% for AGIs $75k-100k)
Total itemized deductions: $17,506 (19% of AGI, reported on 15.0% of returns)
Here:
$17,506
State:
$20,913
Here:
19.1% of AGI
State:
18.2% of AGI
(% of AGI for various income ranges: 6.5% for AGIs $25k-50k, 5.9% for AGIs $50k-75k, 7.1% for AGIs $75k-100k, 7.1% for AGIs $100k-200k)
Charity contributions: $3,792 (reported on 11.5% of returns)
Here:
$3,792
State:
$4,697
(% of AGI for various income ranges: 1.1% for AGIs $25k-50k, 0.7% for AGIs $50k-75k, 1.3% for AGIs $75k-100k, 1.3% for AGIs $100k-200k)
Taxes paid: $4,761 (reported on 15.9% of returns)
47850:
$4,761
State:
$7,456
(% of AGI for various income ranges: 1.0% for AGIs $25k-50k, 1.4% for AGIs $50k-75k, 1.9% for AGIs $75k-100k, 3.1% for AGIs $100k-200k)
Earned income credit: $2,214 (reported on 19.5% of returns)
Here:
$2,214
State:
$2,265
(% of AGI for various income ranges: 6.8% for AGIs below $25k, 1.2% for AGIs $25k-50k)
Percentage of individuals using paid preparers for their 2012 taxes: 62.8%
Here:
63%
State:
53%
(% for various income ranges: 55.3% for AGIs below $25k, 66.7% for AGIs $25k-50k, 68.4% for AGIs $50k-75k, 63.6% for AGIs $75k-100k, 77.8% for AGIs $100k-200k)
Averages for the 2004 tax year for zip code 47850, filed in 2005:
Average Adjusted Gross Income (AGI) in 2004: $35,855 (Individual Income Tax Returns)
Here:
$35,855
State:
$44,790
Salary/wage: $32,730 (reported on 86.1% of returns)
Here:
$32,730
State:
$39,615
(% of AGI for various income ranges: 110.3% for AGIs below $10k, 74.1% for AGIs $10k-25k, 80.6% for AGIs $25k-50k, 82.4% for AGIs $50k-75k, 84.6% for AGIs $75k-100k, 59.9% for AGIs over 100k)
Taxable interest for individuals: $874 (reported on 40.6% of returns)
This zip code:
$874
Indiana:
$1,535
(% of AGI for various income ranges: 4.0% for AGIs below $10k, 2.4% for AGIs $10k-25k, 1.2% for AGIs $25k-50k, 0.6% for AGIs $50k-75k, 0.3% for AGIs $75k-100k, 0.4% for AGIs over 100k)
Taxable dividends: $1,435 (reported on 17.0% of returns)
Here:
$1,435
State:
$2,998
(% of AGI for various income ranges: 0.7% for AGIs below $10k, 0.6% for AGIs $10k-25k, 0.8% for AGIs $25k-50k, 0.4% for AGIs $50k-75k, 0.8% for AGIs $75k-100k, 0.7% for AGIs over 100k)
Net capital gain/loss: +$2,872 (reported on 11.7% of returns)
Here:
+$2,872
State:
+$8,619
(% of AGI for various income ranges: 1.3% for AGIs below $10k, 0.0% for AGIs $10k-25k, 0.8% for AGIs $25k-50k, 1.1% for AGIs $50k-75k, 1.0% for AGIs $75k-100k, 1.6% for AGIs over 100k)
Profit/loss from business: +$5,282 (reported on 11.5% of returns)
Here:
+$5,282
State:
+$10,071
(% of AGI for various income ranges: 8.2% for AGIs below $10k, 3.7% for AGIs $10k-25k, 1.0% for AGIs $25k-50k, 2.2% for AGIs $50k-75k, 1.4% for AGIs $75k-100k)
Profit/loss from farming: +$2,200 (reported on 4.4% of returns)
Here:
+$2,200
State:
-$2,212
IRA payment deduction: $2,000 (reported on 1.7% of returns)
47850:
$2,000
Indiana:
$2,840
Total itemized deductions: $14,662 (22% of AGI, reported on 18.5% of returns)
Here:
$14,662
State:
$17,065
Here:
22.2% of AGI
State:
19.5% of AGI
(% of AGI for various income ranges: 6.9% for AGIs $10k-25k, 6.8% for AGIs $25k-50k, 6.9% for AGIs $50k-75k, 10.1% for AGIs $75k-100k, 8.6% for AGIs over 100k)
Charity contributions deductions: $2,865 (4% of AGI, reported on 15.0% of returns)
Here:
$2,865
State:
$3,550
Here:
4.2% of AGI
State:
3.8% of AGI
(% of AGI for various income ranges: 0.8% for AGIs $10k-25k, 1.2% for AGIs $25k-50k, 1.1% for AGIs $50k-75k, 1.4% for AGIs $75k-100k, 1.8% for AGIs over 100k)
Total tax: $4,261 (reported on 73.5% of returns)
47850:
$4,261
State:
$6,914
(% of AGI for various income ranges: 2.8% for AGIs below $10k, 3.8% for AGIs $10k-25k, 5.8% for AGIs $25k-50k, 9.1% for AGIs $50k-75k, 10.5% for AGIs $75k-100k, 16.8% for AGIs over 100k)
Earned income credit: $1,574 (reported on 16.7% of returns)
Here:
$1,574
State:
$1,685
Percentage of individuals using paid preparers for their 2004 taxes: 65.9%
Here:
66%
State:
59%
(% for various income ranges: 58.8% for AGIs below $10k, 66.1% for AGIs $10k-25k, 67.4% for AGIs $25k-50k, 71.6% for AGIs $50k-75k, 68.5% for AGIs $75k-100k, 65.9% for AGIs over 100k)
Likely homosexual households (counted as self-reported same-sex unmarried-partner households)
Lesbian couples: 0.8% of all households
Gay men: 1.1% of all households
Household received Food Stamps/SNAP in the past 12 months: 115 Household did not receive Food Stamps/SNAP in the past 12 months: 834
Women who had a birth in the past 12 months: 20 (2 now married, 15 unmarried) Women who did not have a birth in the past 12 months: 390 (222 now married, 168 unmarried)
Housing units in zip code 47850 with a mortgage: 559 (92 second mortgage, 42 both second mortgage and home equity loan) Houses without a mortgage: 14
Median monthly owner costs for units with a mortgage: $1,078 Median monthly owner costs for units without a mortgage: $488
Residents with income below the poverty level in 2022:
This zip code:
12.3%
Whole state:
12.6%
Residents with income below 50% of the poverty level in 2022:
This zip code:
2.8%
Whole state:
6.3%
Median number of rooms in houses and condos:
Here:
6.5
State:
6.6
Median number of rooms in apartments:
Here:
6.7
State:
4.3
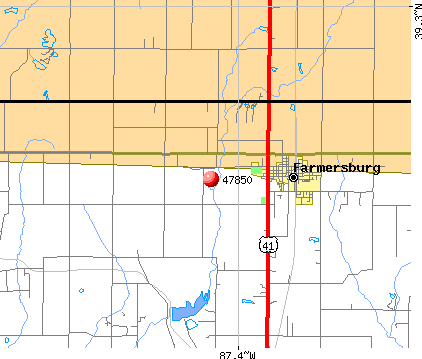
Notable locations in this zip code not listed on our city pages
Notable locations in zip code 47850: Prairie Creek Township Fire Department (A), Thunderbird Fire Protection Territory Station 1 Farmersburg (B). Display/hide their locations on the map
Churches in zip code 47850 include: Friendship Church (A), Liberty Church (B), Nye Chapel (C), Ebenezer Church (D), Sugar Grove Church (E). Display/hide their locations on the map
Cemeteries: West Prairie Creek Cemetery (1), West Lawn Cemetery (2), Ebenezer Cemetery (3), DeBaun Cemetery (4), Lykens Cemetery (5). Display/hide their locations on the map
Size of family households: 380 2-persons, 115 3-persons, 207 4-persons, 10 5-persons, 5 6-persons, 14 7-or-more-persons
Size of nonfamily households: 155 1-person, 55 2-persons
291 married couples with children.
90 single-parent households (67 men, 23 women).
98.8% of residents of 47850 zip code speak English at home.
0.2% of residents speak Spanish at home (100% very well).
0.4% of residents speak Asian or Pacific Island language at home (100% well).
Foreign born population: 17 (0.8%) (25.9% of them are naturalized citizens)
This zip code:
0.8%
Whole state:
6.1%
65%Singapore
35%American
16%English
11%European
10%German
8%Swedish
7%Irish
4%Scottish
Year of entry for the foreign-born population
02010 or later
122000 to 2009
01990 to 1999
6Before 1990
Facilities with environmental interests located in this zip code:
NORTH CENTRAL HIGH SCHOOL (910 E CR 975 N in FARMERSBURG, IN)
(Geographic Names Information System) (National Center for Education Statistics) - STATE ID-7917 Organizations: NORTHEAST SCHOOL CORP (SCHOOL DISTRICT)
Housing units lacking complete plumbing facilities: 1.6%
39.9%Utility gas
34.7%Electricity
20.2%Bottled, tank, or LP gas
3.5%Wood
2.0%Fuel oil, kerosene, etc.
Population in 1990: 335. Population change in the 1990s: +2,313 (+690.4%).
Place of birth for U.S.-born residents:
This state: 1,804
Northeast: 24
Midwest: 217
South: 172
West: 57
65% of the 47850 zip code residents lived in the same house 5 years ago. Out of people who lived in different houses, 53% lived in this county. Out of people who lived in different counties, 50% lived in Indiana.
96% of the 47850 zip code residents lived in the same house 1 year ago. Out of people who lived in different houses, 48% moved from this county. Out of people who lived in different houses, 65% moved from different county within same state.
Private vs. public school enrollment:
Students in private schools in grades 1 to 8 (elementary and middle school): 2
Here:
1.3%
Indiana:
14.9%
Students in private schools in grades 9 to 12 (high school): 5
Here:
3.2%
Indiana:
11.4%
Students in private undergraduate colleges: 7
Here:
14.3%
Indiana:
22.3%
Occupation by median earnings in the past 12 months ($)
88,965Computer and mathematical occupations
85,501Architecture and engineering occupations
67,855Management occupations
51,685Law enforcement workers including supervisors
50,803Construction and extraction occupations
49,943Installation, maintenance, and repair occupations
Companies with federal contracts located in this zip code:
ALSMAN INDUSTRIAL TRAINING AND (1028 E PRIVATE RD 1200 NOR in FARMERSBURG, IN; small business)
$8,750 with Army for Educational Services. Taking place in MD. Signed on 2002-07-23. Completion date: 2002-08-31.
Top industries in this zip code by the number of employees in 2005:
Accommodation and Food Services: Snack and Nonalcoholic Beverage Bars (20-49: 1)
Accommodation and Food Services: Full-Service Restaurants (20-49: 1)
Professional, Scientific, and Technical Services: Environmental Consulting Services (10-19: 1)
Wholesale Trade: Petroleum Bulk Stations and Terminals (10-19: 1)
Other Services (except Public Administration): Commercial and Industrial Machinery and Equipment (except Automotive and Electronic) Repair and Maintenance (5-9: 1, 1-4: 1)
People in group quarters in 2000:
10 people in other noninstitutional group quarters
Fatal accident statistics in 2014:
Fatal accident count: 1
Vehicles involved in fatal accidents: 1
Fatal accidents caused by drunken drivers: 1
Fatalities: 1
Persons involved in fatal accidents: 1
Pedestrians involved in fatal accidents: 0
Fatal accident statistics in 2012:
Fatal accident count: 3
Vehicles involved in fatal accidents: 4
Fatal accidents caused by drunken drivers: 1
Fatalities: 3
Persons involved in fatal accidents: 7
Pedestrians involved in fatal accidents: 0
Home Mortgage Disclosure Act Aggregated Statistics For Year 2009 (Based on 2 partial tracts)
A) FHA, FSA/RHS & VA Home Purchase Loans
B) Conventional Home Purchase Loans
C) Refinancings
D) Home Improvement Loans
F) Non-occupant Loans on < 5 Family Dwellings (A B C & D)
G) Loans On Manufactured Home Dwelling (A B C & D)
Number
Average Value
Number
Average Value
Number
Average Value
Number
Average Value
Number
Average Value
Number
Average Value
LOANS ORIGINATED
2
$123,385
5
$94,832
19
$110,228
2
$55,945
1
$84,760
3
$60,810
APPLICATIONS APPROVED, NOT ACCEPTED
0
$0
0
$0
1
$74,420
1
$5,430
0
$0
0
$0
APPLICATIONS DENIED
1
$81,910
1
$138,500
10
$95,556
1
$21,710
0
$0
1
$33,850
APPLICATIONS WITHDRAWN
0
$0
1
$24,810
6
$119,380
1
$65,630
0
$0
1
$58,660
FILES CLOSED FOR INCOMPLETENESS
0
$0
0
$0
1
$153,230
0
$0
0
$0
0
$0
Aggregated Statistics For Year 2008 (Based on 2 partial tracts)
A) FHA, FSA/RHS & VA Home Purchase Loans
B) Conventional Home Purchase Loans
C) Refinancings
D) Home Improvement Loans
F) Non-occupant Loans on < 5 Family Dwellings (A B C & D)
G) Loans On Manufactured Home Dwelling (A B C & D)
Number
Average Value
Number
Average Value
Number
Average Value
Number
Average Value
Number
Average Value
Number
Average Value
LOANS ORIGINATED
2
$141,730
5
$122,378
9
$114,844
3
$38,070
1
$24,810
1
$60,470
APPLICATIONS APPROVED, NOT ACCEPTED
0
$0
2
$46,125
1
$91,470
0
$0
0
$0
1
$27,910
APPLICATIONS DENIED
1
$89,920
1
$114,470
13
$110,377
3
$29,200
0
$0
1
$74,420
APPLICATIONS WITHDRAWN
0
$0
1
$125,840
3
$142,980
0
$0
0
$0
0
$0
FILES CLOSED FOR INCOMPLETENESS
0
$0
0
$0
1
$197,160
0
$0
0
$0
0
$0
Aggregated Statistics For Year 2007 (Based on 2 partial tracts)
A) FHA, FSA/RHS & VA Home Purchase Loans
B) Conventional Home Purchase Loans
C) Refinancings
D) Home Improvement Loans
F) Non-occupant Loans on < 5 Family Dwellings (A B C & D)
G) Loans On Manufactured Home Dwelling (A B C & D)
Number
Average Value
Number
Average Value
Number
Average Value
Number
Average Value
Number
Average Value
Number
Average Value
LOANS ORIGINATED
1
$64,860
10
$100,182
16
$82,801
3
$55,987
1
$23,510
2
$52,455
APPLICATIONS APPROVED, NOT ACCEPTED
0
$0
1
$63,050
4
$104,975
1
$15,500
0
$0
0
$0
APPLICATIONS DENIED
0
$0
2
$131,010
11
$138,338
1
$40,050
1
$80,360
1
$67,700
APPLICATIONS WITHDRAWN
0
$0
1
$139,020
7
$139,941
0
$0
0
$0
0
$0
FILES CLOSED FOR INCOMPLETENESS
0
$0
1
$60,210
3
$164,947
0
$0
0
$0
0
$0
Aggregated Statistics For Year 2006 (Based on 2 partial tracts)
A) FHA, FSA/RHS & VA Home Purchase Loans
B) Conventional Home Purchase Loans
C) Refinancings
D) Home Improvement Loans
F) Non-occupant Loans on < 5 Family Dwellings (A B C & D)
G) Loans On Manufactured Home Dwelling (A B C & D)
Number
Average Value
Number
Average Value
Number
Average Value
Number
Average Value
Number
Average Value
Number
Average Value
LOANS ORIGINATED
1
$100,520
15
$113,162
14
$92,636
4
$17,895
2
$35,140
3
$56,677
APPLICATIONS APPROVED, NOT ACCEPTED
1
$46,770
2
$70,285
3
$85,960
0
$0
1
$21,190
1
$86,050
APPLICATIONS DENIED
1
$61,760
3
$78,210
13
$115,743
2
$50,905
1
$42,120
2
$36,045
APPLICATIONS WITHDRAWN
0
$0
1
$143,150
8
$121,610
1
$15,500
0
$0
0
$0
FILES CLOSED FOR INCOMPLETENESS
0
$0
0
$0
1
$106,720
0
$0
0
$0
0
$0
Aggregated Statistics For Year 2005 (Based on 2 partial tracts)
A) FHA, FSA/RHS & VA Home Purchase Loans
B) Conventional Home Purchase Loans
C) Refinancings
D) Home Improvement Loans
F) Non-occupant Loans on < 5 Family Dwellings (A B C & D)
G) Loans On Manufactured Home Dwelling (A B C & D)
Number
Average Value
Number
Average Value
Number
Average Value
Number
Average Value
Number
Average Value
Number
Average Value
LOANS ORIGINATED
1
$121,960
14
$108,953
18
$95,536
5
$45,324
1
$26,360
1
$84,760
APPLICATIONS APPROVED, NOT ACCEPTED
0
$0
2
$113,050
4
$94,768
1
$9,300
0
$0
0
$0
APPLICATIONS DENIED
1
$36,430
2
$126,230
14
$98,136
4
$31,202
0
$0
0
$0
APPLICATIONS WITHDRAWN
1
$40,050
2
$133,720
9
$116,280
3
$98,363
0
$0
0
$0
FILES CLOSED FOR INCOMPLETENESS
0
$0
1
$87,600
2
$100,520
0
$0
0
$0
0
$0
Aggregated Statistics For Year 2004 (Based on 2 partial tracts)
A) FHA, FSA/RHS & VA Home Purchase Loans
B) Conventional Home Purchase Loans
C) Refinancings
D) Home Improvement Loans
F) Non-occupant Loans on < 5 Family Dwellings (A B C & D)
G) Loans On Manufactured Home Dwelling (A B C & D)
Number
Average Value
Number
Average Value
Number
Average Value
Number
Average Value
Number
Average Value
Number
Average Value
LOANS ORIGINATED
1
$69,250
11
$84,802
19
$93,677
3
$33,247
2
$81,395
2
$44,575
APPLICATIONS APPROVED, NOT ACCEPTED
0
$0
1
$21,450
5
$106,202
1
$9,300
0
$0
1
$30,230
APPLICATIONS DENIED
0
$0
2
$82,690
10
$98,890
3
$20,240
0
$0
1
$47,800
APPLICATIONS WITHDRAWN
0
$0
2
$76,615
5
$107,804
1
$44,190
0
$0
0
$0
FILES CLOSED FOR INCOMPLETENESS
0
$0
0
$0
1
$44,440
0
$0
0
$0
0
$0
Aggregated Statistics For Year 2003 (Based on 2 partial tracts)
A) FHA, FSA/RHS & VA Home Purchase Loans
B) Conventional Home Purchase Loans
C) Refinancings
D) Home Improvement Loans
F) Non-occupant Loans on < 5 Family Dwellings (A B C & D)
Number
Average Value
Number
Average Value
Number
Average Value
Number
Average Value
Number
Average Value
LOANS ORIGINATED
2
$90,050
13
$105,905
46
$98,046
5
$9,458
2
$69,250
APPLICATIONS APPROVED, NOT ACCEPTED
0
$0
2
$80,105
6
$79,760
0
$0
0
$0
APPLICATIONS DENIED
0
$0
3
$65,547
14
$87,838
1
$13,700
1
$100,000
APPLICATIONS WITHDRAWN
0
$0
1
$52,970
9
$90,784
0
$0
0
$0
FILES CLOSED FOR INCOMPLETENESS
0
$0
1
$21,190
1
$149,100
0
$0
0
$0
Aggregated Statistics For Year 2002 (Based on 2 partial tracts)
A) FHA, FSA/RHS & VA Home Purchase Loans
B) Conventional Home Purchase Loans
C) Refinancings
D) Home Improvement Loans
F) Non-occupant Loans on < 5 Family Dwellings (A B C & D)
Number
Average Value
Number
Average Value
Number
Average Value
Number
Average Value
Number
Average Value
LOANS ORIGINATED
3
$91,733
9
$96,613
44
$93,893
7
$15,541
2
$67,440
APPLICATIONS APPROVED, NOT ACCEPTED
0
$0
1
$72,350
5
$93,800
1
$3,620
0
$0
APPLICATIONS DENIED
0
$0
2
$91,605
10
$78,528
1
$10,590
0
$0
APPLICATIONS WITHDRAWN
0
$0
1
$68,990
8
$91,021
1
$6,460
0
$0
FILES CLOSED FOR INCOMPLETENESS
0
$0
0
$0
2
$75,195
0
$0
0
$0
Aggregated Statistics For Year 2001 (Based on 2 partial tracts)
A) FHA, FSA/RHS & VA Home Purchase Loans
B) Conventional Home Purchase Loans
C) Refinancings
D) Home Improvement Loans
F) Non-occupant Loans on < 5 Family Dwellings (A B C & D)
Number
Average Value
Number
Average Value
Number
Average Value
Number
Average Value
Number
Average Value
LOANS ORIGINATED
2
$98,190
10
$95,892
32
$89,980
9
$10,910
2
$111,110
APPLICATIONS APPROVED, NOT ACCEPTED
0
$0
1
$84,760
4
$58,785
1
$22,220
0
$0
APPLICATIONS DENIED
1
$40,310
4
$75,582
16
$71,351
3
$16,623
1
$32,300
APPLICATIONS WITHDRAWN
0
$0
2
$81,140
12
$92,055
1
$13,180
0
$0
FILES CLOSED FOR INCOMPLETENESS
0
$0
0
$0
2
$93,540
0
$0
0
$0
Aggregated Statistics For Year 2000 (Based on 2 partial tracts)
A) FHA, FSA/RHS & VA Home Purchase Loans
B) Conventional Home Purchase Loans
C) Refinancings
D) Home Improvement Loans
F) Non-occupant Loans on < 5 Family Dwellings (A B C & D)
Number
Average Value
Number
Average Value
Number
Average Value
Number
Average Value
Number
Average Value
LOANS ORIGINATED
1
$37,730
11
$93,846
14
$83,943
9
$11,312
2
$82,430
APPLICATIONS APPROVED, NOT ACCEPTED
0
$0
1
$74,680
4
$67,830
2
$23,255
0
$0
APPLICATIONS DENIED
0
$0
3
$56,247
8
$60,821
3
$9,647
0
$0
APPLICATIONS WITHDRAWN
0
$0
1
$32,820
7
$64,157
1
$30,490
0
$0
FILES CLOSED FOR INCOMPLETENESS
0
$0
0
$0
0
$0
0
$0
0
$0
Aggregated Statistics For Year 1999 (Based on 1 partial tract)
B) Conventional Home Purchase Loans
C) Refinancings
D) Home Improvement Loans
F) Non-occupant Loans on < 5 Family Dwellings (A B C & D)
Detailed PMIC statistics for the following Tracts:0110.00
2002 - 2016 National Fire Incident Reporting System (NFIRS) incidents
According to the data from the years 2002 - 2016 the average number of fires per year is 16. The highest number of fires - 47 took place in 2003, and the least - 0 in 2013. The data has a constant trend.
When looking into fire subcategories, the most reports belonged to: Structure Fires (44.3%), and Outside Fires (37.1%).
Fire incident types reported to NFIRS in Zip Code 47850


+$2,200
-$2,212
 Nearest zip codes: 47869, 47879, 47802, 47866, 47849, 47855.


 According to the data from the years 2002 - 2016 the average number of fires per year is 16. The highest number of fires - 47 took place in 2003, and the least - 0 in 2013. The data has a constant trend.
 When looking into fire subcategories, the most reports belonged to: Structure Fires (44.3%), and Outside Fires (37.1%).