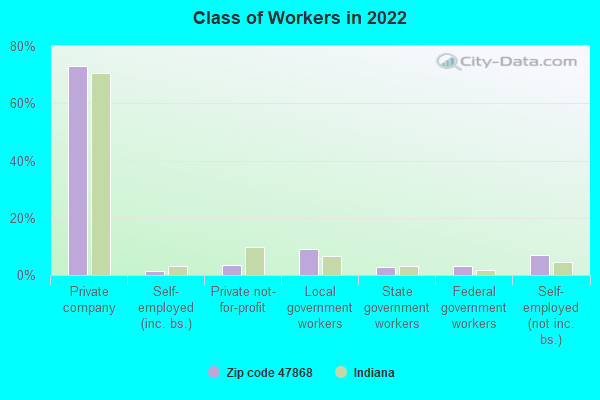
Estimated zip code population in 2022: 2,710 Zip code population in 2010: 2,937 Zip code population in 2000: 3,212
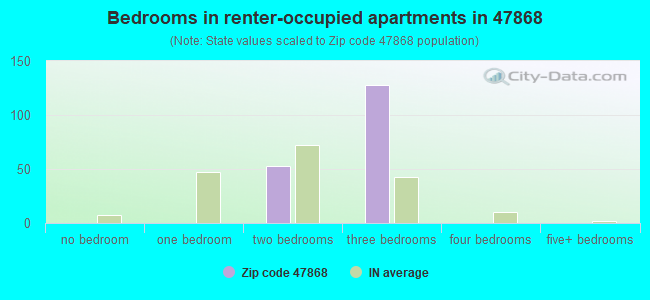
Houses and condos: 1,528 Renter-occupied apartments: 184
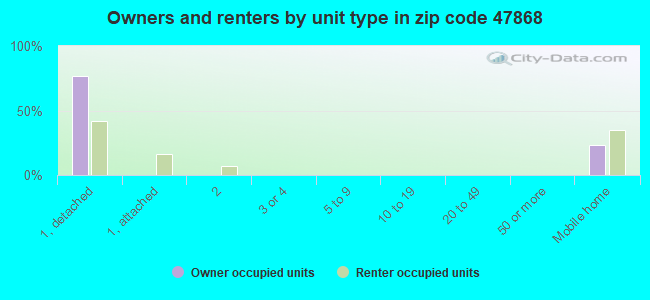
% of renters here:
16%
State:
29%
March 2022 cost of living index in zip code 47868: 86.4 (less than average, U.S. average is 100)
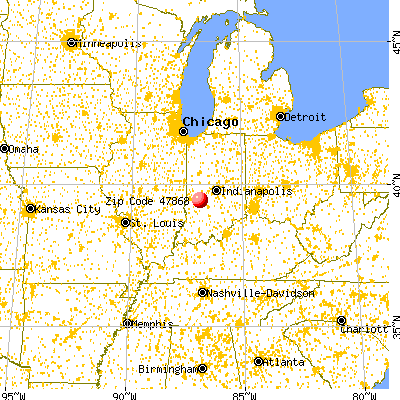
Land area: 58.1 sq. mi. Water area: 1.6 sq. mi.
Population density: 47 people per square mile
(very low).
OSM Map
General Map
Google Map
MSN Map
OSM Map
General Map
Google Map
MSN Map
OSM Map
General Map
Google Map
MSN Map
OSM Map
General Map
Google Map
MSN Map
Please wait while loading the map...
Real estate property taxes paid for housing units in 2022:
This zip code:
0.5% ($827)
Indiana:
0.7% ($1,467)
Median real estate property taxes paid for housing units with mortgages in 2022: $1,032 (0.6%) Median real estate property taxes paid for housing units with no mortgage in 2022: $717 (0.6%)
Business Search- 14 Million verified businesses
Males: 1,433
(52.9%)
Females: 1,276
(47.1%)
For population 25 years and over in 47868:
High school or higher: 88.9%
Bachelor's degree or higher: 12.2%
Graduate or professional degree: 3.3%
Unemployed: 6.6%
Mean travel time to work (commute): 44.7 minutes
For population 15 years and over in 47868:
Never married: 19.5%
Now married: 59.3%
Separated: 1.6%
Widowed: 8.9%
Divorced: 10.6%
Zip code 47868 compared to state average:
Unemployed percentage above state average.
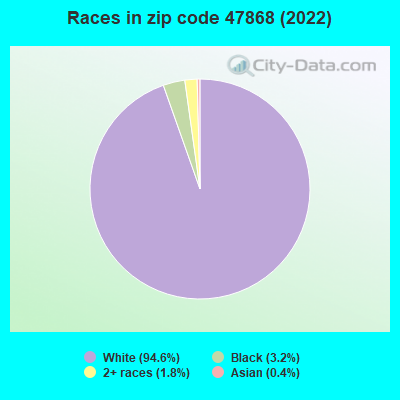
Black race population percentage significantly below state average.
Hispanic race population percentage significantly below state average.
Median age above state average.
Foreign-born population percentage significantly below state average.
Renting percentage below state average.
Length of stay since moving in significantly above state average.
Number of college students below state average.
Percentage of population with a bachelor's degree or higher significantly below state average.
Estimated median house/condo value in 2022: $167,096
47868:
$167,096
Indiana:
$208,700
Median resident age:
This zip code:
43.8 years
Indiana median age:
38.2 years
Average household size:
This zip code:
2.3 people
Indiana:
2.4 people
Averages for the 2020 tax year for zip code 47868, filed in 2021:
Average Adjusted Gross Income (AGI) in 2020: $48,815 (Individual Income Tax Returns)
Here:
$48,815
State:
$64,978
Salary/wage: $45,739 (reported on 79.7% of returns)
Here:
$45,739
State:
$55,245
(% of AGI for various income ranges: 932.8% for AGIs below $25k, 3595.6% for AGIs $25k-50k, 6506.2% for AGIs $50k-75k, 8460.0% for AGIs $75k-100k, 16405.0% for AGIs $100k-200k)
Taxable interest for individuals: $459 (reported on 22.0% of returns)
This zip code:
$459
Indiana:
$1,351
(% of AGI for various income ranges: 11.4% for AGIs below $25k, 8.8% for AGIs $25k-50k, 25.4% for AGIs $50k-75k, 21.1% for AGIs $75k-100k, 9.0% for AGIs $100k-200k)
Ordinary dividends: $1,255 (reported on 8.9% of returns)
Here:
$1,255
State:
$5,827
(% of AGI for various income ranges: 7.2% for AGIs below $25k, 5.6% for AGIs $25k-50k, 20.8% for AGIs $50k-75k, 71.0% for AGIs $100k-200k)
Net capital gain/loss in AGI: +$6,058 (reported on 9.8% of returns)
Here:
+$6,058
State:
+$17,730
(% of AGI for various income ranges: 9.7% for AGIs below $25k, 20.4% for AGIs $25k-50k, 148.5% for AGIs $50k-75k, 448.0% for AGIs $100k-200k)
Profit/loss from business: +$6,844 (reported on 13.0% of returns)
Here:
+$6,844
State:
+$12,144
(% of AGI for various income ranges: 90.0% for AGIs below $25k, 66.4% for AGIs $25k-50k, 216.2% for AGIs $50k-75k, 324.0% for AGIs $100k-200k)
Taxable individual retirement arrangement distribution: $15,860 (reported on 8.1% of returns)
47868:
$15,860
Indiana:
$18,302
(% of AGI for various income ranges: 87.2% for AGIs below $25k, 124.8% for AGIs $25k-50k, 1066.7% for AGIs $75k-100k)
Total itemized deductions: $21,700 (reported on 2.4% of returns)
Here:
$21,700
State:
$35,601
(% of AGI for various income ranges: 723.3% for AGIs $75k-100k)
Charity contributions: $4,950 (reported on 1.6% of returns)
Here:
$4,950
State:
$15,596
(% of AGI for various income ranges: 76.2% for AGIs $50k-75k)
Taxes paid: $6,767 (reported on 2.4% of returns)
47868:
$6,767
State:
$7,542
(% of AGI for various income ranges: 225.6% for AGIs $75k-100k)
Earned income credit: $2,168 (reported on 20.3% of returns)
Here:
$2,168
State:
$2,298
(% of AGI for various income ranges: 101.1% for AGIs below $25k, 71.2% for AGIs $25k-50k)
Percentage of individuals using paid preparers for their 2020 taxes: 95.1%
Here:
95%
State:
94%
(% for various income ranges: 93.6% for AGIs below $25k, 96.9% for AGIs $25k-50k, 94.4% for AGIs $50k-75k, 100.0% for AGIs $75k-100k, 93.3% for AGIs $100k-200k)
Averages for the 2012 tax year for zip code 47868, filed in 2013:
Average Adjusted Gross Income (AGI) in 2012: $37,140 (Individual Income Tax Returns)
Here:
$37,140
State:
$52,932
Salary/wage: $34,287 (reported on 82.3% of returns)
Here:
$34,287
State:
$45,173
(% of AGI for various income ranges: 63.6% for AGIs below $25k, 77.4% for AGIs $25k-50k, 80.8% for AGIs $50k-75k, 81.5% for AGIs $75k-100k, 73.3% for AGIs $100k-200k)
Taxable interest for individuals: $716 (reported on 20.2% of returns)
This zip code:
$716
Indiana:
$1,311
(% of AGI for various income ranges: 1.3% for AGIs below $25k, 0.2% for AGIs $25k-50k, 0.5% for AGIs $75k-100k, 0.2% for AGIs $100k-200k)
Ordinary dividends: $1,200 (reported on 7.3% of returns)
Here:
$1,200
State:
$4,690
(% of AGI for various income ranges: 0.5% for AGIs $25k-50k, 0.7% for AGIs $75k-100k)
Net capital gain/loss in AGI: +$5,989 (reported on 7.3% of returns)
Here:
+$5,989
State:
+$10,406
(% of AGI for various income ranges: 0.1% for AGIs $25k-50k, 0.5% for AGIs $50k-75k, 6.5% for AGIs $75k-100k)
Profit/loss from business: +$7,069 (reported on 12.9% of returns)
Here:
+$7,069
State:
+$11,105
(% of AGI for various income ranges: 8.4% for AGIs below $25k, 2.4% for AGIs $25k-50k, 1.5% for AGIs $50k-75k, 1.7% for AGIs $75k-100k)
Taxable individual retirement arrangement distribution: $11,388 (reported on 6.5% of returns)
47868:
$11,388
Indiana:
$13,841
Total itemized deductions: $17,796 (24% of AGI, reported on 18.5% of returns)
Here:
$17,796
State:
$20,913
Here:
23.8% of AGI
State:
18.2% of AGI
(% of AGI for various income ranges: 5.6% for AGIs below $25k, 5.8% for AGIs $25k-50k, 9.8% for AGIs $50k-75k, 10.8% for AGIs $75k-100k, 12.1% for AGIs $100k-200k)
Charity contributions: $2,513 (reported on 12.1% of returns)
Here:
$2,513
State:
$4,697
(% of AGI for various income ranges: 0.5% for AGIs $25k-50k, 1.1% for AGIs $50k-75k, 1.0% for AGIs $75k-100k, 1.3% for AGIs $100k-200k)
Taxes paid: $4,991 (reported on 18.5% of returns)
47868:
$4,991
State:
$7,456
(% of AGI for various income ranges: 0.7% for AGIs below $25k, 1.0% for AGIs $25k-50k, 2.6% for AGIs $50k-75k, 3.4% for AGIs $75k-100k, 4.5% for AGIs $100k-200k)
Earned income credit: $2,157 (reported on 24.2% of returns)
Here:
$2,157
State:
$2,265
(% of AGI for various income ranges: 7.2% for AGIs below $25k, 1.4% for AGIs $25k-50k)
Percentage of individuals using paid preparers for their 2012 taxes: 55.6%
Here:
56%
State:
53%
(% for various income ranges: 50.8% for AGIs below $25k, 60.0% for AGIs $25k-50k, 66.7% for AGIs $50k-75k, 55.6% for AGIs $75k-100k, 50.0% for AGIs $100k-200k)
Averages for the 2004 tax year for zip code 47868, filed in 2005:
Average Adjusted Gross Income (AGI) in 2004: $33,894 (Individual Income Tax Returns)
Here:
$33,894
State:
$44,790
Salary/wage: $32,443 (reported on 86.7% of returns)
Here:
$32,443
State:
$39,615
(% of AGI for various income ranges: 112.8% for AGIs below $10k, 74.4% for AGIs $10k-25k, 81.0% for AGIs $25k-50k, 86.9% for AGIs $50k-75k, 83.8% for AGIs $75k-100k, 82.0% for AGIs over 100k)
Taxable interest for individuals: $1,014 (reported on 29.9% of returns)
This zip code:
$1,014
Indiana:
$1,535
(% of AGI for various income ranges: 5.5% for AGIs below $10k, 1.6% for AGIs $10k-25k, 1.1% for AGIs $25k-50k, 0.2% for AGIs $50k-75k, 0.9% for AGIs $75k-100k, 0.3% for AGIs over 100k)
Taxable dividends: $690 (reported on 9.4% of returns)
Here:
$690
State:
$2,998
(% of AGI for various income ranges: 0.6% for AGIs below $10k, 0.3% for AGIs $10k-25k, 0.3% for AGIs $25k-50k, 0.1% for AGIs $50k-75k, 0.1% for AGIs $75k-100k, 0.0% for AGIs over 100k)
Net capital gain/loss: +$2,262 (reported on 8.5% of returns)
Here:
+$2,262
State:
+$8,619
(% of AGI for various income ranges: 1.4% for AGIs $10k-25k, -0.0% for AGIs $25k-50k, 0.2% for AGIs $50k-75k, 2.0% for AGIs $75k-100k)
Profit/loss from business: +$4,356 (reported on 13.3% of returns)
Here:
+$4,356
State:
+$10,071
(% of AGI for various income ranges: 26.1% for AGIs below $10k, 3.6% for AGIs $10k-25k, 2.2% for AGIs $25k-50k, -0.3% for AGIs $50k-75k, 0.6% for AGIs $75k-100k)
IRA payment deduction: $1,467 (reported on 1.2% of returns)
47868:
$1,467
Indiana:
$2,840
Total itemized deductions: $14,544 (24% of AGI, reported on 23.8% of returns)
Here:
$14,544
State:
$17,065
Here:
23.5% of AGI
State:
19.5% of AGI
(% of AGI for various income ranges: 6.3% for AGIs $10k-25k, 7.2% for AGIs $25k-50k, 12.2% for AGIs $50k-75k, 13.6% for AGIs $75k-100k, 15.0% for AGIs over 100k)
Charity contributions deductions: $1,985 (3% of AGI, reported on 16.6% of returns)
Here:
$1,985
State:
$3,550
Here:
3.0% of AGI
State:
3.8% of AGI
(% of AGI for various income ranges: 1.1% for AGIs below $10k, 0.6% for AGIs $25k-50k, 0.9% for AGIs $50k-75k, 1.5% for AGIs $75k-100k, 2.4% for AGIs over 100k)
Total tax: $3,844 (reported on 72.0% of returns)
47868:
$3,844
State:
$6,914
(% of AGI for various income ranges: 4.4% for AGIs below $10k, 3.4% for AGIs $10k-25k, 6.1% for AGIs $25k-50k, 8.7% for AGIs $50k-75k, 11.0% for AGIs $75k-100k, 14.4% for AGIs over 100k)
Earned income credit: $1,734 (reported on 20.0% of returns)
Here:
$1,734
State:
$1,685
Percentage of individuals using paid preparers for their 2004 taxes: 62.3%
Here:
62%
State:
59%
(% for various income ranges: 52.9% for AGIs below $10k, 66.5% for AGIs $10k-25k, 60.5% for AGIs $25k-50k, 63.5% for AGIs $50k-75k, 75.6% for AGIs $75k-100k, 73.0% for AGIs over 100k)
Likely homosexual households (counted as self-reported same-sex unmarried-partner households)
Lesbian couples: 0.6% of all households
Gay men: 0.0% of all households
Household received Food Stamps/SNAP in the past 12 months: 100 Household did not receive Food Stamps/SNAP in the past 12 months: 1,084
Women who had a birth in the past 12 months: 9 (10 now married, 0 unmarried) Women who did not have a birth in the past 12 months: 511 (265 now married, 246 unmarried)
Housing units in zip code 47868 with a mortgage: 524 (43 second mortgage, 45 both second mortgage and home equity loan) Median monthly owner costs for units with a mortgage: $1,124 Median monthly owner costs for units without a mortgage: $444
Residents with income below the poverty level in 2022:
This zip code:
20.2%
Whole state:
12.6%
Residents with income below 50% of the poverty level in 2022:
This zip code:
17.1%
Whole state:
6.3%
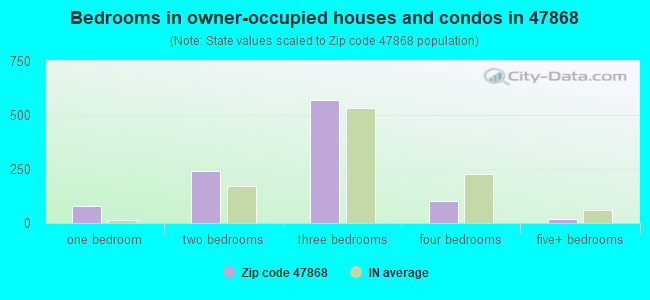
Median number of rooms in houses and condos:
Here:
6.0
State:
6.6
Median number of rooms in apartments:
Here:
5.6
State:
4.3
Notable locations in this zip code not listed on our city pages
Cemeteries: Wilkerson Cemetery (1), Spears Cemetery (2), Fertig Cemetery (3), Saint Walley Cemetery (4), Pleasant Grove Cemetery (5), Nier Cemetery (6), Cagle Cemetery (7). Display/hide their locations on the map
Size of family households: 491 2-persons, 122 3-persons, 64 4-persons, 120 5-persons, 22 6-persons
Size of nonfamily households: 354 1-person, 14 2-persons
420 married couples with children.
75 single-parent households (75 women).
98.3% of residents of 47868 zip code speak English at home.
0.3% of residents speak Spanish at home (100% very well).
0.7% of residents speak Asian or Pacific Island language at home (100% very well).
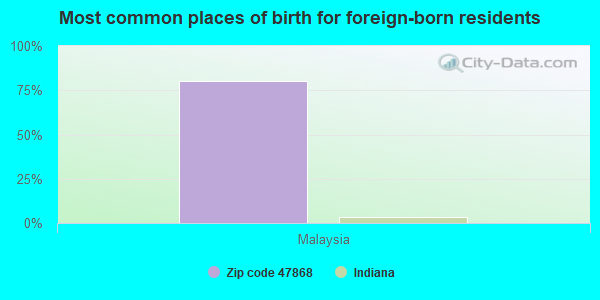
Foreign born population: 11 (0.4%) (100.0% of them are naturalized citizens)
This zip code:
0.4%
Whole state:
6.1%
80%Malaysia
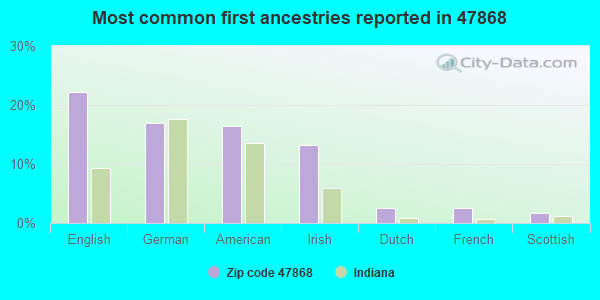
22%English
17%German
16%American
13%Irish
3%Dutch
2%French
2%Scottish
Year of entry for the foreign-born population
02010 or later
02000 to 2009
01990 to 1999
39Before 1990
Facilities with environmental interests located in this zip code:
FREEPORT MCMORAN RESOURCE PARTNERS (SR 42 SE in POLAND, IN)
STATE MASTER (Indiana facility tracking) Conditionally Exempt Small Quantity Generators, less than 100 kg/month of hazardous waste (Resource Conservation and Recovery Act (tracking hazardous waste))
HUNTER BODY SHOP & AUTO PARTS INC (9875 OWL HOLLOW RD in POLAND, IN)
STATE MASTER (Indiana facility tracking) Conditionally Exempt Small Quantity Generators, less than 100 kg/month of hazardous waste (Resource Conservation and Recovery Act (tracking hazardous waste)) - notification Organizations: JOHN HUNTER (CONTACT/OWNER)
Housing units lacking complete plumbing facilities: 7.2% Housing units lacking complete kitchen facilities: 5.6%
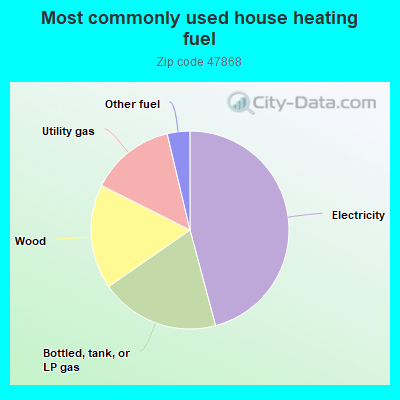
45.9%Electricity
19.5%Bottled, tank, or LP gas
17.1%Wood
13.9%Utility gas
3.7%Other fuel
Population in 1990: 292. Population change in the 1990s: +2,920 (+1000.0%).
Place of birth for U.S.-born residents:
This state: 2,292
Midwest: 250
South: 104
58% of the 47868 zip code residents lived in the same house 5 years ago. Out of people who lived in different houses, 21% lived in this county. Out of people who lived in different counties, 50% lived in Indiana.
90% of the 47868 zip code residents lived in the same house 1 year ago. Out of people who lived in different houses, 56% moved from this county. Out of people who lived in different houses, 36% moved from different county within same state. Out of people who lived in different houses, 6% moved from different state.
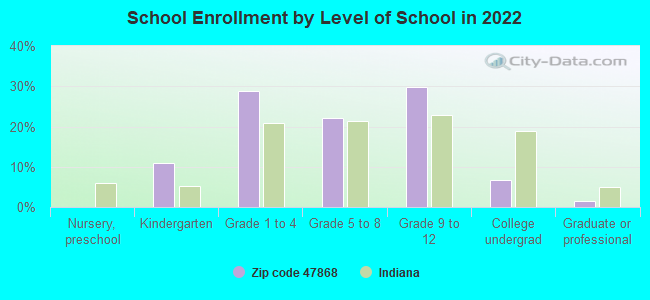
Private vs. public school enrollment:
Students in private schools in grades 1 to 8 (elementary and middle school): 55
Here:
17.3%
Indiana:
14.9%
Students in private schools in grades 9 to 12 (high school): 9
Here:
4.8%
Indiana:
11.4%
Students in private undergraduate colleges:
Here:
0.0%
Indiana:
22.3%
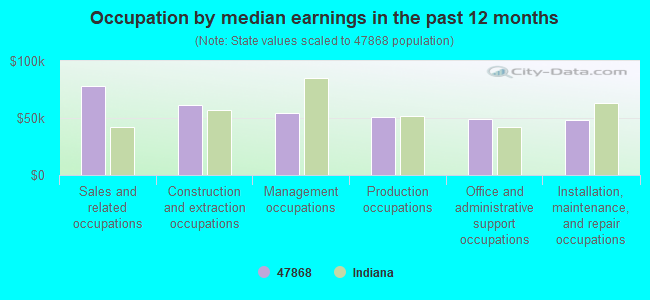
Occupation by median earnings in the past 12 months ($)
78,213Sales and related occupations
61,303Construction and extraction occupations
54,105Management occupations
50,780Production occupations
49,304Office and administrative support occupations
48,500Installation, maintenance, and repair occupations
Top industries in this zip code by the number of employees in 2005:
Other Services (except Public Administration): Automotive Body, Paint, and Interior Repair and Maintenance (5-9: 1)
Construction: New Single-Family Housing Construction (except Operative Builders) (1-4: 2)
Other Services (except Public Administration): Religious Organizations (1-4: 1)
Fatal accident statistics in 2014:
Fatal accident count: 1
Vehicles involved in fatal accidents: 1
Fatal accidents caused by drunken drivers: 0
Fatalities: 1
Persons involved in fatal accidents: 1
Pedestrians involved in fatal accidents: 0
Fatal accident statistics in 2011:
Fatal accident count: 2
Vehicles involved in fatal accidents: 2
Fatal accidents caused by drunken drivers: 1
Fatalities: 2
Persons involved in fatal accidents: 4
Pedestrians involved in fatal accidents: 1
2002 - 2018 National Fire Incident Reporting System (NFIRS) incidents
According to the data from the years 2002 - 2018 the average number of fires per year is 26. The highest number of fires - 61 took place in 2010, and the least - 5 in 2018. The data has a dropping trend.
When looking into fire subcategories, the most reports belonged to: Structure Fires (48.5%), and Outside Fires (38.2%).
Fire incident types reported to NFIRS in Zip Code 47868


 Nearest zip codes: 47833, 47455, 46171, 46120, 47840, 47460.


 According to the data from the years 2002 - 2018 the average number of fires per year is 26. The highest number of fires - 61 took place in 2010, and the least - 5 in 2018. The data has a dropping trend.
 When looking into fire subcategories, the most reports belonged to: Structure Fires (48.5%), and Outside Fires (38.2%).