Estimated zip code population in 2022: 2,698 Zip code population in 2010: 3,414 Zip code population in 2000: 3,500
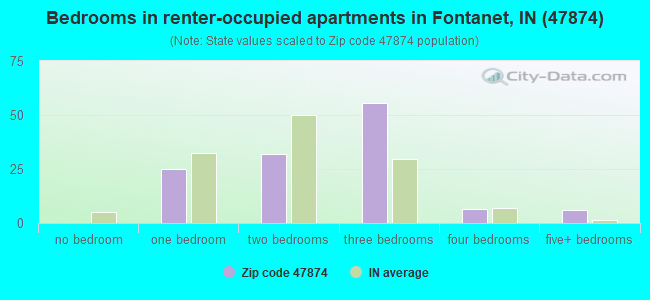
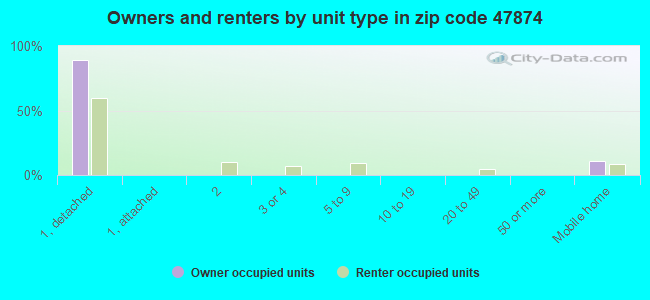
Houses and condos: 1,362 Renter-occupied apartments: 127
% of renters here:
11%
State:
29%
March 2022 cost of living index in zip code 47874: 83.8 (less than average, U.S. average is 100)
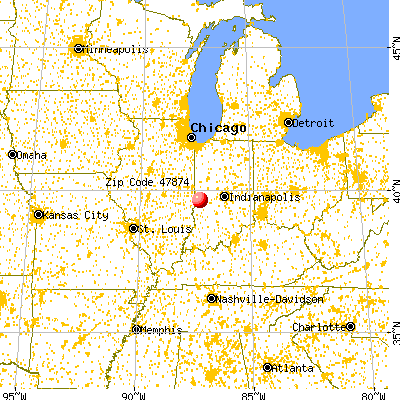
Land area: 68.8 sq. mi. Water area: 0.5 sq. mi.
Population density: 39 people per square mile
(very low).
OSM Map
General Map
Google Map
MSN Map
OSM Map
General Map
Google Map
MSN Map
OSM Map
General Map
Google Map
MSN Map
OSM Map
General Map
Google Map
MSN Map
Please wait while loading the map...
Real estate property taxes paid for housing units in 2022:
This zip code:
0.4% ($522)
Indiana:
0.7% ($1,467)
Median real estate property taxes paid for housing units with mortgages in 2022: $526 (0.4%) Median real estate property taxes paid for housing units with no mortgage in 2022: $527 (0.4%)
Business Search- 14 Million verified businesses
Males: 1,524
(56.5%)
Females: 1,173
(43.5%)
For population 25 years and over in 47874:
High school or higher: 95.8%
Bachelor's degree or higher: 15.7%
Graduate or professional degree: 3.7%
Unemployed: 4.4%
Mean travel time to work (commute): 30.1 minutes
For population 15 years and over in 47874:
Never married: 17.8%
Now married: 59.2%
Separated: 1.6%
Widowed: 7.8%
Divorced: 13.6%
Zip code 47874 compared to state average:
Median house value below state average.
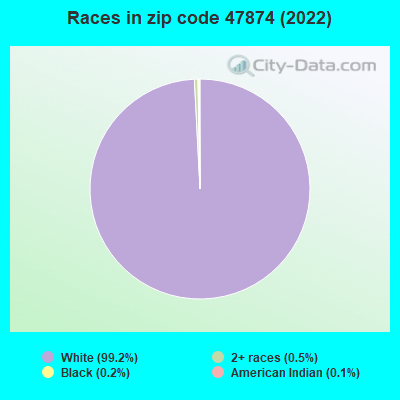
Black race population percentage significantly below state average.
Hispanic race population percentage significantly below state average.
Median age significantly above state average.
Foreign-born population percentage significantly below state average.
Renting percentage significantly below state average.
Length of stay since moving in significantly above state average.
Number of college students below state average.
Percentage of population with a bachelor's degree or higher below state average.
Estimated median house/condo value in 2022: $130,381
47874:
$130,381
Indiana:
$208,700
Median resident age:
This zip code:
48.3 years
Indiana median age:
38.2 years
Average household size:
This zip code:
2.3 people
Indiana:
2.4 people
Averages for the 2020 tax year for zip code 47874, filed in 2021:
Average Adjusted Gross Income (AGI) in 2020: $52,569 (Individual Income Tax Returns)
Here:
$52,569
State:
$64,978
Salary/wage: $48,849 (reported on 78.9% of returns)
Here:
$48,849
State:
$55,245
(% of AGI for various income ranges: 970.0% for AGIs below $25k, 3364.7% for AGIs $25k-50k, 6458.8% for AGIs $50k-75k, 8440.8% for AGIs $75k-100k, 14948.5% for AGIs $100k-200k)
Taxable interest for individuals: $539 (reported on 25.0% of returns)
This zip code:
$539
Indiana:
$1,351
(% of AGI for various income ranges: 5.6% for AGIs below $25k, 11.3% for AGIs $25k-50k, 10.6% for AGIs $50k-75k, 59.2% for AGIs $75k-100k, 41.5% for AGIs $100k-200k)
Ordinary dividends: $2,125 (reported on 13.2% of returns)
Here:
$2,125
State:
$5,827
(% of AGI for various income ranges: 21.3% for AGIs below $25k, 40.7% for AGIs $25k-50k, 35.9% for AGIs $50k-75k, 45.4% for AGIs $75k-100k, 76.9% for AGIs $100k-200k)
Net capital gain/loss in AGI: +$4,182 (reported on 11.2% of returns)
Here:
+$4,182
State:
+$17,730
(% of AGI for various income ranges: 17.9% for AGIs below $25k, 20.0% for AGIs $25k-50k, 42.4% for AGIs $50k-75k, 136.2% for AGIs $75k-100k, 255.4% for AGIs $100k-200k)
Profit/loss from business: +$6,300 (reported on 10.5% of returns)
Here:
+$6,300
State:
+$12,144
(% of AGI for various income ranges: 50.0% for AGIs below $25k, 50.3% for AGIs $25k-50k, 11.8% for AGIs $50k-75k, 100.8% for AGIs $75k-100k, 393.1% for AGIs $100k-200k)
Taxable individual retirement arrangement distribution: $12,300 (reported on 10.5% of returns)
47874:
$12,300
Indiana:
$18,302
(% of AGI for various income ranges: 68.5% for AGIs below $25k, 99.7% for AGIs $25k-50k, 237.1% for AGIs $50k-75k, 768.5% for AGIs $75k-100k)
Total itemized deductions: $28,675 (reported on 2.6% of returns)
Here:
$28,675
State:
$35,601
(% of AGI for various income ranges: 882.3% for AGIs $75k-100k)
Charity contributions: $8,633 (reported on 2.0% of returns)
Here:
$8,633
State:
$15,596
(% of AGI for various income ranges: 199.2% for AGIs $75k-100k)
Taxes paid: $7,275 (reported on 2.6% of returns)
47874:
$7,275
State:
$7,542
(% of AGI for various income ranges: 223.8% for AGIs $75k-100k)
Earned income credit: $2,180 (reported on 16.4% of returns)
Here:
$2,180
State:
$2,298
(% of AGI for various income ranges: 80.0% for AGIs below $25k, 77.7% for AGIs $25k-50k)
Percentage of individuals using paid preparers for their 2020 taxes: 96.1%
Here:
96%
State:
94%
(% for various income ranges: 96.2% for AGIs below $25k, 94.6% for AGIs $25k-50k, 95.7% for AGIs $50k-75k, 94.4% for AGIs $75k-100k, 100.0% for AGIs $100k-200k, 100.0% for AGIs over 200k)
Averages for the 2012 tax year for zip code 47874, filed in 2013:
Average Adjusted Gross Income (AGI) in 2012: $42,097 (Individual Income Tax Returns)
Here:
$42,097
State:
$52,932
Salary/wage: $39,214 (reported on 81.2% of returns)
Here:
$39,214
State:
$45,173
(% of AGI for various income ranges: 71.5% for AGIs below $25k, 74.1% for AGIs $25k-50k, 76.5% for AGIs $50k-75k, 79.9% for AGIs $75k-100k, 74.9% for AGIs $100k-200k)
Taxable interest for individuals: $872 (reported on 27.9% of returns)
This zip code:
$872
Indiana:
$1,311
(% of AGI for various income ranges: 1.0% for AGIs below $25k, 0.9% for AGIs $25k-50k, 0.4% for AGIs $50k-75k, 0.4% for AGIs $75k-100k, 0.4% for AGIs $100k-200k)
Ordinary dividends: $1,674 (reported on 14.9% of returns)
Here:
$1,674
State:
$4,690
(% of AGI for various income ranges: 1.1% for AGIs below $25k, 0.9% for AGIs $25k-50k, 0.5% for AGIs $50k-75k, 0.2% for AGIs $75k-100k, 0.5% for AGIs $100k-200k)
Net capital gain/loss in AGI: +$325 (reported on 10.4% of returns)
Here:
+$325
State:
+$10,406
(% of AGI for various income ranges: 0.3% for AGIs $50k-75k, 0.4% for AGIs $100k-200k)
Profit/loss from business: +$8,711 (reported on 11.7% of returns)
Here:
+$8,711
State:
+$11,105
(% of AGI for various income ranges: 3.8% for AGIs below $25k, 1.4% for AGIs $25k-50k, 1.3% for AGIs $50k-75k, 3.2% for AGIs $75k-100k, 3.1% for AGIs $100k-200k)
Taxable individual retirement arrangement distribution: $9,847 (reported on 11.0% of returns)
47874:
$9,847
Indiana:
$13,841
(% of AGI for various income ranges: 3.8% for AGIs below $25k, 2.9% for AGIs $25k-50k, 3.9% for AGIs $50k-75k, 3.1% for AGIs $75k-100k)
Total itemized deductions: $16,314 (22% of AGI, reported on 18.8% of returns)
Here:
$16,314
State:
$20,913
Here:
21.6% of AGI
State:
18.2% of AGI
(% of AGI for various income ranges: 4.3% for AGIs below $25k, 6.1% for AGIs $25k-50k, 6.7% for AGIs $50k-75k, 8.7% for AGIs $75k-100k, 9.3% for AGIs $100k-200k)
Charity contributions: $3,161 (reported on 11.7% of returns)
Here:
$3,161
State:
$4,697
(% of AGI for various income ranges: 0.7% for AGIs $25k-50k, 1.0% for AGIs $50k-75k, 1.1% for AGIs $75k-100k, 1.2% for AGIs $100k-200k)
Taxes paid: $5,179 (reported on 18.8% of returns)
47874:
$5,179
State:
$7,456
(% of AGI for various income ranges: 0.6% for AGIs below $25k, 1.1% for AGIs $25k-50k, 1.9% for AGIs $50k-75k, 2.9% for AGIs $75k-100k, 4.2% for AGIs $100k-200k)
Earned income credit: $2,080 (reported on 19.5% of returns)
Here:
$2,080
State:
$2,265
(% of AGI for various income ranges: 5.9% for AGIs below $25k, 1.1% for AGIs $25k-50k)
Percentage of individuals using paid preparers for their 2012 taxes: 67.5%
Here:
68%
State:
53%
(% for various income ranges: 64.1% for AGIs below $25k, 65.8% for AGIs $25k-50k, 65.4% for AGIs $50k-75k, 78.6% for AGIs $75k-100k, 83.3% for AGIs $100k-200k)
Averages for the 2004 tax year for zip code 47874, filed in 2005:
Average Adjusted Gross Income (AGI) in 2004: $34,740 (Individual Income Tax Returns)
Here:
$34,740
State:
$44,790
Salary/wage: $33,162 (reported on 85.7% of returns)
Here:
$33,162
State:
$39,615
(% of AGI for various income ranges: 101.9% for AGIs below $10k, 74.2% for AGIs $10k-25k, 81.0% for AGIs $25k-50k, 85.8% for AGIs $50k-75k, 87.6% for AGIs $75k-100k, 69.0% for AGIs over 100k)
Taxable interest for individuals: $1,136 (reported on 42.2% of returns)
This zip code:
$1,136
Indiana:
$1,535
(% of AGI for various income ranges: 5.8% for AGIs below $10k, 3.0% for AGIs $10k-25k, 1.6% for AGIs $25k-50k, 0.9% for AGIs $50k-75k, 0.3% for AGIs $75k-100k, 1.0% for AGIs over 100k)
Taxable dividends: $1,459 (reported on 17.1% of returns)
Here:
$1,459
State:
$2,998
(% of AGI for various income ranges: 3.1% for AGIs below $10k, 1.5% for AGIs $10k-25k, 1.0% for AGIs $25k-50k, 0.5% for AGIs $50k-75k, 0.1% for AGIs $75k-100k, 0.3% for AGIs over 100k)
Net capital gain/loss: +$2,380 (reported on 13.1% of returns)
Here:
+$2,380
State:
+$8,619
(% of AGI for various income ranges: 0.9% for AGIs below $10k, 1.6% for AGIs $10k-25k, 0.5% for AGIs $25k-50k, 0.6% for AGIs $50k-75k, 2.5% for AGIs $75k-100k, -0.3% for AGIs over 100k)
Profit/loss from business: +$4,453 (reported on 12.1% of returns)
Here:
+$4,453
State:
+$10,071
(% of AGI for various income ranges: 1.9% for AGIs below $10k, 2.0% for AGIs $10k-25k, 1.4% for AGIs $25k-50k, 2.2% for AGIs $50k-75k, 1.4% for AGIs $75k-100k)
Profit/loss from farming: +$197 (reported on 4.2% of returns)
Here:
+$197
State:
-$2,212
(% of AGI for various income ranges: 0.1% for AGIs below $10k, 0.1% for AGIs $25k-50k, 1.0% for AGIs $50k-75k, -1.9% for AGIs $75k-100k)
IRA payment deduction: $1,792 (reported on 1.5% of returns)
47874:
$1,792
Indiana:
$2,840
Total itemized deductions: $13,614 (22% of AGI, reported on 17.7% of returns)
Here:
$13,614
State:
$17,065
Here:
21.6% of AGI
State:
19.5% of AGI
(% of AGI for various income ranges: 6.6% for AGIs $10k-25k, 5.4% for AGIs $25k-50k, 7.4% for AGIs $50k-75k, 8.7% for AGIs $75k-100k, 9.0% for AGIs over 100k)
Charity contributions deductions: $2,100 (3% of AGI, reported on 13.3% of returns)
Here:
$2,100
State:
$3,550
Here:
3.1% of AGI
State:
3.8% of AGI
(% of AGI for various income ranges: 0.8% for AGIs $10k-25k, 0.6% for AGIs $25k-50k, 1.0% for AGIs $50k-75k, 0.9% for AGIs $75k-100k, 0.9% for AGIs over 100k)
Total tax: $4,053 (reported on 72.3% of returns)
47874:
$4,053
State:
$6,914
(% of AGI for various income ranges: 1.8% for AGIs below $10k, 3.6% for AGIs $10k-25k, 6.3% for AGIs $25k-50k, 8.8% for AGIs $50k-75k, 10.3% for AGIs $75k-100k, 16.2% for AGIs over 100k)
Earned income credit: $1,764 (reported on 13.6% of returns)
Here:
$1,764
State:
$1,685
Percentage of individuals using paid preparers for their 2004 taxes: 67.0%
Here:
67%
State:
59%
(% for various income ranges: 55.1% for AGIs below $10k, 68.6% for AGIs $10k-25k, 72.9% for AGIs $25k-50k, 69.6% for AGIs $50k-75k, 69.2% for AGIs $75k-100k, 70.0% for AGIs over 100k)
Household received Food Stamps/SNAP in the past 12 months: 51 Household did not receive Food Stamps/SNAP in the past 12 months: 1,120
Women who had a birth in the past 12 months: 6 (6 now married, 0 unmarried) Women who did not have a birth in the past 12 months: 480 (273 now married, 208 unmarried)
Housing units in zip code 47874 with a mortgage: 665 (82 second mortgage, 84 both second mortgage and home equity loan) Houses without a mortgage: 37
Median monthly owner costs for units with a mortgage: $949 Median monthly owner costs for units without a mortgage: $433
Residents with income below the poverty level in 2022:
This zip code:
9.0%
Whole state:
12.6%
Residents with income below 50% of the poverty level in 2022:
This zip code:
4.5%
Whole state:
6.3%
Median number of rooms in houses and condos:
Here:
6.2
State:
6.6
Median number of rooms in apartments:
Here:
5.0
State:
4.3
Notable locations in this zip code not listed on our city pages
Notable locations in zip code 47874: Bridgeton Fire Department (A), Bridgeton Volunteer Fire Department (B), Rosedale Volunteer Fire Department (C), Lyford Volunteer Fire Department (D), Nevins Township Volunteer Fire Department (E). Display/hide their locations on the map
Streams, rivers, and creeks: Little Creek (A), Hopper Branch (B), Spring Creek (C), Sulphur Branch (D), Jeffries Run (E), Otter Creek (F), Gold Run (G), Ford Run (H), Flo Run (I). Display/hide their locations on the map
Size of family households: 403 2-persons, 248 3-persons, 78 4-persons, 35 5-persons, 14 6-persons, 8 7-or-more-persons
Size of nonfamily households: 361 1-person, 26 2-persons
349 married couples with children.
177 single-parent households (102 men, 75 women).
97.9% of residents of 47874 zip code speak English at home.
2.0% of residents speak other Indo-European language at home (100% very well).
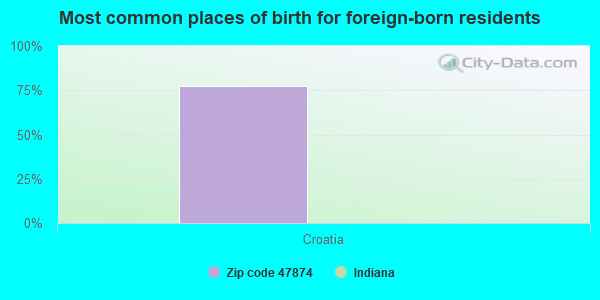
Foreign born population: 41 (1.5%) (89.7% of them are naturalized citizens)
This zip code:
1.5%
Whole state:
6.1%
78%Croatia
24%German
16%American
14%English
11%European
6%Irish
3%Scotch-Irish
2%French
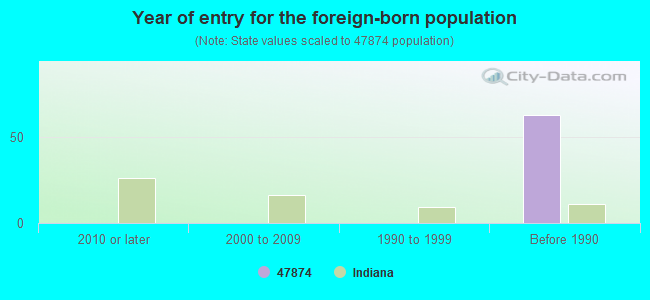
Year of entry for the foreign-born population
02010 or later
02000 to 2009
01990 to 1999
63Before 1990
Facilities with environmental interests located in this zip code:
ROSEDALE MUNICIPAL SEWAGE TREATMENT PLANT (413 NORTH CEMETERY STREET in ROSEDALE, IN)
STATE MASTER (Indiana facility tracking) - CRTK-7023, EPCRA National Pollutant Discharge Elimination System NON-MAJOR (Tracking pollutant discharge elimination systems) - permit Business SIC classification: SEWERAGE SYSTEMS Organizations: JERRY LEITGABEL CERT OPER (CONTACT/OPERATOR)
, ROSEDALE TOWN HALL (CONTACT/OWNER)
Alternative names: ROSEDALE MUNICIPAL STP, ROSEDALE MUNICIPAL WWTP
SCHOPMEYER FARM SUPPLY COMPANY INCORPORATED (330 NORTH MAIN in ROSEDALE, IN)
ROSEDALE ELEMENTARY SCHOOL (707 E CENTRAL in ROSEDALE, IN)
(National Center for Education Statistics) - STATE ID-6621 Organizations: SOUTHWEST PARKE COM SCH CORP (SCHOOL DISTRICT)
MARATHON ASHLAND PIPE LINE LLC (CO RD 550 W in ROSEDALE, IN)
STATE MASTER (Indiana facility tracking) Conditionally Exempt Small Quantity Generators, less than 100 kg/month of hazardous waste (Resource Conservation and Recovery Act (tracking hazardous waste)) Organizations: MARATHON PIPE LINE LLC (CONTACT/OPERATOR)
, MARATHON PETROLEUM COMPANY LLC (CONTACT/OWNER)
COAL BLUFF LANDFILL (COAL BLUFF ROAD in COAL BLUFF, IN)
STATE MASTER (Indiana facility tracking) CRITERIA AND HAZARDOUS AIR POLLUTANT INVENTORY (Inventory of air pollution sources) Business SIC classification: REFUSE SYSTEMS Business NAICS classification: SOLID WASTE LANDFILL.
DANA FERTILIZER (PO BOX 529 in DANA, IN)
COMPLIANCE ACTIVITY (Tracking inspections of insecticide, fungicide, and rodenticide, and toxic substances)
SCHOPMEYER FARM SUP INC (330 N MAIN ST in ROSEDALE, IN)
COMPLIANCE ACTIVITY (Tracking inspections of insecticide, fungicide, and rodenticide, and toxic substances)
Housing units lacking complete plumbing facilities: 2.1% Housing units lacking complete kitchen facilities: 2.9%
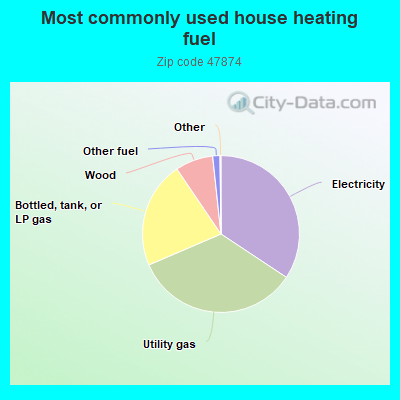
34.4%Electricity
34.3%Utility gas
22.0%Bottled, tank, or LP gas
7.8%Wood
1.5%Other fuel
Population in 1990: 3,463. Population change in the 1990s: +37 (+1.1%).
Place of birth for U.S.-born residents:
This state: 2,134
Northeast: 69
Midwest: 315
South: 55
West: 44
73% of the 47874 zip code residents lived in the same house 5 years ago. Out of people who lived in different houses, 33% lived in this county. Out of people who lived in different counties, 50% lived in Indiana.
92% of the 47874 zip code residents lived in the same house 1 year ago. Out of people who lived in different houses, 48% moved from this county. Out of people who lived in different houses, 26% moved from different county within same state. Out of people who lived in different houses, 29% moved from different state.
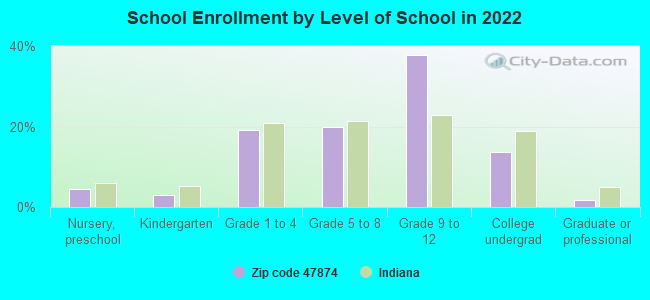
Private vs. public school enrollment:
Students in private schools in grades 1 to 8 (elementary and middle school): 24
Here:
13.4%
Indiana:
14.9%
Students in private schools in grades 9 to 12 (high school): 35
Here:
20.0%
Indiana:
11.4%
Students in private undergraduate colleges: 4
Here:
7.4%
Indiana:
22.3%
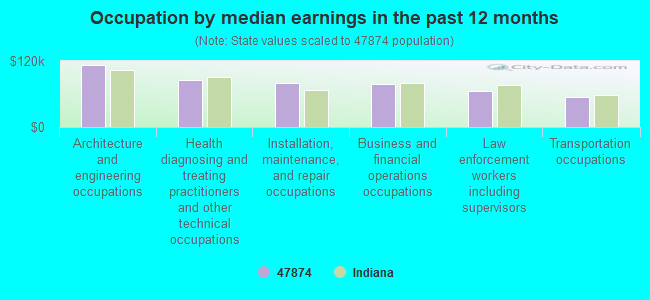
Occupation by median earnings in the past 12 months ($)
112,074Architecture and engineering occupations
85,208Health diagnosing and treating practitioners and other technical occupations
79,584Installation, maintenance, and repair occupations
77,750Business and financial operations occupations
65,768Law enforcement workers including supervisors
54,193Transportation occupations
Top industries in this zip code by the number of employees in 2005:
Construction: Site Preparation Contractors (20-49 employees: 1 establishment)
Accommodation and Food Services: Full-Service Restaurants (5-9: 2)
Construction: New Single-Family Housing Construction (except Operative Builders) (1-4: 4)
Accommodation and Food Services: Food Service Contractors (5-9: 1)
Finance and Insurance: Insurance Agencies and Brokerages (5-9: 1)
Construction: Water and Sewer Line and Related Structures Construction (5-9: 1)
Other Services (except Public Administration): Religious Organizations (1-4: 3)
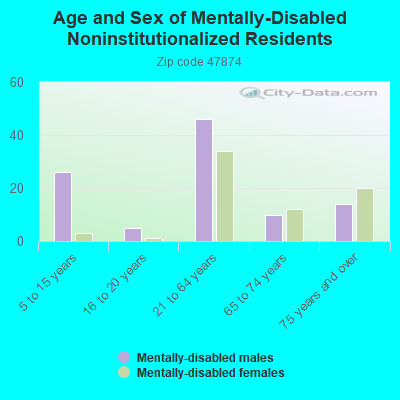
People in group quarters in 2000:
26 people in homes for the mentally retarded
Fatal accident statistics in 2014:
Fatal accident count: 2
Vehicles involved in fatal accidents: 4
Fatal accidents caused by drunken drivers: 0
Fatalities: 2
Persons involved in fatal accidents: 5
Pedestrians involved in fatal accidents: 0
Fatal accident statistics in 2013:
Fatal accident count: 1
Vehicles involved in fatal accidents: 1
Fatal accidents caused by drunken drivers: 0
Fatalities: 1
Persons involved in fatal accidents: 3
Pedestrians involved in fatal accidents: 0
Home Mortgage Disclosure Act Aggregated Statistics For Year 2009 (Based on 2 partial tracts)
A) FHA, FSA/RHS & VA Home Purchase Loans
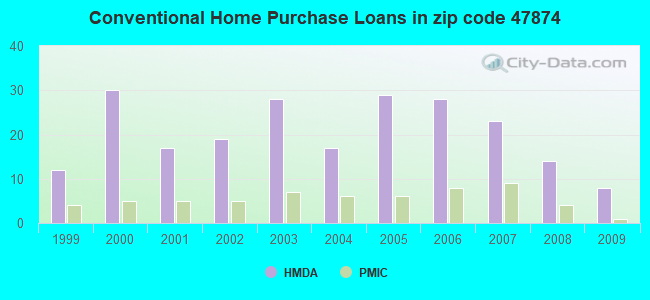
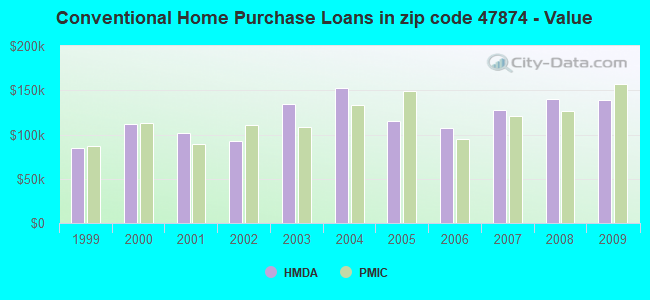
B) Conventional Home Purchase Loans
C) Refinancings
D) Home Improvement Loans
F) Non-occupant Loans on < 5 Family Dwellings (A B C & D)
G) Loans On Manufactured Home Dwelling (A B C & D)
Number
Average Value
Number
Average Value
Number
Average Value
Number
Average Value
Number
Average Value
Number
Average Value
LOANS ORIGINATED
7
$124,193
8
$139,161
44
$137,769
4
$34,568
3
$87,520
2
$54,090
APPLICATIONS APPROVED, NOT ACCEPTED
0
$0
1
$83,820
1
$253,250
0
$0
0
$0
0
$0
APPLICATIONS DENIED
1
$49,070
4
$98,325
20
$115,556
3
$19,343
1
$60,540
1
$48,720
APPLICATIONS WITHDRAWN
1
$114,980
2
$108,715
14
$138,137
0
$0
0
$0
0
$0
FILES CLOSED FOR INCOMPLETENESS
0
$0
1
$34,030
2
$154,205
0
$0
0
$0
0
$0
Aggregated Statistics For Year 2008 (Based on 2 partial tracts)
A) FHA, FSA/RHS & VA Home Purchase Loans
B) Conventional Home Purchase Loans
C) Refinancings
D) Home Improvement Loans
F) Non-occupant Loans on < 5 Family Dwellings (A B C & D)
G) Loans On Manufactured Home Dwelling (A B C & D)
Number
Average Value
Number
Average Value
Number
Average Value
Number
Average Value
Number
Average Value
Number
Average Value
LOANS ORIGINATED
5
$97,932
14
$139,851
25
$109,437
6
$29,073
3
$56,833
2
$46,745
APPLICATIONS APPROVED, NOT ACCEPTED
0
$0
0
$0
5
$101,298
1
$14,330
0
$0
0
$0
APPLICATIONS DENIED
0
$0
5
$122,290
13
$103,024
4
$26,775
1
$72,000
1
$46,920
APPLICATIONS WITHDRAWN
0
$0
0
$0
8
$116,146
1
$71,280
0
$0
0
$0
FILES CLOSED FOR INCOMPLETENESS
0
$0
0
$0
1
$304,470
0
$0
0
$0
0
$0
Aggregated Statistics For Year 2007 (Based on 2 partial tracts)
A) FHA, FSA/RHS & VA Home Purchase Loans
B) Conventional Home Purchase Loans
C) Refinancings
D) Home Improvement Loans
F) Non-occupant Loans on < 5 Family Dwellings (A B C & D)
G) Loans On Manufactured Home Dwelling (A B C & D)
Number
Average Value
Number
Average Value
Number
Average Value
Number
Average Value
Number
Average Value
Number
Average Value
LOANS ORIGINATED
2
$114,980
23
$127,410
25
$89,364
10
$34,530
3
$60,893
2
$47,280
APPLICATIONS APPROVED, NOT ACCEPTED
0
$0
3
$82,147
6
$95,162
1
$21,490
0
$0
0
$0
APPLICATIONS DENIED
0
$0
2
$99,220
18
$141,568
4
$36,538
0
$0
2
$48,000
APPLICATIONS WITHDRAWN
0
$0
3
$89,550
8
$130,788
1
$126,090
0
$0
0
$0
FILES CLOSED FOR INCOMPLETENESS
0
$0
0
$0
2
$90,985
0
$0
0
$0
0
$0
Aggregated Statistics For Year 2006 (Based on 2 partial tracts)
A) FHA, FSA/RHS & VA Home Purchase Loans
B) Conventional Home Purchase Loans
C) Refinancings
D) Home Improvement Loans
F) Non-occupant Loans on < 5 Family Dwellings (A B C & D)
G) Loans On Manufactured Home Dwelling (A B C & D)
Number
Average Value
Number
Average Value
Number
Average Value
Number
Average Value
Number
Average Value
Number
Average Value
LOANS ORIGINATED
3
$129,190
28
$106,820
28
$97,558
7
$22,874
5
$61,682
4
$55,520
APPLICATIONS APPROVED, NOT ACCEPTED
0
$0
3
$57,790
6
$97,550
1
$152,240
0
$0
0
$0
APPLICATIONS DENIED
0
$0
6
$82,983
22
$97,740
4
$57,850
0
$0
3
$45,850
APPLICATIONS WITHDRAWN
0
$0
1
$109,250
13
$95,061
2
$42,445
0
$0
1
$58,740
FILES CLOSED FOR INCOMPLETENESS
0
$0
1
$192,710
3
$132,533
0
$0
0
$0
0
$0
Aggregated Statistics For Year 2005 (Based on 2 partial tracts)
A) FHA, FSA/RHS & VA Home Purchase Loans
B) Conventional Home Purchase Loans
C) Refinancings
D) Home Improvement Loans
F) Non-occupant Loans on < 5 Family Dwellings (A B C & D)
G) Loans On Manufactured Home Dwelling (A B C & D)
Number
Average Value
Number
Average Value
Number
Average Value
Number
Average Value
Number
Average Value
Number
Average Value
LOANS ORIGINATED
1
$112,830
29
$115,069
27
$112,316
8
$50,909
2
$96,175
3
$42,387
APPLICATIONS APPROVED, NOT ACCEPTED
1
$63,040
3
$53,970
9
$113,151
0
$0
0
$0
0
$0
APPLICATIONS DENIED
0
$0
6
$81,490
19
$112,682
7
$43,291
0
$0
2
$59,105
APPLICATIONS WITHDRAWN
1
$82,390
5
$90,696
10
$90,446
1
$128,590
0
$0
1
$72,710
FILES CLOSED FOR INCOMPLETENESS
0
$0
0
$0
3
$103,520
0
$0
0
$0
1
$69,490
Aggregated Statistics For Year 2004 (Based on 2 partial tracts)
A) FHA, FSA/RHS & VA Home Purchase Loans
B) Conventional Home Purchase Loans
C) Refinancings
D) Home Improvement Loans
F) Non-occupant Loans on < 5 Family Dwellings (A B C & D)
G) Loans On Manufactured Home Dwelling (A B C & D)
Number
Average Value
Number
Average Value
Number
Average Value
Number
Average Value
Number
Average Value
Number
Average Value
LOANS ORIGINATED
4
$83,460
17
$152,298
32
$108,064
8
$50,282
3
$68,177
3
$41,073
APPLICATIONS APPROVED, NOT ACCEPTED
0
$0
1
$264,710
6
$82,565
3
$27,580
0
$0
0
$0
APPLICATIONS DENIED
0
$0
3
$71,520
21
$77,525
3
$19,223
1
$34,030
2
$43,520
APPLICATIONS WITHDRAWN
0
$0
1
$200,230
10
$143,387
2
$54,625
0
$0
0
$0
FILES CLOSED FOR INCOMPLETENESS
0
$0
1
$92,420
2
$65,190
0
$0
0
$0
0
$0
Aggregated Statistics For Year 2003 (Based on 2 partial tracts)
A) FHA, FSA/RHS & VA Home Purchase Loans
B) Conventional Home Purchase Loans
C) Refinancings
D) Home Improvement Loans
F) Non-occupant Loans on < 5 Family Dwellings (A B C & D)
Number
Average Value
Number
Average Value
Number
Average Value
Number
Average Value
Number
Average Value
LOANS ORIGINATED
2
$100,115
28
$134,875
96
$110,020
12
$17,223
2
$60,000
APPLICATIONS APPROVED, NOT ACCEPTED
0
$0
3
$124,297
14
$84,663
1
$25,070
0
$0
APPLICATIONS DENIED
0
$0
3
$100,773
20
$113,496
4
$21,135
1
$55,520
APPLICATIONS WITHDRAWN
0
$0
3
$94,327
14
$78,241
0
$0
0
$0
FILES CLOSED FOR INCOMPLETENESS
0
$0
0
$0
2
$155,100
0
$0
0
$0
Aggregated Statistics For Year 2002 (Based on 2 partial tracts)
A) FHA, FSA/RHS & VA Home Purchase Loans
B) Conventional Home Purchase Loans
C) Refinancings
D) Home Improvement Loans
F) Non-occupant Loans on < 5 Family Dwellings (A B C & D)
Number
Average Value
Number
Average Value
Number
Average Value
Number
Average Value
Number
Average Value
LOANS ORIGINATED
2
$99,040
19
$93,057
81
$104,250
14
$17,603
6
$51,223
APPLICATIONS APPROVED, NOT ACCEPTED
0
$0
2
$141,130
10
$76,977
1
$14,690
0
$0
APPLICATIONS DENIED
0
$0
2
$140,235
21
$77,866
4
$26,865
0
$0
APPLICATIONS WITHDRAWN
0
$0
2
$130,565
14
$87,119
1
$53,730
0
$0
FILES CLOSED FOR INCOMPLETENESS
0
$0
1
$42,630
3
$76,893
0
$0
0
$0
Aggregated Statistics For Year 2001 (Based on 2 partial tracts)
A) FHA, FSA/RHS & VA Home Purchase Loans
B) Conventional Home Purchase Loans
C) Refinancings
D) Home Improvement Loans
F) Non-occupant Loans on < 5 Family Dwellings (A B C & D)
Number
Average Value
Number
Average Value
Number
Average Value
Number
Average Value
Number
Average Value
LOANS ORIGINATED
1
$89,550
17
$101,244
82
$101,152
10
$11,140
3
$53,850
APPLICATIONS APPROVED, NOT ACCEPTED
1
$57,310
2
$50,150
13
$67,865
2
$21,490
0
$0
APPLICATIONS DENIED
1
$98,510
6
$80,357
19
$68,077
4
$10,298
1
$26,510
APPLICATIONS WITHDRAWN
0
$0
3
$48,717
15
$78,971
2
$173,190
0
$0
FILES CLOSED FOR INCOMPLETENESS
0
$0
0
$0
2
$74,145
0
$0
0
$0
Aggregated Statistics For Year 2000 (Based on 2 partial tracts)
A) FHA, FSA/RHS & VA Home Purchase Loans
B) Conventional Home Purchase Loans
C) Refinancings
D) Home Improvement Loans
F) Non-occupant Loans on < 5 Family Dwellings (A B C & D)
Number
Average Value
Number
Average Value
Number
Average Value
Number
Average Value
Number
Average Value
LOANS ORIGINATED
3
$62,923
30
$111,949
23
$79,785
14
$15,812
5
$50,292
APPLICATIONS APPROVED, NOT ACCEPTED
0
$0
5
$65,192
7
$54,241
3
$8,837
0
$0
APPLICATIONS DENIED
0
$0
10
$64,440
14
$48,894
4
$18,448
1
$91,340
APPLICATIONS WITHDRAWN
0
$0
3
$32,953
9
$64,237
1
$17,190
0
$0
FILES CLOSED FOR INCOMPLETENESS
0
$0
0
$0
1
$90,620
0
$0
0
$0
Aggregated Statistics For Year 1999 (Based on 1 partial tract)
A) FHA, FSA/RHS & VA Home Purchase Loans
B) Conventional Home Purchase Loans
C) Refinancings
D) Home Improvement Loans
F) Non-occupant Loans on < 5 Family Dwellings (A B C & D)
Detailed PMIC statistics for the following Tracts:0101.00
2002 - 2018 National Fire Incident Reporting System (NFIRS) incidents
Based on the data from the years 2002 - 2018 the average number of fires per year is 19. The highest number of reported fire incidents - 48 took place in 2010, and the least - 0 in 2014. The data has a growing trend.
When looking into fire subcategories, the most reports belonged to: Structure Fires (47.7%), and Outside Fires (42.4%).
Fire incident types reported to NFIRS in Zip Code 47874


+$197
-$2,212
(% of AGI for various income ranges: 0.1% for AGIs below $10k, 0.1% for AGIs $25k-50k, 1.0% for AGIs $50k-75k, -1.9% for AGIs $75k-100k) Nearest zip codes: 47836, 47805, 47860, 47880, 47837, 47862.


 Based on the data from the years 2002 - 2018 the average number of fires per year is 19. The highest number of reported fire incidents - 48 took place in 2010, and the least - 0 in 2014. The data has a growing trend.
 When looking into fire subcategories, the most reports belonged to: Structure Fires (47.7%), and Outside Fires (42.4%).