Estimated zip code population in 2022: 1,308 Zip code population in 2010: 1,186 Zip code population in 2000: 1,258
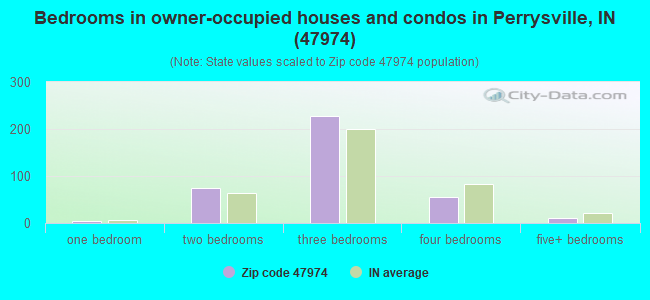
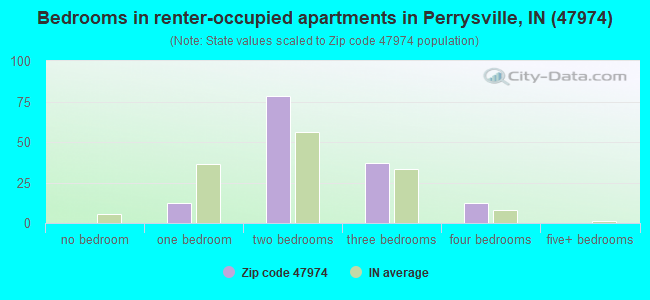
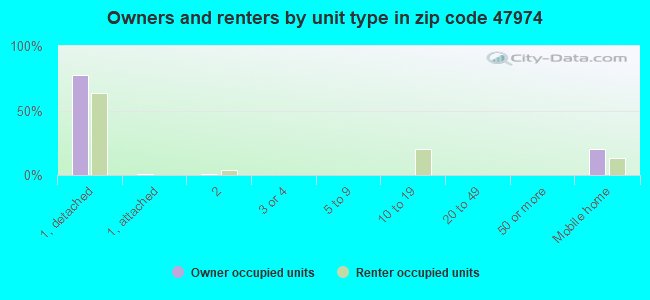
Houses and condos: 576 Renter-occupied apartments: 140
% of renters here:
27%
State:
29%
March 2022 cost of living index in zip code 47974: 84.3 (less than average, U.S. average is 100)
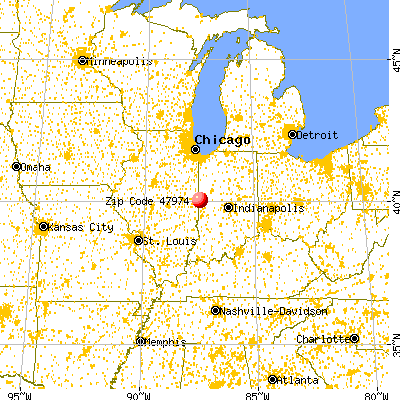
Land area: 40.9 sq. mi. Water area: 0.6 sq. mi.
Population density: 32 people per square mile
(very low).
OSM Map
General Map
Google Map
MSN Map
OSM Map
General Map
Google Map
MSN Map
OSM Map
General Map
Google Map
MSN Map
OSM Map
General Map
Google Map
MSN Map
Please wait while loading the map...
Real estate property taxes paid for housing units in 2022:
This zip code:
0.6% ($798)
Indiana:
0.7% ($1,467)
Median real estate property taxes paid for housing units with mortgages in 2022: $737 (0.5%) Median real estate property taxes paid for housing units with no mortgage in 2022: $904 (0.5%)
Business Search- 14 Million verified businesses
Males: 788
(60.2%)
Females: 520
(39.8%)
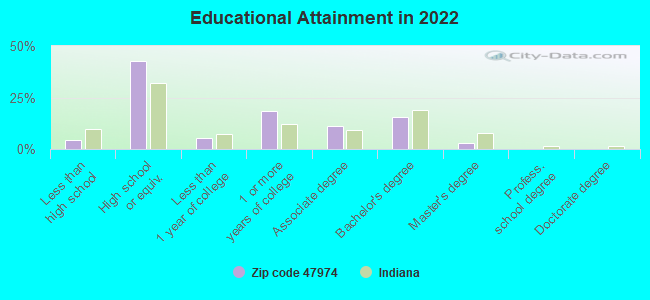
For population 25 years and over in 47974:
High school or higher: 94.4%
Bachelor's degree or higher: 18.2%
Graduate or professional degree: 2.8%
Unemployed: 3.8%
Mean travel time to work (commute): 28.1 minutes
For population 15 years and over in 47974:
Never married: 26.8%
Now married: 55.7%
Separated: 3.1%
Widowed: 5.5%
Divorced: 8.8%
Zip code 47974 compared to state average:
Median house value below state average.
Black race population percentage significantly below state average.
Foreign-born population percentage below state average.
Length of stay since moving in significantly above state average.
Percentage of population with a bachelor's degree or higher below state average.
Estimated median house/condo value in 2022: $138,565
47974:
$138,565
Indiana:
$208,700
Median resident age:
This zip code:
40.7 years
Indiana median age:
38.2 years
Average household size:
This zip code:
2.5 people
Indiana:
2.4 people
Averages for the 2020 tax year for zip code 47974, filed in 2021:
Average Adjusted Gross Income (AGI) in 2020: $59,580 (Individual Income Tax Returns)
Here:
$59,580
State:
$64,978
Salary/wage: $51,158 (reported on 78.2% of returns)
Here:
$51,158
State:
$55,245
(% of AGI for various income ranges: 1107.3% for AGIs below $25k, 3297.5% for AGIs $25k-50k, 5655.7% for AGIs $50k-75k, 9322.5% for AGIs $75k-100k, 18270.0% for AGIs $100k-200k)
Taxable interest for individuals: $425 (reported on 29.1% of returns)
This zip code:
$425
Indiana:
$1,351
(% of AGI for various income ranges: 11.8% for AGIs below $25k, 5.0% for AGIs $25k-50k, 32.9% for AGIs $50k-75k, 52.0% for AGIs $100k-200k)
Ordinary dividends: $1,271 (reported on 12.7% of returns)
Here:
$1,271
State:
$5,827
(% of AGI for various income ranges: 30.0% for AGIs below $25k, 55.7% for AGIs $50k-75k, 34.0% for AGIs $100k-200k)
Net capital gain/loss in AGI: +$5,017 (reported on 10.9% of returns)
Here:
+$5,017
State:
+$17,730
(% of AGI for various income ranges: 328.6% for AGIs $50k-75k, 156.0% for AGIs $100k-200k)
Profit/loss from business: +$5,367 (reported on 10.9% of returns)
Here:
+$5,367
State:
+$12,144
(% of AGI for various income ranges: 188.3% for AGIs $25k-50k, 240.0% for AGIs $75k-100k)
Taxable individual retirement arrangement distribution: $11,983 (reported on 10.9% of returns)
47974:
$11,983
Indiana:
$18,302
(% of AGI for various income ranges: 218.2% for AGIs below $25k, 684.3% for AGIs $50k-75k)
Earned income credit: $2,250 (reported on 10.9% of returns)
Here:
$2,250
State:
$2,298
(% of AGI for various income ranges: 60.0% for AGIs below $25k, 57.5% for AGIs $25k-50k)
Percentage of individuals using paid preparers for their 2020 taxes: 94.5%
Here:
95%
State:
94%
(% for various income ranges: 94.1% for AGIs below $25k, 92.9% for AGIs $25k-50k, 90.0% for AGIs $50k-75k, 100.0% for AGIs $75k-100k, 100.0% for AGIs $100k-200k)
Averages for the 2012 tax year for zip code 47974, filed in 2013:
Average Adjusted Gross Income (AGI) in 2012: $48,165 (Individual Income Tax Returns)
Here:
$48,165
State:
$52,932
Salary/wage: $41,387 (reported on 81.8% of returns)
Here:
$41,387
State:
$45,173
(% of AGI for various income ranges: 64.7% for AGIs below $25k, 73.6% for AGIs $25k-50k, 72.3% for AGIs $50k-75k, 73.0% for AGIs $75k-100k, 66.6% for AGIs $100k-200k)
Taxable interest for individuals: $888 (reported on 30.9% of returns)
This zip code:
$888
Indiana:
$1,311
(% of AGI for various income ranges: 2.1% for AGIs below $25k, 0.5% for AGIs $25k-50k, 0.9% for AGIs $50k-75k, 0.1% for AGIs $100k-200k)
Ordinary dividends: $1,050 (reported on 14.5% of returns)
Here:
$1,050
State:
$4,690
Net capital gain/loss in AGI: +$2,517 (reported on 10.9% of returns)
Here:
+$2,517
State:
+$10,406
Profit/loss from business: +$4,738 (reported on 14.5% of returns)
Here:
+$4,738
State:
+$11,105
Taxable individual retirement arrangement distribution: $8,760 (reported on 9.1% of returns)
47974:
$8,760
Indiana:
$13,841
Total itemized deductions: $19,712 (19% of AGI, reported on 14.5% of returns)
Here:
$19,712
State:
$20,913
Here:
19.2% of AGI
State:
18.2% of AGI
(% of AGI for various income ranges: 11.2% for AGIs below $25k, 9.8% for AGIs $50k-75k, 9.6% for AGIs $100k-200k)
Charity contributions: $4,900 (reported on 12.7% of returns)
Here:
$4,900
State:
$4,697
Taxes paid: $5,688 (reported on 14.5% of returns)
47974:
$5,688
State:
$7,456
(% of AGI for various income ranges: 1.8% for AGIs below $25k, 2.4% for AGIs $50k-75k, 3.6% for AGIs $100k-200k)
Earned income credit: $2,110 (reported on 18.2% of returns)
Here:
$2,110
State:
$2,265
(% of AGI for various income ranges: 5.5% for AGIs below $25k, 1.3% for AGIs $25k-50k)
Percentage of individuals using paid preparers for their 2012 taxes: 69.1%
Here:
69%
State:
53%
(% for various income ranges: 61.9% for AGIs below $25k, 71.4% for AGIs $25k-50k, 66.7% for AGIs $50k-75k, 83.3% for AGIs $75k-100k, 80.0% for AGIs $100k-200k)
Averages for the 2004 tax year for zip code 47974, filed in 2005:
Average Adjusted Gross Income (AGI) in 2004: $37,768 (Individual Income Tax Returns)
Here:
$37,768
State:
$44,790
Salary/wage: $35,553 (reported on 83.9% of returns)
Here:
$35,553
State:
$39,615
(% of AGI for various income ranges: 133.3% for AGIs below $10k, 69.8% for AGIs $10k-25k, 80.0% for AGIs $25k-50k, 80.3% for AGIs $50k-75k, 85.4% for AGIs $75k-100k, 67.6% for AGIs over 100k)
Taxable interest for individuals: $1,185 (reported on 46.4% of returns)
This zip code:
$1,185
Indiana:
$1,535
(% of AGI for various income ranges: 12.7% for AGIs below $10k, 2.3% for AGIs $10k-25k, 1.6% for AGIs $25k-50k, 1.7% for AGIs $50k-75k, 0.1% for AGIs $75k-100k, 0.6% for AGIs over 100k)
Taxable dividends: $1,077 (reported on 19.0% of returns)
Here:
$1,077
State:
$2,998
(% of AGI for various income ranges: 0.0% for AGIs below $10k, 0.5% for AGIs $10k-25k, 1.1% for AGIs $25k-50k, 0.5% for AGIs $50k-75k, 0.2% for AGIs $75k-100k)
Net capital gain/loss: +$3,815 (reported on 11.9% of returns)
Here:
+$3,815
State:
+$8,619
(% of AGI for various income ranges: -0.5% for AGIs $10k-25k, 0.3% for AGIs $25k-50k, 0.2% for AGIs $50k-75k, 6.4% for AGIs $75k-100k)
Profit/loss from business: +$3,458 (reported on 13.2% of returns)
Here:
+$3,458
State:
+$10,071
(% of AGI for various income ranges: 13.6% for AGIs below $10k, 3.5% for AGIs $10k-25k, 1.7% for AGIs $25k-50k, 0.8% for AGIs $50k-75k, -0.3% for AGIs $75k-100k)
Profit/loss from farming: +$2,333 (reported on 6.6% of returns)
Here:
+$2,333
State:
-$2,212
IRA payment deduction: $1,583 (reported on 2.2% of returns)
47974:
$1,583
Indiana:
$2,840
Total itemized deductions: $13,869 (20% of AGI, reported on 15.4% of returns)
Here:
$13,869
State:
$17,065
Here:
19.8% of AGI
State:
19.5% of AGI
(% of AGI for various income ranges: 5.2% for AGIs $25k-50k, 5.8% for AGIs $50k-75k, 5.7% for AGIs $75k-100k, 11.4% for AGIs over 100k)
Charity contributions deductions: $3,483 (4% of AGI, reported on 11.0% of returns)
Here:
$3,483
State:
$3,550
Here:
4.3% of AGI
State:
3.8% of AGI
(% of AGI for various income ranges: 0.5% for AGIs $25k-50k, 0.8% for AGIs $50k-75k, 1.1% for AGIs $75k-100k, 3.6% for AGIs over 100k)
Total tax: $4,433 (reported on 75.1% of returns)
47974:
$4,433
State:
$6,914
(% of AGI for various income ranges: 4.4% for AGIs below $10k, 3.8% for AGIs $10k-25k, 6.5% for AGIs $25k-50k, 8.1% for AGIs $50k-75k, 11.7% for AGIs $75k-100k, 16.7% for AGIs over 100k)
Earned income credit: $1,650 (reported on 14.6% of returns)
Here:
$1,650
State:
$1,685
Percentage of individuals using paid preparers for their 2004 taxes: 74.8%
Here:
75%
State:
59%
(% for various income ranges: 70.2% for AGIs below $10k, 73.4% for AGIs $10k-25k, 77.9% for AGIs $25k-50k, 73.7% for AGIs $50k-75k, 68.3% for AGIs $75k-100k, 100.0% for AGIs over 100k)
Household received Food Stamps/SNAP in the past 12 months: 67 Household did not receive Food Stamps/SNAP in the past 12 months: 447
Women who had a birth in the past 12 months: 3 (2 now married, 0 unmarried) Women who did not have a birth in the past 12 months: 297 (192 now married, 106 unmarried)
Housing units in zip code 47974 with a mortgage: 194 (1 second mortgage, 1 both second mortgage and home equity loan) Median monthly owner costs for units with a mortgage: $940 Median monthly owner costs for units without a mortgage: $602
Residents with income below the poverty level in 2022:
This zip code:
9.8%
Whole state:
12.6%
Residents with income below 50% of the poverty level in 2022:
This zip code:
2.2%
Whole state:
6.3%
Median number of rooms in houses and condos:
Here:
6.5
State:
6.6
Median number of rooms in apartments:
Here:
4.1
State:
4.3
Notable locations in this zip code not listed on our city pages
Cemeteries: Ater Cemetery (1), Harrison Cemetery (2), Hughes Cemetery (3), Isle Cemetery (4), Smith Cemetery (5), Chenoweth Cemetery (6). Display/hide their locations on the map
In group quarters: 13 (-1 institutionalized population)
Size of family households: 92 2-persons, 98 3-persons, 64 4-persons, 37 5-persons, 33 6-persons, 2 7-or-more-persons
Size of nonfamily households: 104 1-person, 51 2-persons, 27 4-persons
201 married couples with children.
83 single-parent households (30 men, 53 women).
87.5% of residents of 47974 zip code speak English at home.
13.6% of residents speak Spanish at home (22% very well, 34% well, 39% not well, 6% not at all).
0.9% of residents speak other Indo-European language at home (100% very well).
0.2% of residents speak Asian or Pacific Island language at home (100% well).
Foreign born population: 39 (3.0%) (0.0% of them are naturalized citizens)
:
3.0%
Whole state:
6.1%
65%Honduras
18%Costa Rica
8%Dominica
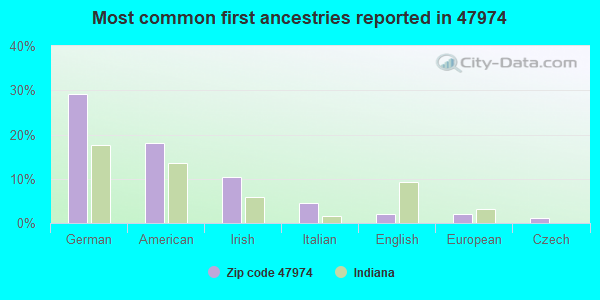
29%German
18%American
10%Irish
4%Italian
2%English
2%European
1%Czech
Year of entry for the foreign-born population
352010 or later
92000 to 2009
21990 to 1999
0Before 1990
Facilities with environmental interests located in this zip code:
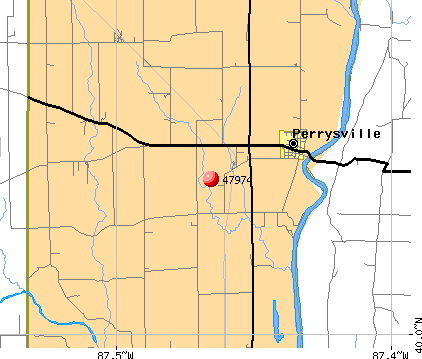
PERRYSVILLE WATER DEPT (MAIN ST & JACKSON ST in PERRYSVILLE, IN)
(Integrated Compliance Information System) - ICIS-05-1992-0032, FORMAL ENFORCEMENT ACTION, ICIS-05-1987-0507, STATE MASTER (Indiana facility tracking) COMMUNITY WATER SYSTEM (SDWIS) - SDWIS-IN5283009 7599, WATER TREATMENT PLANT Alternative names: PERRYSVILLE WATER WORKS, PERRYVILLE WATER WORKS
PERRYSVILLE WATER WORKS (POST OFFICE BOX 525 in PERRYSVILLE, IN)
PERRYSVILLE WATER WORKS (600 E. S.R. 32 in PERRYSVILLE, IN)
STATE MASTER (Indiana facility tracking) National Pollutant Discharge Elimination System NON-MAJOR (Tracking pollutant discharge elimination systems) - permit Business SIC classification: WATER SUPPLY Organizations: AXEL GEORGE BELL 101804 (CONTACT/OPERATOR)
, PERRYSVILLE TOWN COUNCIL (CONTACT/OWNER)
Alternative names: PERRYSVILLE TOWN COUNCIL
Housing units lacking complete plumbing facilities: 1.2% Housing units lacking complete kitchen facilities: 4.8%
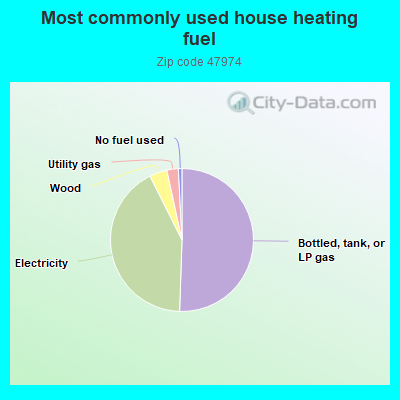
50.6%Bottled, tank, or LP gas
42.1%Electricity
4.0%Wood
2.6%Utility gas
0.8%No fuel used
Population in 1990: 1,672.
Place of birth for U.S.-born residents:
This state: 426
Northeast: 16
Midwest: 636
South: 175
West: 10
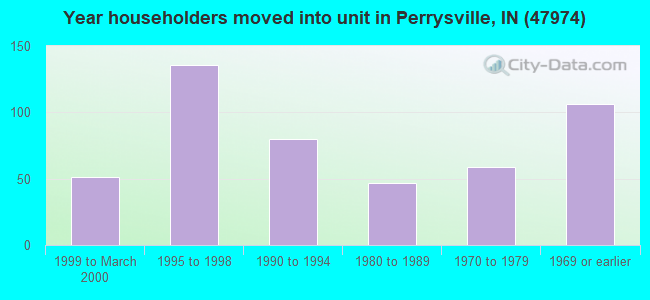
60% of the 47974 zip code residents lived in the same house 5 years ago. Out of people who lived in different houses, 51% lived in this county. Out of people who lived in different counties, 50% lived in Indiana.
91% of the 47974 zip code residents lived in the same house 1 year ago. Out of people who lived in different houses, 49% moved from this county. Out of people who lived in different houses, 14% moved from different county within same state. Out of people who lived in different houses, 39% moved from different state.
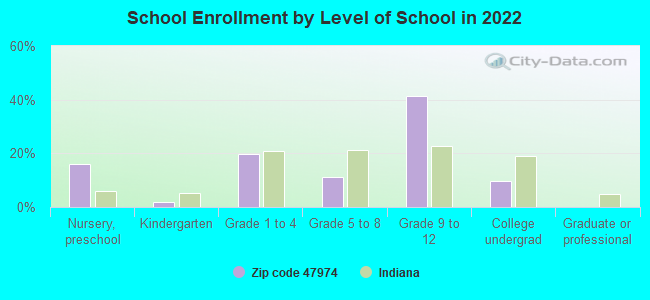
Private vs. public school enrollment:
Students in private schools in grades 1 to 8 (elementary and middle school): 2
Here:
2.4%
Indiana:
14.9%
Students in private schools in grades 9 to 12 (high school): 4
Here:
2.8%
Indiana:
11.4%
Students in private undergraduate colleges: 9
Here:
24.7%
Indiana:
22.3%
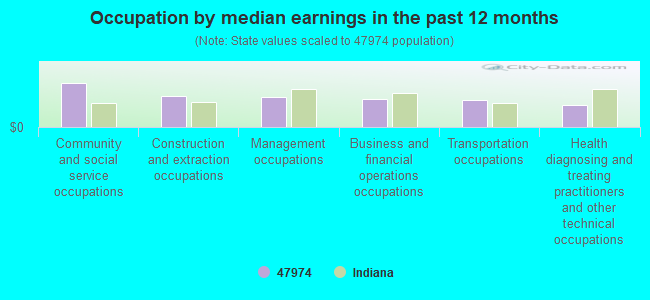
Occupation by median earnings in the past 12 months ($)
120,484Community and social service occupations
84,637Construction and extraction occupations
82,205Management occupations
77,308Business and financial operations occupations
73,653Transportation occupations
60,924Health diagnosing and treating practitioners and other technical occupations
Top industries in this zip code by the number of employees in 2005:
Wholesale Trade: Electrical Apparatus and Equipment, Wiring Supplies, and Related Equipment Merchant Wholesalers (5-9: 1)
Construction: Residential Remodelers (1-4: 1)
Wholesale Trade: Grain and Field Bean Merchant Wholesalers (1-4: 1)
Other Services (except Public Administration): Religious Organizations (1-4: 1)
2002 - 2018 National Fire Incident Reporting System (NFIRS) incidents
According to the data from the years 2002 - 2018 the average number of fires per year is 9. The highest number of fires - 23 took place in 2007, and the least - 1 in 2002. The data has a growing trend.
When looking into fire subcategories, the most reports belonged to: Outside Fires (42.8%), and Structure Fires (34.9%).
Fire incident types reported to NFIRS in Zip Code 47974


+$2,333
-$2,212
 Nearest zip codes: 47932, 47928, 61846, 61883, 47982, 61833.


 According to the data from the years 2002 - 2018 the average number of fires per year is 9. The highest number of fires - 23 took place in 2007, and the least - 1 in 2002. The data has a growing trend.
 When looking into fire subcategories, the most reports belonged to: Outside Fires (42.8%), and Structure Fires (34.9%).