Estimated zip code population in 2022: 1,190 Zip code population in 2010: 1,281 Zip code population in 2000: 1,061
Houses and condos: 564 Renter-occupied apartments: 43
% of renters here:
9%
State:
29%
March 2022 cost of living index in zip code 47989: 82.3 (low, U.S. average is 100)
Land area: 42.0 sq. mi. Water area: 0.5 sq. mi.
Population density: 28 people per square mile
(very low).
OSM Map
General Map
Google Map
MSN Map
OSM Map
General Map
Google Map
MSN Map
OSM Map
General Map
Google Map
MSN Map
OSM Map
General Map
Google Map
MSN Map
Please wait while loading the map...
Real estate property taxes paid for housing units in 2022:
This zip code:
0.4% ($448)
Indiana:
0.7% ($1,467)
Median real estate property taxes paid for housing units with mortgages in 2022: $377 (0.3%) Median real estate property taxes paid for housing units with no mortgage in 2022: $515 (0.3%)
Business Search- 14 Million verified businesses
Males: 678
(57.0%)
Females: 512
(43.0%)
For population 25 years and over in 47989:
High school or higher: 89.8%
Bachelor's degree or higher: 28.0%
Graduate or professional degree: 5.3%
Unemployed: 1.3%
Mean travel time to work (commute): 26.1 minutes
For population 15 years and over in 47989:
Never married: 21.7%
Now married: 67.0%
Separated: 1.1%
Widowed: 3.6%
Divorced: 6.6%
Zip code 47989 compared to state average:
Median house value below state average.
Unemployed percentage below state average.
Black race population percentage significantly below state average.
Hispanic race population percentage significantly below state average.
Foreign-born population percentage below state average.
Renting percentage significantly below state average.
Estimated median house/condo value in 2022: $113,330
47989:
$113,330
Indiana:
$208,700
Median resident age:
This zip code:
36.5 years
Indiana median age:
38.2 years
Average household size:
This zip code:
2.4 people
Indiana:
2.4 people
Averages for the 2020 tax year for zip code 47989, filed in 2021:
Average Adjusted Gross Income (AGI) in 2020: $59,862 (Individual Income Tax Returns)
Here:
$59,862
State:
$64,978
Salary/wage: $51,221 (reported on 81.0% of returns)
Here:
$51,221
State:
$55,245
(% of AGI for various income ranges: 1108.2% for AGIs below $25k, 3504.2% for AGIs $25k-50k, 6357.1% for AGIs $50k-75k, 8308.0% for AGIs $75k-100k, 20092.0% for AGIs $100k-200k)
Taxable interest for individuals: $587 (reported on 25.9% of returns)
This zip code:
$587
Indiana:
$1,351
(% of AGI for various income ranges: 6.4% for AGIs below $25k, 3.3% for AGIs $25k-50k, 25.7% for AGIs $50k-75k, 118.0% for AGIs $100k-200k)
Ordinary dividends: $1,811 (reported on 15.5% of returns)
Here:
$1,811
State:
$5,827
(% of AGI for various income ranges: 25.5% for AGIs below $25k, 100.0% for AGIs $50k-75k, 130.0% for AGIs $100k-200k)
Net capital gain/loss in AGI: +$10,344 (reported on 15.5% of returns)
Here:
+$10,344
State:
+$17,730
(% of AGI for various income ranges: 53.6% for AGIs below $25k, 92.9% for AGIs $50k-75k, 1614.0% for AGIs $100k-200k)
Profit/loss from business: +$9,414 (reported on 12.1% of returns)
Here:
+$9,414
State:
+$12,144
(% of AGI for various income ranges: 196.4% for AGIs below $25k, 632.9% for AGIs $50k-75k)
Taxable individual retirement arrangement distribution: $13,260 (reported on 8.6% of returns)
47989:
$13,260
Indiana:
$18,302
(% of AGI for various income ranges: 947.1% for AGIs $50k-75k)
Earned income credit: $2,362 (reported on 13.8% of returns)
Here:
$2,362
State:
$2,298
(% of AGI for various income ranges: 110.0% for AGIs below $25k, 56.7% for AGIs $25k-50k)
Percentage of individuals using paid preparers for their 2020 taxes: 94.8%
Here:
95%
State:
94%
(% for various income ranges: 88.9% for AGIs below $25k, 93.3% for AGIs $25k-50k, 100.0% for AGIs $50k-75k, 100.0% for AGIs $75k-100k, 100.0% for AGIs $100k-200k)
Averages for the 2012 tax year for zip code 47989, filed in 2013:
Average Adjusted Gross Income (AGI) in 2012: $48,056 (Individual Income Tax Returns)
Here:
$48,056
State:
$52,932
Salary/wage: $41,209 (reported on 85.2% of returns)
Here:
$41,209
State:
$45,173
(% of AGI for various income ranges: 66.1% for AGIs below $25k, 77.6% for AGIs $25k-50k, 77.0% for AGIs $50k-75k, 76.5% for AGIs $75k-100k, 68.3% for AGIs $100k-200k)
Taxable interest for individuals: $400 (reported on 27.8% of returns)
This zip code:
$400
Indiana:
$1,311
(% of AGI for various income ranges: 0.7% for AGIs below $25k, 0.3% for AGIs $25k-50k, 0.1% for AGIs $50k-75k, 0.1% for AGIs $75k-100k, 0.2% for AGIs $100k-200k)
Ordinary dividends: $1,271 (reported on 13.0% of returns)
Here:
$1,271
State:
$4,690
(% of AGI for various income ranges: 0.5% for AGIs below $25k, 1.3% for AGIs $50k-75k, 0.2% for AGIs $100k-200k)
Net capital gain/loss in AGI: +$1,300 (reported on 9.3% of returns)
Here:
+$1,300
State:
+$10,406
Profit/loss from business: +$7,020 (reported on 9.3% of returns)
Here:
+$7,020
State:
+$11,105
Taxable individual retirement arrangement distribution: $7,817 (reported on 11.1% of returns)
47989:
$7,817
Indiana:
$13,841
Total itemized deductions: $18,478 (16% of AGI, reported on 16.7% of returns)
Here:
$18,478
State:
$20,913
Here:
16.3% of AGI
State:
18.2% of AGI
(% of AGI for various income ranges: 10.6% for AGIs $25k-50k, 6.4% for AGIs $75k-100k, 9.2% for AGIs $100k-200k)
Charity contributions: $3,533 (reported on 11.1% of returns)
Here:
$3,533
State:
$4,697
Taxes paid: $7,556 (reported on 16.7% of returns)
47989:
$7,556
State:
$7,456
(% of AGI for various income ranges: 2.3% for AGIs $25k-50k, 2.2% for AGIs $75k-100k, 5.0% for AGIs $100k-200k)
Earned income credit: $1,800 (reported on 20.4% of returns)
Here:
$1,800
State:
$2,265
(% of AGI for various income ranges: 5.5% for AGIs below $25k, 1.4% for AGIs $25k-50k)
Percentage of individuals using paid preparers for their 2012 taxes: 63.0%
Here:
63%
State:
53%
(% for various income ranges: 54.5% for AGIs below $25k, 61.5% for AGIs $25k-50k, 75.0% for AGIs $50k-75k, 66.7% for AGIs $75k-100k, 80.0% for AGIs $100k-200k)
Averages for the 2004 tax year for zip code 47989, filed in 2005:
Average Adjusted Gross Income (AGI) in 2004: $38,078 (Individual Income Tax Returns)
Here:
$38,078
State:
$44,790
Salary/wage: $35,578 (reported on 84.5% of returns)
Here:
$35,578
State:
$39,615
(% of AGI for various income ranges: 82.7% for AGIs below $10k, 72.7% for AGIs $10k-25k, 80.5% for AGIs $25k-50k, 83.6% for AGIs $50k-75k, 91.3% for AGIs $75k-100k, 60.2% for AGIs over 100k)
Taxable interest for individuals: $780 (reported on 40.5% of returns)
This zip code:
$780
Indiana:
$1,535
(% of AGI for various income ranges: 1.9% for AGIs below $10k, 2.6% for AGIs $10k-25k, 0.9% for AGIs $25k-50k, 0.2% for AGIs $50k-75k, 0.2% for AGIs $75k-100k, 1.3% for AGIs over 100k)
Taxable dividends: $928 (reported on 17.6% of returns)
Here:
$928
State:
$2,998
(% of AGI for various income ranges: 0.4% for AGIs below $10k, 0.3% for AGIs $10k-25k, 1.2% for AGIs $25k-50k, 0.1% for AGIs $50k-75k, 0.2% for AGIs $75k-100k, 0.2% for AGIs over 100k)
Net capital gain/loss: +$3,701 (reported on 12.2% of returns)
Here:
+$3,701
State:
+$8,619
(% of AGI for various income ranges: -3.7% for AGIs below $10k, -0.2% for AGIs $25k-50k, 0.5% for AGIs $50k-75k, 6.9% for AGIs over 100k)
Profit/loss from business: +$6,619 (reported on 11.5% of returns)
Here:
+$6,619
State:
+$10,071
(% of AGI for various income ranges: 16.7% for AGIs below $10k, 10.4% for AGIs $10k-25k, 1.7% for AGIs $50k-75k)
Profit/loss from farming: +$9,258 (reported on 5.6% of returns)
Here:
+$9,258
State:
-$2,212
Total itemized deductions: $13,861 (22% of AGI, reported on 18.4% of returns)
Here:
$13,861
State:
$17,065
Here:
21.7% of AGI
State:
19.5% of AGI
(% of AGI for various income ranges: 6.3% for AGIs $10k-25k, 6.2% for AGIs $25k-50k, 6.8% for AGIs $50k-75k, 8.2% for AGIs $75k-100k, 7.0% for AGIs over 100k)
Charity contributions deductions: $2,493 (4% of AGI, reported on 12.9% of returns)
Here:
$2,493
State:
$3,550
Here:
3.6% of AGI
State:
3.8% of AGI
(% of AGI for various income ranges: 0.9% for AGIs $25k-50k, 0.7% for AGIs $50k-75k, 1.6% for AGIs $75k-100k, 0.9% for AGIs over 100k)
Total tax: $4,593 (reported on 73.3% of returns)
47989:
$4,593
State:
$6,914
(% of AGI for various income ranges: 4.3% for AGIs below $10k, 4.6% for AGIs $10k-25k, 6.4% for AGIs $25k-50k, 8.3% for AGIs $50k-75k, 10.3% for AGIs $75k-100k, 15.2% for AGIs over 100k)
Earned income credit: $1,450 (reported on 14.5% of returns)
Here:
$1,450
State:
$1,685
Percentage of individuals using paid preparers for their 2004 taxes: 67.1%
Here:
67%
State:
59%
(% for various income ranges: 60.7% for AGIs below $10k, 63.9% for AGIs $10k-25k, 68.8% for AGIs $25k-50k, 78.7% for AGIs $50k-75k, 57.9% for AGIs $75k-100k, 66.7% for AGIs over 100k)
Household received Food Stamps/SNAP in the past 12 months: 21 Household did not receive Food Stamps/SNAP in the past 12 months: 469
Women who had a birth in the past 12 months: 30 (30 now married, 1 unmarried) Women who did not have a birth in the past 12 months: 218 (98 now married, 120 unmarried)
Housing units in zip code 47989 with a mortgage: 314 (7 second mortgage, 5 both second mortgage and home equity loan) Houses without a mortgage: 173
Median monthly owner costs for units with a mortgage: $977 Median monthly owner costs for units without a mortgage: $427
Residents with income below the poverty level in 2022:
This zip code:
8.6%
Whole state:
12.6%
Residents with income below 50% of the poverty level in 2022:
This zip code:
7.3%
Whole state:
6.3%
Median number of rooms in houses and condos:
Here:
6.9
State:
6.6
Median number of rooms in apartments:
Here:
5.1
State:
4.3
Notable locations in this zip code not listed on our city pages
Cemeteries: Spencer Cemetery (1), Jarvis Cemetery (2), Jones Cemetery (3), Old Union Cemetery (4), Lough Cemetery (5), Maple Ridge Cemetery (6). Display/hide their locations on the map
Size of family households: 216 2-persons, 47 3-persons, 64 4-persons, 21 5-persons, 9 6-persons, 26 7-or-more-persons
Size of nonfamily households: 100 1-person, 6 2-persons
228 married couples with children.
18 single-parent households (8 men, 10 women).
82.5% of residents of 47989 zip code speak English at home.
0.1% of residents speak Spanish at home (100% not well).
13.0% of residents speak other Indo-European language at home (47% very well, 36% well, 18% not well).
5.1% of residents speak Asian or Pacific Island language at home (74% very well, 26% well).
Foreign born population: 40 (3.4%) (5.5% of them are naturalized citizens)
This zip code:
3.4%
Whole state:
6.1%
7%France
2%Malaysia
34%English
19%American
16%European
14%German
3%Scotch-Irish
3%Irish
3%Scottish
Year of entry for the foreign-born population
72010 or later
352000 to 2009
01990 to 1999
0Before 1990
Facilities with environmental interests located in this zip code:
AMERITECH (HIGH AND MAIN ST in WAVELAND, IN)
STATE MASTER (Indiana facility tracking) - CRTK-114, EPCRA (Resource Conservation and Recovery Act (tracking hazardous waste)) Organizations: INDIANA BELL TELEPHONE CO (CONTACT/OWNER)
, INDIANA BELL TELEPHONE CO INC (CONTACT/OWNER)
Alternative names: IND BELL TEL CO WAVELAND 435 OFFICE
DNR SHADES STATE PARK (SR 234 & CR 800 W in WAVELAND, IN)
STATE MASTER (Indiana facility tracking) - CRTK-7520, EPCRA, LUST-199810549, LEAKING STORAGE TANK, UST-9339, UNDERGROUND STORAGE TANK PROGRAM National Pollutant Discharge Elimination System NON-MAJOR (Tracking pollutant discharge elimination systems) - permit Business SIC classification: LAND, MINERAL, WILDLIFE, AND FOREST CONSERVATION Organizations: CERTIFIED OPERATOR (CONTACT/OPERATOR)
, INDOT (CONTACT/OWNER)
LITTLE RACCOON REGIONAL WASTE DISTRICT (CR 750 W AND CR 1150 S in WAVELAND, IN)
STATE MASTER (Indiana facility tracking) National Pollutant Discharge Elimination System NON-MAJOR (Tracking pollutant discharge elimination systems) - permit Business SIC classification: SEWERAGE SYSTEMS Organizations: DOUG CLODFELTER, CERT. OPER. (CONTACT/OPERATOR)
, DOUG CLODFELTER CERT OPER (CONTACT/OPERATOR)
, LITTLE RACOON RSD (CONTACT/OWNER)
Alternative names: LITTLE RACCOON REG. SEWER DIST, LITTLE RACCOON RSD
Housing units lacking complete plumbing facilities: 0.7% Housing units lacking complete kitchen facilities: 2.2%
54.2%Bottled, tank, or LP gas
21.9%Electricity
15.3%Wood
4.6%Fuel oil, kerosene, etc.
4.4%Utility gas
Population in 1990: 1,548.
Place of birth for U.S.-born residents:
This state: 848
Northeast: 80
Midwest: 106
South: 44
West: 67
60% of the 47989 zip code residents lived in the same house 5 years ago. Out of people who lived in different houses, 64% lived in this county. Out of people who lived in different counties, 50% lived in Indiana.
91% of the 47989 zip code residents lived in the same house 1 year ago. Out of people who lived in different houses, 15% moved from this county. Out of people who lived in different houses, 61% moved from different county within same state. Out of people who lived in different houses, 25% moved from different state.
Private vs. public school enrollment:
Students in private schools in grades 1 to 8 (elementary and middle school): 27
Here:
33.6%
Indiana:
14.9%
Students in private schools in grades 9 to 12 (high school): 4
Here:
8.0%
Indiana:
11.4%
Students in private undergraduate colleges: 1
Here:
4.8%
Indiana:
22.3%
Occupation by median earnings in the past 12 months ($)
70,792Health diagnosing and treating practitioners and other technical occupations
69,823Production occupations
61,607Transportation occupations
52,500Installation, maintenance, and repair occupations
43,698Management occupations
37,676Healthcare support occupations
Top industries in this zip code by the number of employees in 2005:
Administrative and Support and Waste Management and Remediation Services: Landscaping Services (1-4: 1)
Fatal accident statistics in 2012:
Fatal accident count: 1
Vehicles involved in fatal accidents: 2
Fatal accidents caused by drunken drivers: 0
Fatalities: 1
Persons involved in fatal accidents: 2
Pedestrians involved in fatal accidents: 0
Fatal accident statistics in 2011:
Fatal accident count: 1
Vehicles involved in fatal accidents: 2
Fatal accidents caused by drunken drivers: 0
Fatalities: 3
Persons involved in fatal accidents: 4
Pedestrians involved in fatal accidents: 0
2002 - 2018 National Fire Incident Reporting System (NFIRS) incidents
According to the data from the years 2002 - 2018 the average number of fires per year is 8. The highest number of fires - 17 took place in 2009, and the least - 0 in 2014. The data has a dropping trend.
When looking into fire subcategories, the most reports belonged to: Structure Fires (53.5%), and Outside Fires (25.6%).
Fire incident types reported to NFIRS in Zip Code 47989


+$9,258
-$2,212
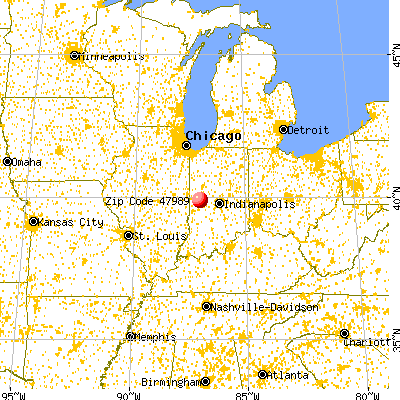
 Nearest zip codes: 47916, 46175, 47859, 47965, 47990, 47872.


 According to the data from the years 2002 - 2018 the average number of fires per year is 8. The highest number of fires - 17 took place in 2009, and the least - 0 in 2014. The data has a dropping trend.
 When looking into fire subcategories, the most reports belonged to: Structure Fires (53.5%), and Outside Fires (25.6%).