Estimated zip code population in 2022: 4,981 Zip code population in 2010: 5,178 Zip code population in 2000: 6,984
Houses and condos: 2,294 Renter-occupied apartments: 296
% of renters here:
14%
State:
27%
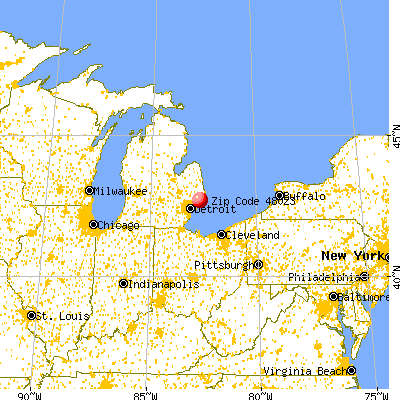
March 2022 cost of living index in zip code 48023: 96.8 (near average, U.S. average is 100)
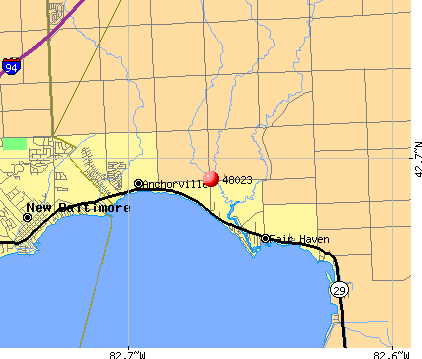
Land area: 17.0 sq. mi. Water area: 0.1 sq. mi.
Population density: 292 people per square mile
(very low).
OSM Map
General Map
Google Map
MSN Map
OSM Map
General Map
Google Map
MSN Map
OSM Map
General Map
Google Map
MSN Map
OSM Map
General Map
Google Map
MSN Map
Please wait while loading the map...
Real estate property taxes paid for housing units in 2022:
This zip code:
1.1% ($2,803)
Michigan:
1.2% ($2,746)
Median real estate property taxes paid for housing units with mortgages in 2022: $2,974 (1.1%) Median real estate property taxes paid for housing units with no mortgage in 2022: $2,571 (1.1%)
Estimated median house/condo value in 2022: $255,086
48023:
$255,086
Michigan:
$224,400
According to our research of Michigan and other state lists, there were 5 registered sex offenders living in 48023 zip code as of May 28, 2024. The ratio of all residents to sex offenders in zip code 48023 is 1,031 to 1. The ratio of registered sex offenders to all residents in this zip code is much lower than the state average.
Median resident age:
This zip code:
43.8 years
Michigan median age:
40.3 years
Average household size:
This zip code:
2.4 people
Michigan:
2.4 people
Averages for the 2020 tax year for zip code 48023, filed in 2021:
Average Adjusted Gross Income (AGI) in 2020: $62,923 (Individual Income Tax Returns)
Here:
$62,923
State:
$68,945
Salary/wage: $57,025 (reported on 77.6% of returns)
Here:
$57,025
State:
$57,142
(% of AGI for various income ranges: 947.5% for AGIs below $25k, 3069.4% for AGIs $25k-50k, 6243.3% for AGIs $50k-75k, 8820.5% for AGIs $75k-100k, 17704.8% for AGIs $100k-200k, 60252.5% for AGIs over 200k)
Taxable interest for individuals: $1,087 (reported on 28.5% of returns)
This zip code:
$1,087
Michigan:
$1,630
(% of AGI for various income ranges: 13.0% for AGIs below $25k, 27.3% for AGIs $25k-50k, 33.0% for AGIs $50k-75k, 28.9% for AGIs $75k-100k, 66.7% for AGIs $100k-200k, 782.5% for AGIs over 200k)
Ordinary dividends: $3,028 (reported on 16.3% of returns)
Here:
$3,028
State:
$6,972
(% of AGI for various income ranges: 24.8% for AGIs below $25k, 38.8% for AGIs $25k-50k, 50.0% for AGIs $50k-75k, 65.8% for AGIs $75k-100k, 131.0% for AGIs $100k-200k, 1045.0% for AGIs over 200k)
Net capital gain/loss in AGI: +$8,949 (reported on 15.6% of returns)
Here:
+$8,949
State:
+$20,064
(% of AGI for various income ranges: 34.1% for AGIs $25k-50k, 59.3% for AGIs $50k-75k, 196.8% for AGIs $75k-100k, 452.4% for AGIs $100k-200k, 5072.5% for AGIs over 200k)
Profit/loss from business: +$10,763 (reported on 13.3% of returns)
Here:
+$10,763
State:
+$11,172
(% of AGI for various income ranges: 76.6% for AGIs below $25k, 147.6% for AGIs $25k-50k, 204.4% for AGIs $50k-75k, 63.7% for AGIs $75k-100k, 321.0% for AGIs $100k-200k, 3000.0% for AGIs over 200k)
Taxable individual retirement arrangement distribution: $14,336 (reported on 8.4% of returns)
48023:
$14,336
Michigan:
$19,803
(% of AGI for various income ranges: 61.3% for AGIs below $25k, 105.5% for AGIs $25k-50k, 158.9% for AGIs $50k-75k, 295.8% for AGIs $75k-100k, 595.7% for AGIs $100k-200k)
Total itemized deductions: $26,975 (reported on 6.1% of returns)
Here:
$26,975
State:
$34,117
(% of AGI for various income ranges: 60.3% for AGIs below $25k, 170.4% for AGIs $50k-75k, 328.4% for AGIs $75k-100k, 591.0% for AGIs $100k-200k, 4057.5% for AGIs over 200k)
Charity contributions: $8,164 (reported on 5.3% of returns)
Here:
$8,164
State:
$13,548
(% of AGI for various income ranges: 22.4% for AGIs $25k-50k, 55.8% for AGIs $75k-100k, 183.3% for AGIs $100k-200k, 1345.0% for AGIs over 200k)
Taxes paid: $7,925 (reported on 6.1% of returns)
48023:
$7,925
State:
$7,972
(% of AGI for various income ranges: 17.9% for AGIs below $25k, 47.8% for AGIs $50k-75k, 104.7% for AGIs $75k-100k, 193.8% for AGIs $100k-200k, 1060.0% for AGIs over 200k)
Earned income credit: $2,066 (reported on 12.2% of returns)
Here:
$2,066
State:
$2,251
(% of AGI for various income ranges: 58.9% for AGIs below $25k, 59.2% for AGIs $25k-50k)
Percentage of individuals using paid preparers for their 2020 taxes: 93.2%
Here:
93%
State:
93%
(% for various income ranges: 90.9% for AGIs below $25k, 93.9% for AGIs $25k-50k, 92.1% for AGIs $50k-75k, 96.2% for AGIs $75k-100k, 94.3% for AGIs $100k-200k, 100.0% for AGIs over 200k)
Averages for the 2012 tax year for zip code 48023, filed in 2013:
Average Adjusted Gross Income (AGI) in 2012: $49,353 (Individual Income Tax Returns)
Here:
$49,353
State:
$55,609
Salary/wage: $44,934 (reported on 80.9% of returns)
Here:
$44,934
State:
$46,782
(% of AGI for various income ranges: 68.4% for AGIs below $25k, 68.9% for AGIs $25k-50k, 73.7% for AGIs $50k-75k, 79.0% for AGIs $75k-100k, 82.0% for AGIs $100k-200k, 57.4% for AGIs over 200k)
Taxable interest for individuals: $1,152 (reported on 33.3% of returns)
This zip code:
$1,152
Michigan:
$1,491
(% of AGI for various income ranges: 1.1% for AGIs below $25k, 0.9% for AGIs $25k-50k, 0.6% for AGIs $50k-75k, 0.7% for AGIs $75k-100k, 0.4% for AGIs $100k-200k, 1.5% for AGIs over 200k)
Ordinary dividends: $2,679 (reported on 19.1% of returns)
Here:
$2,679
State:
$6,225
(% of AGI for various income ranges: 1.6% for AGIs below $25k, 0.7% for AGIs $25k-50k, 1.0% for AGIs $50k-75k, 0.7% for AGIs $75k-100k, 1.0% for AGIs $100k-200k, 1.7% for AGIs over 200k)
Net capital gain/loss in AGI: +$4,288 (reported on 14.2% of returns)
Here:
+$4,288
State:
+$9,326
(% of AGI for various income ranges: 0.4% for AGIs $100k-200k, 10.1% for AGIs over 200k)
Profit/loss from business: +$10,312 (reported on 15.1% of returns)
Here:
+$10,312
State:
+$11,523
(% of AGI for various income ranges: 7.2% for AGIs below $25k, 2.8% for AGIs $25k-50k, 3.9% for AGIs $50k-75k, 1.1% for AGIs $75k-100k, 4.2% for AGIs $100k-200k)
Taxable individual retirement arrangement distribution: $11,846 (reported on 10.7% of returns)
48023:
$11,846
Michigan:
$15,298
(% of AGI for various income ranges: 2.8% for AGIs below $25k, 3.6% for AGIs $25k-50k, 2.6% for AGIs $50k-75k, 4.1% for AGIs $75k-100k, 2.0% for AGIs $100k-200k)
Total itemized deductions: $19,545 (21% of AGI, reported on 30.7% of returns)
Here:
$19,545
State:
$21,628
Here:
20.9% of AGI
State:
18.4% of AGI
(% of AGI for various income ranges: 8.8% for AGIs below $25k, 10.6% for AGIs $25k-50k, 10.6% for AGIs $50k-75k, 14.1% for AGIs $75k-100k, 14.5% for AGIs $100k-200k, 10.8% for AGIs over 200k)
Charity contributions: $2,516 (reported on 27.1% of returns)
Here:
$2,516
State:
$4,225
(% of AGI for various income ranges: 0.7% for AGIs below $25k, 1.1% for AGIs $25k-50k, 1.3% for AGIs $50k-75k, 1.4% for AGIs $75k-100k, 1.8% for AGIs $100k-200k, 1.5% for AGIs over 200k)
Taxes paid: $6,997 (reported on 30.7% of returns)
48023:
$6,997
State:
$8,327
(% of AGI for various income ranges: 1.8% for AGIs below $25k, 2.6% for AGIs $25k-50k, 3.7% for AGIs $50k-75k, 4.8% for AGIs $75k-100k, 5.9% for AGIs $100k-200k, 5.3% for AGIs over 200k)
Earned income credit: $2,114 (reported on 16.4% of returns)
Here:
$2,114
State:
$2,306
(% of AGI for various income ranges: 5.4% for AGIs below $25k, 1.1% for AGIs $25k-50k)
Percentage of individuals using paid preparers for their 2012 taxes: 64.4%
Here:
64%
State:
57%
(% for various income ranges: 59.6% for AGIs below $25k, 61.5% for AGIs $25k-50k, 71.4% for AGIs $50k-75k, 69.6% for AGIs $75k-100k, 75.0% for AGIs $100k-200k, 75.0% for AGIs over 200k)
Averages for the 2004 tax year for zip code 48023, filed in 2005:
Average Adjusted Gross Income (AGI) in 2004: $40,780 (Individual Income Tax Returns)
Here:
$40,780
State:
$48,204
Salary/wage: $38,616 (reported on 86.3% of returns)
Here:
$38,616
State:
$42,791
(% of AGI for various income ranges: 84.6% for AGIs below $10k, 71.4% for AGIs $10k-25k, 80.9% for AGIs $25k-50k, 83.7% for AGIs $50k-75k, 86.2% for AGIs $75k-100k, 81.5% for AGIs over 100k)
Taxable interest for individuals: $1,148 (reported on 40.8% of returns)
This zip code:
$1,148
Michigan:
$1,725
(% of AGI for various income ranges: 4.5% for AGIs below $10k, 2.3% for AGIs $10k-25k, 1.0% for AGIs $25k-50k, 0.9% for AGIs $50k-75k, 0.6% for AGIs $75k-100k, 1.1% for AGIs over 100k)
Taxable dividends: $1,611 (reported on 19.8% of returns)
Here:
$1,611
State:
$3,420
(% of AGI for various income ranges: 3.0% for AGIs below $10k, 1.0% for AGIs $10k-25k, 0.7% for AGIs $25k-50k, 0.7% for AGIs $50k-75k, 0.5% for AGIs $75k-100k, 0.8% for AGIs over 100k)
Net capital gain/loss: +$3,760 (reported on 15.3% of returns)
Here:
+$3,760
State:
+$8,532
(% of AGI for various income ranges: -2.3% for AGIs below $10k, -0.2% for AGIs $10k-25k, 0.3% for AGIs $25k-50k, 0.7% for AGIs $50k-75k, 1.2% for AGIs $75k-100k, 4.0% for AGIs over 100k)
Profit/loss from business: +$7,618 (reported on 12.7% of returns)
Here:
+$7,618
State:
+$9,547
(% of AGI for various income ranges: 3.5% for AGIs below $10k, 4.3% for AGIs $10k-25k, 1.9% for AGIs $25k-50k, 2.3% for AGIs $50k-75k, 1.6% for AGIs $75k-100k, 2.7% for AGIs over 100k)
IRA payment deduction: $3,040 (reported on 1.8% of returns)
48023:
$3,040
Michigan:
$2,875
Self-employed pension: $8,200 (reported on 0.4% of returns)
Here:
$8,200
Michigan:
$13,826
Total itemized deductions: $17,184 (24% of AGI, reported on 33.2% of returns)
Here:
$17,184
State:
$18,509
Here:
23.8% of AGI
State:
20.7% of AGI
(% of AGI for various income ranges: 14.1% for AGIs below $10k, 8.4% for AGIs $10k-25k, 12.2% for AGIs $25k-50k, 14.9% for AGIs $50k-75k, 16.1% for AGIs $75k-100k, 15.3% for AGIs over 100k)
Charity contributions deductions: $2,272 (3% of AGI, reported on 29.9% of returns)
Here:
$2,272
State:
$3,365
Here:
3.0% of AGI
State:
3.6% of AGI
(% of AGI for various income ranges: 0.6% for AGIs below $10k, 0.9% for AGIs $10k-25k, 1.3% for AGIs $25k-50k, 1.7% for AGIs $50k-75k, 2.3% for AGIs $75k-100k, 1.8% for AGIs over 100k)
Total tax: $5,330 (reported on 74.2% of returns)
48023:
$5,330
State:
$7,691
(% of AGI for various income ranges: 2.7% for AGIs below $10k, 4.2% for AGIs $10k-25k, 6.7% for AGIs $25k-50k, 8.7% for AGIs $50k-75k, 10.4% for AGIs $75k-100k, 15.2% for AGIs over 100k)
Earned income credit: $1,747 (reported on 15.4% of returns)
Here:
$1,747
State:
$1,737
Percentage of individuals using paid preparers for their 2004 taxes: 63.8%
Here:
64%
State:
60%
(% for various income ranges: 54.8% for AGIs below $10k, 65.3% for AGIs $10k-25k, 63.8% for AGIs $25k-50k, 71.1% for AGIs $50k-75k, 63.5% for AGIs $75k-100k, 71.4% for AGIs over 100k)
Likely homosexual households (counted as self-reported same-sex unmarried-partner households)
Lesbian couples: 0.0% of all households
Gay men: 0.5% of all households
Household received Food Stamps/SNAP in the past 12 months: 100 Household did not receive Food Stamps/SNAP in the past 12 months: 1,960
Women who had a birth in the past 12 months: 77 (46 now married, 30 unmarried) Women who did not have a birth in the past 12 months: 863 (339 now married, 523 unmarried)
Housing units in zip code 48023 with a mortgage: 875 (78 second mortgage, 72 both second mortgage and home equity loan) Houses without a mortgage: 15
Median monthly owner costs for units with a mortgage: $1,507 Median monthly owner costs for units without a mortgage: $656
Residents with income below the poverty level in 2022:
This zip code:
11.0%
Whole state:
13.4%
Residents with income below 50% of the poverty level in 2022:
This zip code:
5.6%
Whole state:
6.9%
Median number of rooms in houses and condos:
Here:
6.3
State:
6.5
Median number of rooms in apartments:
Here:
3.8
State:
4.3
Notable locations in this zip code not listed on our city pages
Size of family households: 589 2-persons, 202 3-persons, 382 4-persons, 94 5-persons, 43 6-persons, 20 7-or-more-persons
Size of nonfamily households: 550 1-person, 188 2-persons
791 married couples with children.
263 single-parent households (51 men, 212 women).
98.2% of residents of 48023 zip code speak English at home.
0.4% of residents speak Spanish at home (100% very well).
0.8% of residents speak other language at home (56% very well, 21% well, 23% not well).
Foreign born population: 66 (1.3%) (63.3% of them are naturalized citizens)
This zip code:
1.3%
Whole state:
6.9%
44%Yemen
24%Georgia
20%Poland
9%North Macedonia (Macedonia)
20%German
14%Polish
8%American
8%Irish
6%French Canadian
5%English
5%Romanian
Year of entry for the foreign-born population
362010 or later
02000 to 2009
81990 to 1999
23Before 1990
Public high school in in zip code 48023 not listed on the city page:
Private elementary/middle school in in this zip code not listed on the city page:
IMMACULATE CONCEPTION SCHOOL (Students: 185, Location: 7043 CHURCH RD, Grades: PK-8)
Facilities with environmental interests located in this zip code:
FAIR HAVEN INDUSTRIES (7445 MAYER ROAD in FAIR HAVEN, MI)
AIR MINOR (AIRS/AFS) (Integrated Compliance Information System) - ICIS-05-1988-0116, FORMAL ENFORCEMENT ACTION (Resource Conservation and Recovery Act (tracking hazardous waste)) Business SIC classification: AUTOMOTIVE TRIMMINGS, APPAREL FINDINGS, AND RELATED PRODUCTS; NONCLASSIFIABLE ESTABLISHMENTS Alternative names: FAIR HAVEN PLASTICS
BLOOM ACADEMY (6572 CHURCH ROAD in FAIR HAVEN, MI)
(National Center for Education Statistics) - STATE ID-04857 Organizations: ANCHOR BAY SCHOOL DISTRICT (SCHOOL DISTRICT)
FRANCOIS MACONCE ELEM. SCHOOL (6300 CHURCH ROAD in IRA, MI)
(National Center for Education Statistics) - STATE ID-08623 Organizations: ANCHOR BAY SCHOOL DISTRICT (SCHOOL DISTRICT)
FAIR HAVEN ELEMENTARY SCHOOL (8361 BROADBRIDGE ROAD in FAIR HAVEN, MI)
(National Center for Education Statistics) - STATE ID-01179 Organizations: ALGONAC COMMUNITY SCHOOL DISTRICT (SCHOOL DISTRICT)
MI DEPT/ENVIRONMENTAL QUALITY (9646 MARINE CITY HWY in FAIR HAVEN, MI)
(Resource Conservation and Recovery Act (tracking hazardous waste)) Alternative names: MI DEPT/DEQ
GROSSO TRUCKING AND SUPPLY COMPANY (10015 MARINE CITY HIGHWAY in FAIR HAVEN, MI)
CRITERIA AND HAZARDOUS AIR POLLUTANT INVENTORY (Inventory of air pollution sources) Business SIC classification: MISCELLANEOUS NONMETALLIC MINERALS, EXCEPT FUELS
Housing units lacking complete plumbing facilities: 1.1% Housing units lacking complete kitchen facilities: 1.7%
87.6%Utility gas
3.3%Electricity
3.0%Bottled, tank, or LP gas
2.6%Solar energy
2.0%Wood
0.8%Fuel oil, kerosene, etc.
Population in 1990: 3,781. Population change in the 1990s: +3,203 (+84.7%).
Place of birth for U.S.-born residents:
This state: 4,402
Northeast: 69
Midwest: 88
South: 257
West: 89
52% of the 48023 zip code residents lived in the same house 5 years ago. Out of people who lived in different houses, 27% lived in this county. Out of people who lived in different counties, 50% lived in Michigan.
92% of the 48023 zip code residents lived in the same house 1 year ago. Out of people who lived in different houses, 24% moved from this county. Out of people who lived in different houses, 27% moved from different county within same state. Out of people who lived in different houses, 55% moved from different state. Out of people who lived in different houses, 2% moved from abroad.
Private vs. public school enrollment:
Students in private schools in grades 1 to 8 (elementary and middle school): 69
Here:
12.1%
Michigan:
12.4%
Students in private schools in grades 9 to 12 (high school): 42
Here:
17.3%
Michigan:
9.8%
Students in private undergraduate colleges: 20
Here:
30.8%
Michigan:
14.9%
Occupation by median earnings in the past 12 months ($)
94,828Architecture and engineering occupations
92,844Computer and mathematical occupations
80,832Health diagnosing and treating practitioners and other technical occupations
70,247Business and financial operations occupations
59,711Management occupations
49,668Health technologists and technicians
Companies with federal contracts located in this zip code:
TNE CORPORATION (9405 MARINE CITY HWY in FAIR HAVEN, MI; small business) : $65,734 in 6 contractsfrom 2002 to 2004
Contracts for Maintenance, Repair and Rebuilding of Equipment -- Materials Handling Equipment, Winches, Hoists, Cranes, and Derricks, Miscellaneous Electrical and Electronic Components, Maintenance, Repair and Rebuilding of Equipment -- Construction, Mining, Excavating, and Highway Maintenance Equipment by Army Signed by year:2000: $0; 2001: $0; 2002: $16,400; 2003: $50,699; 2004: -$1,365; 2005: $0; 2006: $0.
Biggest contracts:
$40,070 with Army for Maintenance, Repair and Rebuilding of Equipment -- Materials Handling Equipment. Signed on 2003-05-02. Completion date: 2003-06-03.
$11,330 with Army for Winches, Hoists, Cranes, and Derricks. Signed on 2002-09-29. Completion date: 2002-10-30.
$10,629 with Army for Maintenance, Repair and Rebuilding of Equipment -- Materials Handling Equipment. Signed on 2003-06-17. Completion date: 2003-06-18.
$5,070 with Army for Miscellaneous Electrical and Electronic Components. Signed on 2002-04-10. Completion date: 2002-05-13.
KOTCHMAN, ANNE (6765 MELDRUM ROAD in IRA, MI; small business) : $32,900 in 6 contractsfrom 2003 to 2005
Contracts for Chaplain Services, Services -- Basic Research (R&D), Other Social Services by Army Signed by year:2000: $0; 2001: $0; 2002: $0; 2003: $9,400; 2004: $5,500; 2005: $18,000; 2006: $0.
Biggest contracts:
$13,500 with Army for Chaplain Services. Signed on 2005-12-14. Completion date: 2006-09-30.
$5,500 with Army for Services -- Basic Research (R&D). Signed on 2004-11-01. Completion date: 2004-10-01.
$4,700 with Army for Other Social Services. Signed on 2003-11-17. Completion date: 2004-09-30.
$4,700, same as above.Signed on 2003-10-01. Completion date: 2004-09-30.
TOM JEANNETTE FLOOR FINISHING (7890 LONG ISLAND COURT in FAIR HAVEN, MI; small business) : $6,400 in 3 contractsfrom 2003 to 2004
$3,200 with Army for Maintenance, Repair or Alteration of Real Property -- Other Utilities. Signed on 2004-11-15. Completion date: 2004-11-30.
$3,200, same as above.Signed on 2003-11-01. Completion date: 2003-11-30.
$0, same as above.Signed on 2003-11-01. Completion date: 2003-11-30.
Top industries in this zip code by the number of employees in 2005:
Administrative and Support and Waste Management and Remediation Services: Professional Employer Organizations (100-249 employees: 1 establishment)
Detailed PMIC statistics for the following Tracts:6501.00
, 6502.00
2002 - 2018 National Fire Incident Reporting System (NFIRS) incidents
Based on the data from the years 2002 - 2018 the average number of fire incidents per year is 46. The highest number of reported fire incidents - 86 took place in 2005, and the least - 17 in 2018. The data has a dropping trend.
When looking into fire subcategories, the most reports belonged to: Structure Fires (56.9%), and Other (17.2%).
Fire incident types reported to NFIRS in Zip Code 48023


 Nearest zip codes: 48064, 48001, 48039, 48047, 48028, 48048.


 (Students: 1,984, Location: 6319 COUNTY LINE RD, Grades: 9-12)


 Based on the data from the years 2002 - 2018 the average number of fire incidents per year is 46. The highest number of reported fire incidents - 86 took place in 2005, and the least - 17 in 2018. The data has a dropping trend.
 When looking into fire subcategories, the most reports belonged to: Structure Fires (56.9%), and Other (17.2%).