Estimated zip code population in 2022: 1,423 Zip code population in 2010: 1,653 Zip code population in 2000: 1,456
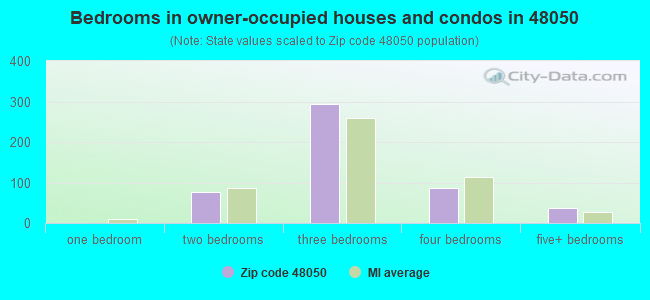
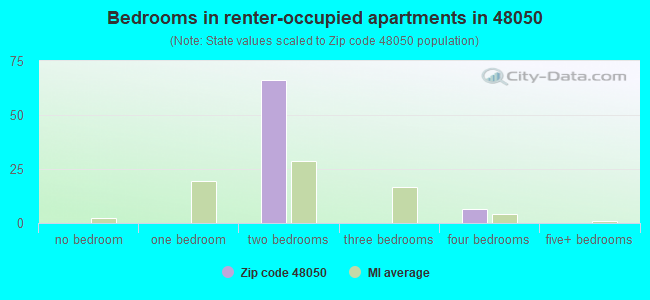
Houses and condos: 564 Renter-occupied apartments: 71
% of renters here:
13%
State:
27%
March 2022 cost of living index in zip code 48050: 92.3 (less than average, U.S. average is 100)
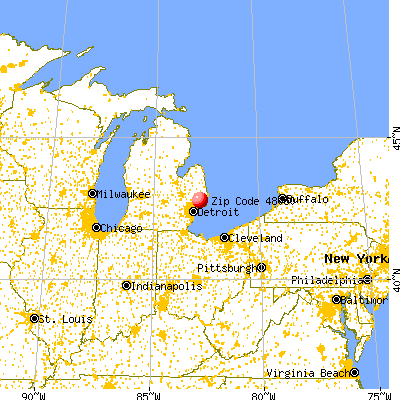
Land area: 18.6 sq. mi. Water area: 0.1 sq. mi.
Population density: 77 people per square mile
(very low).
OSM Map
General Map
Google Map
MSN Map
OSM Map
General Map
Google Map
MSN Map
OSM Map
General Map
Google Map
MSN Map
OSM Map
General Map
Google Map
MSN Map
Please wait while loading the map...
Real estate property taxes paid for housing units in 2022:
This zip code:
0.8% ($2,981)
Michigan:
1.2% ($2,746)
Median real estate property taxes paid for housing units with mortgages in 2022: $3,244 (0.9%) Median real estate property taxes paid for housing units with no mortgage in 2022: $2,704 (0.8%)
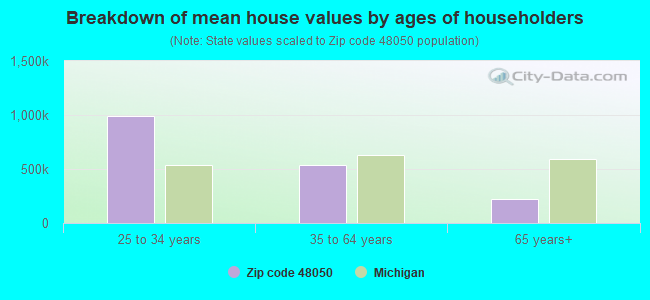
Estimated median house/condo value in 2022: $361,093
48050:
$361,093
Michigan:
$224,400
According to our research of Michigan and other state lists, there were 2 registered sex offenders living in 48050 zip code as of May 28, 2024. The ratio of all residents to sex offenders in zip code 48050 is 1,049 to 1. The ratio of registered sex offenders to all residents in this zip code is much lower than the state average.
Median resident age:
This zip code:
54.0 years
Michigan median age:
40.3 years
Average household size:
This zip code:
2.5 people
Michigan:
2.4 people
Averages for the 2020 tax year for zip code 48050, filed in 2021:
Average Adjusted Gross Income (AGI) in 2020: $67,666 (Individual Income Tax Returns)
Here:
$67,666
State:
$68,945
Salary/wage: $63,169 (reported on 77.0% of returns)
Here:
$63,169
State:
$57,142
(% of AGI for various income ranges: 999.4% for AGIs below $25k, 3440.0% for AGIs $25k-50k, 5183.3% for AGIs $50k-75k, 8448.6% for AGIs $75k-100k, 14606.2% for AGIs $100k-200k)
Taxable interest for individuals: $1,071 (reported on 39.1% of returns)
This zip code:
$1,071
Michigan:
$1,630
(% of AGI for various income ranges: 53.1% for AGIs below $25k, 32.5% for AGIs $25k-50k, 45.6% for AGIs $50k-75k, 67.1% for AGIs $75k-100k, 73.8% for AGIs $100k-200k)
Ordinary dividends: $1,975 (reported on 23.0% of returns)
Here:
$1,975
State:
$6,972
(% of AGI for various income ranges: 53.1% for AGIs below $25k, 30.8% for AGIs $25k-50k, 61.1% for AGIs $50k-75k, 147.1% for AGIs $75k-100k, 88.5% for AGIs $100k-200k)
Net capital gain/loss in AGI: +$7,856 (reported on 20.7% of returns)
Here:
+$7,856
State:
+$20,064
(% of AGI for various income ranges: 18.8% for AGIs below $25k, 71.7% for AGIs $25k-50k, 125.6% for AGIs $50k-75k, 207.1% for AGIs $75k-100k, 800.0% for AGIs $100k-200k)
Profit/loss from business: +$6,736 (reported on 12.6% of returns)
Here:
+$6,736
State:
+$11,172
(% of AGI for various income ranges: 79.4% for AGIs below $25k, 421.1% for AGIs $50k-75k, 180.8% for AGIs $100k-200k)
Taxable individual retirement arrangement distribution: $13,117 (reported on 13.8% of returns)
48050:
$13,117
Michigan:
$19,803
(% of AGI for various income ranges: 153.8% for AGIs below $25k, 328.3% for AGIs $25k-50k, 484.3% for AGIs $75k-100k, 457.7% for AGIs $100k-200k)
Total itemized deductions: $23,671 (reported on 8.0% of returns)
Here:
$23,671
State:
$34,117
(% of AGI for various income ranges: 580.0% for AGIs $25k-50k, 739.2% for AGIs $100k-200k)
Charity contributions: $4,760 (reported on 5.7% of returns)
Here:
$4,760
State:
$13,548
(% of AGI for various income ranges: 183.1% for AGIs $100k-200k)
Taxes paid: $7,429 (reported on 8.0% of returns)
48050:
$7,429
State:
$7,972
(% of AGI for various income ranges: 150.0% for AGIs $25k-50k, 261.5% for AGIs $100k-200k)
Earned income credit: $1,520 (reported on 5.7% of returns)
Here:
$1,520
State:
$2,251
(% of AGI for various income ranges: 47.5% for AGIs below $25k)
Percentage of individuals using paid preparers for their 2020 taxes: 92.0%
Here:
92%
State:
93%
(% for various income ranges: 92.6% for AGIs below $25k, 93.8% for AGIs $25k-50k, 91.7% for AGIs $50k-75k, 90.9% for AGIs $75k-100k, 88.9% for AGIs $100k-200k, 100.0% for AGIs over 200k)
Averages for the 2012 tax year for zip code 48050, filed in 2013:
Average Adjusted Gross Income (AGI) in 2012: $59,902 (Individual Income Tax Returns)
Here:
$59,902
State:
$55,609
Salary/wage: $50,980 (reported on 80.2% of returns)
Here:
$50,980
State:
$46,782
(% of AGI for various income ranges: 57.1% for AGIs below $25k, 65.1% for AGIs $25k-50k, 72.5% for AGIs $50k-75k, 71.2% for AGIs $75k-100k, 68.4% for AGIs $100k-200k)
Taxable interest for individuals: $714 (reported on 44.4% of returns)
This zip code:
$714
Michigan:
$1,491
(% of AGI for various income ranges: 1.2% for AGIs below $25k, 1.1% for AGIs $25k-50k, 0.3% for AGIs $50k-75k, 0.3% for AGIs $75k-100k, 0.4% for AGIs $100k-200k)
Ordinary dividends: $1,995 (reported on 23.5% of returns)
Here:
$1,995
State:
$6,225
(% of AGI for various income ranges: 2.7% for AGIs below $25k, 1.0% for AGIs $25k-50k, 0.9% for AGIs $50k-75k, 0.6% for AGIs $75k-100k, 0.5% for AGIs $100k-200k)
Net capital gain/loss in AGI: +$1,394 (reported on 21.0% of returns)
Here:
+$1,394
State:
+$9,326
(% of AGI for various income ranges: 1.3% for AGIs $100k-200k)
Profit/loss from business: +$7,200 (reported on 13.6% of returns)
Here:
+$7,200
State:
+$11,523
(% of AGI for various income ranges: 9.5% for AGIs below $25k, 3.6% for AGIs $50k-75k, 0.9% for AGIs $100k-200k)
Taxable individual retirement arrangement distribution: $10,183 (reported on 14.8% of returns)
48050:
$10,183
Michigan:
$15,298
(% of AGI for various income ranges: 7.3% for AGIs below $25k, 8.3% for AGIs $25k-50k, 5.5% for AGIs $75k-100k)
Total itemized deductions: $19,517 (19% of AGI, reported on 35.8% of returns)
Here:
$19,517
State:
$21,628
Here:
19.1% of AGI
State:
18.4% of AGI
(% of AGI for various income ranges: 11.2% for AGIs below $25k, 10.0% for AGIs $25k-50k, 9.8% for AGIs $50k-75k, 13.6% for AGIs $75k-100k, 12.0% for AGIs $100k-200k)
Charity contributions: $2,584 (reported on 30.9% of returns)
Here:
$2,584
State:
$4,225
(% of AGI for various income ranges: 1.1% for AGIs $25k-50k, 0.7% for AGIs $50k-75k, 2.1% for AGIs $75k-100k, 1.5% for AGIs $100k-200k)
Taxes paid: $7,252 (reported on 35.8% of returns)
48050:
$7,252
State:
$8,327
(% of AGI for various income ranges: 2.4% for AGIs below $25k, 2.7% for AGIs $25k-50k, 2.9% for AGIs $50k-75k, 4.7% for AGIs $75k-100k, 5.3% for AGIs $100k-200k)
Earned income credit: $2,429 (reported on 8.6% of returns)
Here:
$2,429
State:
$2,306
(% of AGI for various income ranges: 4.9% for AGIs below $25k)
Percentage of individuals using paid preparers for their 2012 taxes: 61.7%
Here:
62%
State:
57%
(% for various income ranges: 53.3% for AGIs below $25k, 62.5% for AGIs $25k-50k, 72.7% for AGIs $50k-75k, 60.0% for AGIs $75k-100k, 71.4% for AGIs $100k-200k)
Averages for the 2004 tax year for zip code 48050, filed in 2005:
Average Adjusted Gross Income (AGI) in 2004: $52,021 (Individual Income Tax Returns)
Here:
$52,021
State:
$48,204
Salary/wage: $50,201 (reported on 83.6% of returns)
Here:
$50,201
State:
$42,791
(% of AGI for various income ranges: 92.0% for AGIs below $10k, 66.0% for AGIs $10k-25k, 69.0% for AGIs $25k-50k, 80.8% for AGIs $50k-75k, 86.7% for AGIs $75k-100k, 83.1% for AGIs over 100k)
Taxable interest for individuals: $1,050 (reported on 64.1% of returns)
This zip code:
$1,050
Michigan:
$1,725
(% of AGI for various income ranges: 4.4% for AGIs below $10k, 5.4% for AGIs $10k-25k, 1.9% for AGIs $25k-50k, 1.8% for AGIs $50k-75k, 0.4% for AGIs $75k-100k, 0.6% for AGIs over 100k)
Taxable dividends: $954 (reported on 28.2% of returns)
Here:
$954
State:
$3,420
(% of AGI for various income ranges: 1.8% for AGIs below $10k, 2.0% for AGIs $10k-25k, 1.0% for AGIs $25k-50k, 0.4% for AGIs $50k-75k, 0.2% for AGIs $75k-100k, 0.3% for AGIs over 100k)
Net capital gain/loss: +$1,846 (reported on 20.7% of returns)
Here:
+$1,846
State:
+$8,532
(% of AGI for various income ranges: -2.7% for AGIs below $10k, -0.4% for AGIs $10k-25k, -0.0% for AGIs $25k-50k, 0.2% for AGIs $50k-75k, 0.2% for AGIs $75k-100k, 1.8% for AGIs over 100k)
Profit/loss from business: +$5,980 (reported on 12.0% of returns)
Here:
+$5,980
State:
+$9,547
(% of AGI for various income ranges: 11.5% for AGIs below $10k, 7.3% for AGIs $10k-25k, 4.9% for AGIs $25k-50k, 0.0% for AGIs $50k-75k, 0.4% for AGIs $75k-100k)
IRA payment deduction: $2,417 (reported on 1.4% of returns)
48050:
$2,417
Michigan:
$2,875
Total itemized deductions: $18,269 (21% of AGI, reported on 41.7% of returns)
Here:
$18,269
State:
$18,509
Here:
20.8% of AGI
State:
20.7% of AGI
(% of AGI for various income ranges: 13.8% for AGIs $10k-25k, 13.8% for AGIs $25k-50k, 14.2% for AGIs $50k-75k, 18.6% for AGIs $75k-100k, 13.9% for AGIs over 100k)
Charity contributions deductions: $3,066 (3% of AGI, reported on 37.8% of returns)
Here:
$3,066
State:
$3,365
Here:
3.3% of AGI
State:
3.6% of AGI
(% of AGI for various income ranges: 1.0% for AGIs $10k-25k, 1.6% for AGIs $25k-50k, 1.4% for AGIs $50k-75k, 2.1% for AGIs $75k-100k, 3.2% for AGIs over 100k)
Total tax: $7,289 (reported on 81.0% of returns)
48050:
$7,289
State:
$7,691
(% of AGI for various income ranges: 2.7% for AGIs below $10k, 4.8% for AGIs $10k-25k, 7.4% for AGIs $25k-50k, 8.3% for AGIs $50k-75k, 9.6% for AGIs $75k-100k, 16.3% for AGIs over 100k)
Earned income credit: $1,610 (reported on 7.0% of returns)
Here:
$1,610
State:
$1,737
Percentage of individuals using paid preparers for their 2004 taxes: 62.0%
Here:
62%
State:
60%
(% for various income ranges: 48.1% for AGIs below $10k, 64.2% for AGIs $10k-25k, 67.9% for AGIs $25k-50k, 65.9% for AGIs $50k-75k, 66.0% for AGIs $75k-100k, 64.7% for AGIs over 100k)
Household received Food Stamps/SNAP in the past 12 months: 37 Household did not receive Food Stamps/SNAP in the past 12 months: 525
Women who had a birth in the past 12 months: 49 (50 now married, 0 unmarried) Women who did not have a birth in the past 12 months: 136 (82 now married, 54 unmarried)
Housing units in zip code 48050 with a mortgage: 283 (34 second mortgage, 27 both second mortgage and home equity loan) Houses without a mortgage: 37
Median monthly owner costs for units with a mortgage: $1,495 Median monthly owner costs for units without a mortgage: $481
Residents with income below the poverty level in 2022:
This zip code:
1.4%
Whole state:
13.4%
Residents with income below 50% of the poverty level in 2022:
This zip code:
1.0%
Whole state:
6.9%
Median number of rooms in houses and condos:
Here:
6.6
State:
6.5
Median number of rooms in apartments:
Here:
4.7
State:
4.3
Notable locations in this zip code not listed on our city pages
Notable locations in zip code 48050: Richmond - Lenox Emergency Medical Services Ambulance Authority House 1 Headquarters (A), Lenox Township Fire Department Station 2 (B). Display/hide their locations on the map
Churches in zip code 48050 include: Independent Church (A), Saint Joseph Novitiate (B), Richmond Assembly of God Church (C). Display/hide their locations on the map
Streams, rivers, and creeks: Harrison Drain (A), Highbank Creek (B), Fistler Drain (C), Smith Drain (D), Anderson Drain (E), Dixon Drain (F), Norton Drain (G). Display/hide their locations on the map
In group quarters: 7 (-1 institutionalized population)
Size of family households: 260 2-persons, 103 3-persons, 49 4-persons, 36 5-persons, 11 6-persons
Size of nonfamily households: 94 1-person, 9 2-persons
210 married couples with children.
0 single-parent households ().
96.7% of residents of 48050 zip code speak English at home.
0.1% of residents speak Spanish at home (100% very well).
2.8% of residents speak other Indo-European language at home (71% very well, 29% well).
0.6% of residents speak other language at home (100% well).
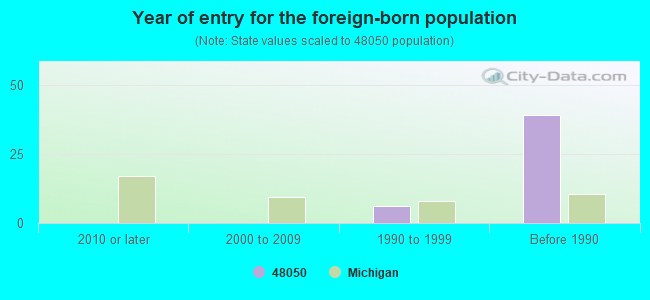
Foreign born population: 49 (3.5%) (47.3% of them are naturalized citizens)
This zip code:
3.5%
Whole state:
6.9%
22%North Macedonia (Macedonia)
18%Kuwait
14%France
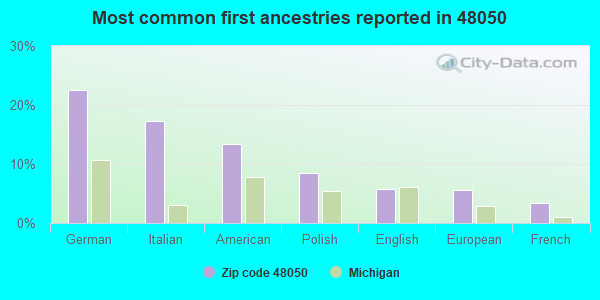
22%German
17%Italian
13%American
8%Polish
6%English
6%European
3%French
Year of entry for the foreign-born population
02010 or later
02000 to 2009
61990 to 1999
39Before 1990
Facilities with environmental interests located in this zip code:
ANR PIPELINE COMPANY (36555 29 MILE ROAD in LENOX, MI)
AIR MAJOR (AIRS/AFS) CRITERIA AND HAZARDOUS AIR POLLUTANT INVENTORY (Inventory of air pollution sources) (Resource Conservation and Recovery Act (tracking hazardous waste)) Conditionally Exempt Small Quantity Generators, less than 100 kg/month of hazardous waste (Resource Conservation and Recovery Act (tracking hazardous waste)) Business SIC classification: NATURAL GAS TRANSMISSION Business NAICS classification: PIPELINE TRANSPORTATION OF NATURAL GAS. Alternative names: ANR PIPELINE CO MUTTONVILLE, ANR PIPELINE CO MUTTONVILLE CS, MICH-WIS CONS, MUTTONVILLE COMPRESSOR STATION
BASSETT RESIDENCE (29434 32 MILE RD in LENOX TOWNSHIP, MI)
(Resource Conservation and Recovery Act (tracking hazardous waste)) Organizations: SHIRLEY & HARRY BASSETT (CONTACT/OPERATOR)
AIS CONSTRUCTION EQUIPMENT CORP (65809 GRATIOT AVE in NEW HAVEN, MI)
Small Quantity Generators, between 100 kg and 1000 kg of hazardous waste/month (Resource Conservation and Recovery Act (tracking hazardous waste))
Housing units lacking complete kitchen facilities: 0.9%
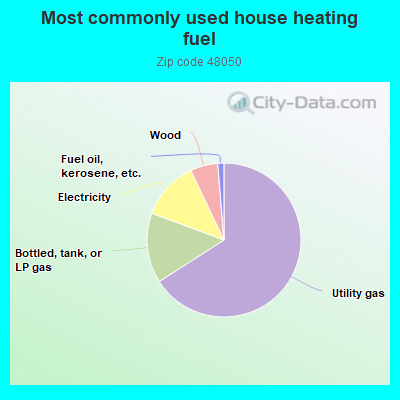
66.2%Utility gas
14.8%Bottled, tank, or LP gas
12.3%Electricity
5.8%Wood
1.3%Fuel oil, kerosene, etc.
Place of birth for U.S.-born residents:
This state: 1,162
Northeast: 37
Midwest: 96
South: 31
West: 47
79% of the 48050 zip code residents lived in the same house 5 years ago. Out of people who lived in different houses, 87% lived in this county. Out of people who lived in different counties, 50% lived in Michigan.
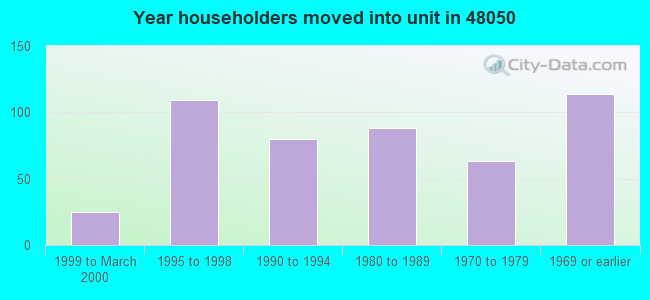
94% of the 48050 zip code residents lived in the same house 1 year ago. Out of people who lived in different houses, 80% moved from this county. Out of people who lived in different houses, 19% moved from different county within same state.
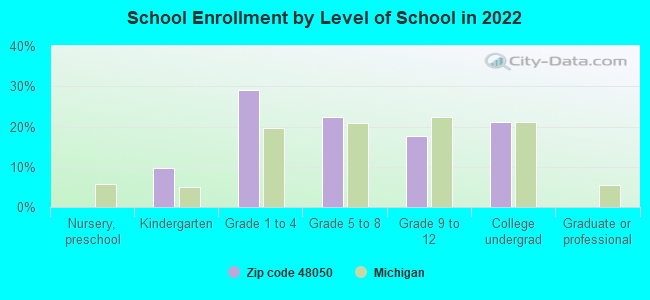
Private vs. public school enrollment:
Students in private schools in grades 1 to 8 (elementary and middle school): 17
Here:
15.3%
Michigan:
12.4%
Students in private schools in grades 9 to 12 (high school): 9
Here:
23.9%
Michigan:
9.8%
Students in private undergraduate colleges: 9
Here:
20.3%
Michigan:
14.9%
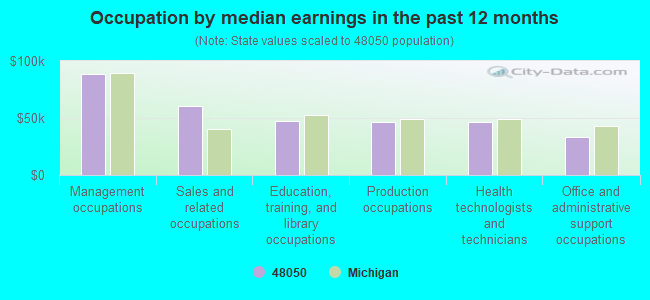
Occupation by median earnings in the past 12 months ($)
88,286Management occupations
60,700Sales and related occupations
47,649Education, training, and library occupations
46,588Production occupations
46,446Health technologists and technicians
33,332Office and administrative support occupations
Companies with federal contracts located in this zip code:
A I S CONSTRUCTION EQUIPMENT C (65809 GRATIOT AVE in NEW HAVEN, MI; small business)
$28,509 with Army for Maintenance, Repair or Alteration of Real Property -- Tank Automotive Facilities. Signed on 2006-04-05. Completion date: 2006-03-31.
A I S CONSTRUCTION EQUIPMENT C (65809 GRATIOT AVE in LENOX, MI; small business) : $10,840 in 2 contractsfrom 2002 to 2003
$5,440 with Army for Vehicular Cab, Body, and Frame Structural Components. Signed on 2002-09-30. Completion date: 2002-11-08.
$5,400 with Army for Gardening Implements and Tools. Signed on 2003-04-14. Completion date: 2003-04-11.
DESROSIERS, JULIE L (30535 30 MILE RD in NEW HAVEN, MI; small business) : $7,200 in 2 contractsin 2005
$7,200 with Army for Chaplain Services. Signed on 2005-12-13. Completion date: 2006-09-30.
$0, same as above.Signed on 2005-12-13. Completion date: 2006-09-30.
Top industries in this zip code by the number of employees in 2005:
Management of Companies and Enterprises: Corporate, Subsidiary, and Regional Managing Offices (100-249 employees: 1 establishment)
Accommodation and Food Services: Full-Service Restaurants (50-99: 1, 20-49: 1)
Arts, Entertainment, and Recreation: Fitness and Recreational Sports Centers (20-49: 1)
People in group quarters in 2010:
11 people in group homes intended for adults
People in group quarters in 2000:
34 people in homes for the mentally ill
4 people in homes for the mentally retarded
Fatal accident statistics in 2012:
Fatal accident count: 1
Vehicles involved in fatal accidents: 2
Fatal accidents caused by drunken drivers: 1
Fatalities: 1
Persons involved in fatal accidents: 2
Pedestrians involved in fatal accidents: 0
Home Mortgage Disclosure Act Aggregated Statistics For Year 2009 (Based on 2 partial tracts)
A) FHA, FSA/RHS & VA Home Purchase Loans
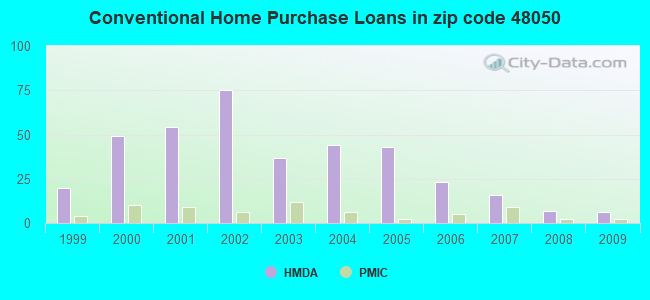
B) Conventional Home Purchase Loans
C) Refinancings
D) Home Improvement Loans
F) Non-occupant Loans on < 5 Family Dwellings (A B C & D)
Number
Average Value
Number
Average Value
Number
Average Value
Number
Average Value
Number
Average Value
LOANS ORIGINATED
8
$123,954
6
$103,012
52
$159,046
0
$0
2
$226,400
APPLICATIONS APPROVED, NOT ACCEPTED
1
$295,450
1
$169,800
7
$153,143
2
$18,110
2
$89,430
APPLICATIONS DENIED
0
$0
3
$45,657
22
$189,198
3
$11,320
3
$45,657
APPLICATIONS WITHDRAWN
0
$0
0
$0
6
$194,327
1
$28,300
0
$0
FILES CLOSED FOR INCOMPLETENESS
0
$0
0
$0
5
$80,824
0
$0
0
$0
Aggregated Statistics For Year 2008 (Based on 2 partial tracts)
A) FHA, FSA/RHS & VA Home Purchase Loans
B) Conventional Home Purchase Loans
C) Refinancings
D) Home Improvement Loans
F) Non-occupant Loans on < 5 Family Dwellings (A B C & D)
G) Loans On Manufactured Home Dwelling (A B C & D)
Number
Average Value
Number
Average Value
Number
Average Value
Number
Average Value
Number
Average Value
Number
Average Value
LOANS ORIGINATED
8
$158,905
7
$98,484
44
$142,709
2
$13,020
3
$104,900
0
$0
APPLICATIONS APPROVED, NOT ACCEPTED
0
$0
1
$284,130
6
$129,048
1
$28,300
0
$0
0
$0
APPLICATIONS DENIED
0
$0
2
$131,880
36
$167,347
6
$25,282
1
$88,300
2
$76,410
APPLICATIONS WITHDRAWN
0
$0
3
$186,780
10
$195,723
1
$14,720
3
$207,910
0
$0
FILES CLOSED FOR INCOMPLETENESS
0
$0
0
$0
1
$470,910
1
$22,640
0
$0
0
$0
Aggregated Statistics For Year 2007 (Based on 2 partial tracts)
A) FHA, FSA/RHS & VA Home Purchase Loans
B) Conventional Home Purchase Loans
C) Refinancings
D) Home Improvement Loans
F) Non-occupant Loans on < 5 Family Dwellings (A B C & D)
G) Loans On Manufactured Home Dwelling (A B C & D)
Number
Average Value
Number
Average Value
Number
Average Value
Number
Average Value
Number
Average Value
Number
Average Value
LOANS ORIGINATED
1
$155,080
16
$198,171
60
$154,084
6
$88,297
0
$0
0
$0
APPLICATIONS APPROVED, NOT ACCEPTED
0
$0
2
$178,855
19
$181,656
5
$31,696
1
$158,480
0
$0
APPLICATIONS DENIED
2
$196,400
11
$161,773
38
$197,772
6
$153,575
3
$190,177
3
$84,900
APPLICATIONS WITHDRAWN
0
$0
1
$113,200
12
$157,914
0
$0
0
$0
0
$0
FILES CLOSED FOR INCOMPLETENESS
0
$0
0
$0
5
$140,820
0
$0
0
$0
0
$0
Aggregated Statistics For Year 2006 (Based on 2 partial tracts)
A) FHA, FSA/RHS & VA Home Purchase Loans
B) Conventional Home Purchase Loans
C) Refinancings
D) Home Improvement Loans
F) Non-occupant Loans on < 5 Family Dwellings (A B C & D)
Number
Average Value
Number
Average Value
Number
Average Value
Number
Average Value
Number
Average Value
LOANS ORIGINATED
1
$158,480
23
$128,014
76
$146,192
16
$62,048
3
$121,500
APPLICATIONS APPROVED, NOT ACCEPTED
0
$0
9
$145,022
17
$140,168
2
$31,695
0
$0
APPLICATIONS DENIED
0
$0
24
$138,859
80
$176,040
5
$28,074
10
$156,895
APPLICATIONS WITHDRAWN
1
$209,420
8
$183,950
26
$194,617
1
$39,620
3
$134,707
FILES CLOSED FOR INCOMPLETENESS
0
$0
0
$0
12
$268,284
0
$0
0
$0
Aggregated Statistics For Year 2005 (Based on 2 partial tracts)
A) FHA, FSA/RHS & VA Home Purchase Loans
B) Conventional Home Purchase Loans
C) Refinancings
D) Home Improvement Loans
F) Non-occupant Loans on < 5 Family Dwellings (A B C & D)
G) Loans On Manufactured Home Dwelling (A B C & D)
Number
Average Value
Number
Average Value
Number
Average Value
Number
Average Value
Number
Average Value
Number
Average Value
LOANS ORIGINATED
3
$227,533
43
$172,064
111
$156,695
10
$31,243
3
$238,473
1
$163,010
APPLICATIONS APPROVED, NOT ACCEPTED
1
$254,700
5
$123,388
22
$160,795
3
$17,733
1
$356,580
2
$22,075
APPLICATIONS DENIED
0
$0
12
$83,391
40
$200,138
7
$101,557
5
$143,538
3
$24,527
APPLICATIONS WITHDRAWN
0
$0
6
$264,133
24
$182,157
3
$156,593
1
$1,130
0
$0
FILES CLOSED FOR INCOMPLETENESS
0
$0
6
$127,538
14
$171,741
1
$338,470
0
$0
0
$0
Aggregated Statistics For Year 2004 (Based on 2 partial tracts)
A) FHA, FSA/RHS & VA Home Purchase Loans
B) Conventional Home Purchase Loans
C) Refinancings
D) Home Improvement Loans
E) Loans on Dwellings For 5+ Families
F) Non-occupant Loans on < 5 Family Dwellings (A B C & D)
G) Loans On Manufactured Home Dwelling (A B C & D)
Number
Average Value
Number
Average Value
Number
Average Value
Number
Average Value
Number
Average Value
Number
Average Value
Number
Average Value
LOANS ORIGINATED
3
$201,120
44
$174,560
136
$163,491
9
$82,636
1
$283,000
3
$271,680
1
$107,540
APPLICATIONS APPROVED, NOT ACCEPTED
0
$0
2
$243,380
12
$215,646
1
$11,320
0
$0
0
$0
1
$203,760
APPLICATIONS DENIED
1
$169,800
10
$146,028
50
$149,718
7
$48,191
1
$398,460
1
$117,730
6
$82,447
APPLICATIONS WITHDRAWN
0
$0
5
$112,974
28
$195,957
1
$99,620
0
$0
1
$398,460
0
$0
FILES CLOSED FOR INCOMPLETENESS
0
$0
3
$223,380
23
$172,310
1
$16,980
0
$0
0
$0
0
$0
Aggregated Statistics For Year 2003 (Based on 2 partial tracts)
A) FHA, FSA/RHS & VA Home Purchase Loans
B) Conventional Home Purchase Loans
C) Refinancings
D) Home Improvement Loans
F) Non-occupant Loans on < 5 Family Dwellings (A B C & D)
Number
Average Value
Number
Average Value
Number
Average Value
Number
Average Value
Number
Average Value
LOANS ORIGINATED
9
$142,003
37
$163,008
328
$142,128
7
$44,794
5
$148,744
APPLICATIONS APPROVED, NOT ACCEPTED
0
$0
17
$127,384
50
$137,968
16
$55,044
2
$81,505
APPLICATIONS DENIED
0
$0
14
$121,771
79
$150,169
14
$70,184
5
$121,124
APPLICATIONS WITHDRAWN
0
$0
6
$175,837
36
$157,442
1
$21,510
0
$0
FILES CLOSED FOR INCOMPLETENESS
1
$169,800
2
$215,080
10
$221,872
0
$0
0
$0
Aggregated Statistics For Year 2002 (Based on 2 partial tracts)
A) FHA, FSA/RHS & VA Home Purchase Loans
B) Conventional Home Purchase Loans
C) Refinancings
D) Home Improvement Loans
E) Loans on Dwellings For 5+ Families
F) Non-occupant Loans on < 5 Family Dwellings (A B C & D)
Number
Average Value
Number
Average Value
Number
Average Value
Number
Average Value
Number
Average Value
Number
Average Value
LOANS ORIGINATED
5
$150,782
75
$140,051
252
$149,792
19
$36,641
1
$281,870
6
$145,650
APPLICATIONS APPROVED, NOT ACCEPTED
1
$178,860
12
$153,103
34
$139,902
19
$57,911
0
$0
0
$0
APPLICATIONS DENIED
0
$0
18
$106,031
46
$97,893
12
$48,110
0
$0
2
$237,720
APPLICATIONS WITHDRAWN
0
$0
6
$183,195
28
$186,335
1
$33,960
0
$0
1
$28,300
FILES CLOSED FOR INCOMPLETENESS
0
$0
1
$172,060
16
$149,495
1
$56,600
0
$0
0
$0
Aggregated Statistics For Year 2001 (Based on 2 partial tracts)
A) FHA, FSA/RHS & VA Home Purchase Loans
B) Conventional Home Purchase Loans
C) Refinancings
D) Home Improvement Loans
F) Non-occupant Loans on < 5 Family Dwellings (A B C & D)
Number
Average Value
Number
Average Value
Number
Average Value
Number
Average Value
Number
Average Value
LOANS ORIGINATED
9
$140,117
54
$146,720
229
$132,582
27
$32,996
3
$172,063
APPLICATIONS APPROVED, NOT ACCEPTED
0
$0
2
$270,550
41
$142,936
6
$65,278
0
$0
APPLICATIONS DENIED
1
$169,800
15
$73,127
32
$161,381
9
$22,891
1
$37,360
APPLICATIONS WITHDRAWN
0
$0
5
$187,912
26
$141,065
6
$45,092
2
$84,900
FILES CLOSED FOR INCOMPLETENESS
0
$0
0
$0
3
$248,663
1
$58,860
0
$0
Aggregated Statistics For Year 2000 (Based on 2 partial tracts)
A) FHA, FSA/RHS & VA Home Purchase Loans
B) Conventional Home Purchase Loans
C) Refinancings
D) Home Improvement Loans
F) Non-occupant Loans on < 5 Family Dwellings (A B C & D)
Number
Average Value
Number
Average Value
Number
Average Value
Number
Average Value
Number
Average Value
LOANS ORIGINATED
2
$174,330
49
$138,173
65
$110,797
29
$26,543
3
$130,933
APPLICATIONS APPROVED, NOT ACCEPTED
0
$0
9
$66,788
18
$128,104
7
$38,811
0
$0
APPLICATIONS DENIED
0
$0
26
$46,282
36
$114,458
14
$12,048
2
$57,730
APPLICATIONS WITHDRAWN
1
$93,960
3
$146,783
9
$95,340
1
$41,880
1
$47,540
FILES CLOSED FOR INCOMPLETENESS
0
$0
1
$47,540
11
$201,907
2
$22,640
1
$47,540
Aggregated Statistics For Year 1999 (Based on 1 partial tract)
A) FHA, FSA/RHS & VA Home Purchase Loans
B) Conventional Home Purchase Loans
C) Refinancings
D) Home Improvement Loans
F) Non-occupant Loans on < 5 Family Dwellings (A B C & D)
Detailed PMIC statistics for the following Tracts:2170.00
2002 - 2018 National Fire Incident Reporting System (NFIRS) incidents
Based on the data from the years 2002 - 2018 the average number of fires per year is 6. The highest number of fires - 18 took place in 2014, and the least - 0 in 2009. The data has a growing trend.
When looking into fire subcategories, the most reports belonged to: Structure Fires (40.6%), and Outside Fires (33.7%).
Fire incident types reported to NFIRS in Zip Code 48050


 Nearest zip codes: 48048, 48062, 48051, 48047, 48096, 48064.


 Based on the data from the years 2002 - 2018 the average number of fires per year is 6. The highest number of fires - 18 took place in 2014, and the least - 0 in 2009. The data has a growing trend.
 When looking into fire subcategories, the most reports belonged to: Structure Fires (40.6%), and Outside Fires (33.7%).