Estimated zip code population in 2022: 3,405 Zip code population in 2010: 3,095 Zip code population in 2000: 3,338
Houses and condos: 1,248 Renter-occupied apartments: 88
% of renters here:
7%
State:
27%
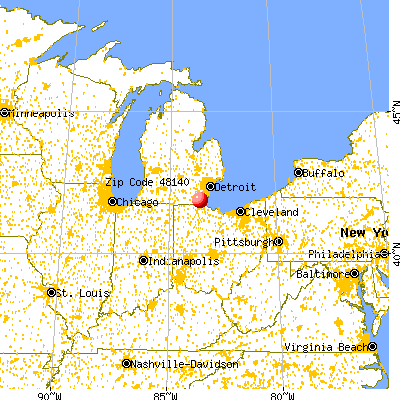
March 2022 cost of living index in zip code 48140: 90.3 (less than average, U.S. average is 100)
Land area: 26.6 sq. mi. Water area: 0.1 sq. mi.
Population density: 128 people per square mile
(very low).
OSM Map
General Map
Google Map
MSN Map
OSM Map
General Map
Google Map
MSN Map
OSM Map
General Map
Google Map
MSN Map
OSM Map
General Map
Google Map
MSN Map
Please wait while loading the map...
Real estate property taxes paid for housing units in 2022:
This zip code:
0.8% ($2,136)
Michigan:
1.2% ($2,746)
Median real estate property taxes paid for housing units with mortgages in 2022: $2,114 (0.8%) Median real estate property taxes paid for housing units with no mortgage in 2022: $2,231 (0.8%)
Business Search- 14 Million verified businesses
Males: 1,714
(50.4%)
Females: 1,690
(49.6%)
For population 25 years and over in 48140:
High school or higher: 97.5%
Bachelor's degree or higher: 22.6%
Graduate or professional degree: 6.5%
Unemployed: 2.5%
Mean travel time to work (commute): 31.3 minutes
For population 15 years and over in 48140:
Never married: 30.4%
Now married: 52.0%
Separated: 0.9%
Widowed: 4.7%
Divorced: 12.0%
Zip code 48140 compared to state average:
Median household income above state average.
Unemployed percentage below state average.
Black race population percentage significantly below state average.
Hispanic race population percentage significantly below state average.
Foreign-born population percentage significantly below state average.
Renting percentage significantly below state average.
Length of stay since moving in above state average.
Estimated median house/condo value in 2022: $268,700
48140:
$268,700
Michigan:
$224,400
According to our research of Michigan and other state lists, there were 5 registered sex offenders living in 48140 zip code as of June 08, 2024. The ratio of all residents to sex offenders in zip code 48140 is 695 to 1. The ratio of registered sex offenders to all residents in this zip code is lower than the state average.
Median resident age:
This zip code:
38.1 years
Michigan median age:
40.3 years
Average household size:
This zip code:
2.8 people
Michigan:
2.4 people
Averages for the 2020 tax year for zip code 48140, filed in 2021:
Average Adjusted Gross Income (AGI) in 2020: $71,573 (Individual Income Tax Returns)
Here:
$71,573
State:
$68,945
Salary/wage: $64,828 (reported on 79.4% of returns)
Here:
$64,828
State:
$57,142
(% of AGI for various income ranges: 1096.4% for AGIs below $25k, 3377.1% for AGIs $25k-50k, 6248.0% for AGIs $50k-75k, 9459.2% for AGIs $75k-100k, 15673.6% for AGIs $100k-200k, 67130.0% for AGIs over 200k)
Taxable interest for individuals: $712 (reported on 36.1% of returns)
This zip code:
$712
Michigan:
$1,630
(% of AGI for various income ranges: 27.1% for AGIs below $25k, 35.7% for AGIs $25k-50k, 34.7% for AGIs $50k-75k, 37.7% for AGIs $75k-100k, 50.9% for AGIs $100k-200k, 175.0% for AGIs over 200k)
Ordinary dividends: $2,256 (reported on 23.2% of returns)
Here:
$2,256
State:
$6,972
(% of AGI for various income ranges: 27.5% for AGIs below $25k, 63.3% for AGIs $25k-50k, 92.0% for AGIs $50k-75k, 78.5% for AGIs $75k-100k, 114.1% for AGIs $100k-200k, 555.0% for AGIs over 200k)
Net capital gain/loss in AGI: +$6,161 (reported on 20.0% of returns)
Here:
+$6,161
State:
+$20,064
(% of AGI for various income ranges: 2.1% for AGIs below $25k, 28.6% for AGIs $25k-50k, 123.3% for AGIs $50k-75k, 136.9% for AGIs $75k-100k, 230.5% for AGIs $100k-200k, 4870.0% for AGIs over 200k)
Profit/loss from business: +$11,228 (reported on 11.6% of returns)
Here:
+$11,228
State:
+$11,172
(% of AGI for various income ranges: 38.9% for AGIs below $25k, 96.7% for AGIs $25k-50k, 207.3% for AGIs $50k-75k, 180.0% for AGIs $75k-100k, 529.1% for AGIs $100k-200k)
Taxable individual retirement arrangement distribution: $14,800 (reported on 14.2% of returns)
48140:
$14,800
Michigan:
$19,803
(% of AGI for various income ranges: 86.8% for AGIs below $25k, 228.1% for AGIs $25k-50k, 330.7% for AGIs $50k-75k, 396.9% for AGIs $75k-100k, 691.8% for AGIs $100k-200k)
Total itemized deductions: $27,414 (reported on 4.5% of returns)
Here:
$27,414
State:
$34,117
(% of AGI for various income ranges: 211.0% for AGIs $25k-50k, 670.9% for AGIs $100k-200k)
Charity contributions: $10,240 (reported on 3.2% of returns)
Here:
$10,240
State:
$13,548
(% of AGI for various income ranges: 232.7% for AGIs $100k-200k)
Taxes paid: $8,400 (reported on 4.5% of returns)
48140:
$8,400
State:
$7,972
(% of AGI for various income ranges: 67.1% for AGIs $25k-50k, 203.2% for AGIs $100k-200k)
Earned income credit: $1,925 (reported on 7.7% of returns)
Here:
$1,925
State:
$2,251
(% of AGI for various income ranges: 52.9% for AGIs below $25k, 39.5% for AGIs $25k-50k)
Percentage of individuals using paid preparers for their 2020 taxes: 94.8%
Here:
95%
State:
93%
(% for various income ranges: 93.0% for AGIs below $25k, 96.7% for AGIs $25k-50k, 95.5% for AGIs $50k-75k, 95.2% for AGIs $75k-100k, 93.9% for AGIs $100k-200k, 100.0% for AGIs over 200k)
Averages for the 2012 tax year for zip code 48140, filed in 2013:
Average Adjusted Gross Income (AGI) in 2012: $57,868 (Individual Income Tax Returns)
Here:
$57,868
State:
$55,609
Salary/wage: $51,831 (reported on 83.8% of returns)
Here:
$51,831
State:
$46,782
(% of AGI for various income ranges: 66.5% for AGIs below $25k, 65.6% for AGIs $25k-50k, 73.7% for AGIs $50k-75k, 76.0% for AGIs $75k-100k, 80.2% for AGIs $100k-200k, 74.3% for AGIs over 200k)
Taxable interest for individuals: $678 (reported on 40.5% of returns)
This zip code:
$678
Michigan:
$1,491
(% of AGI for various income ranges: 1.5% for AGIs below $25k, 0.9% for AGIs $25k-50k, 0.4% for AGIs $50k-75k, 0.3% for AGIs $75k-100k, 0.4% for AGIs $100k-200k)
Ordinary dividends: $1,525 (reported on 24.3% of returns)
Here:
$1,525
State:
$6,225
(% of AGI for various income ranges: 1.4% for AGIs below $25k, 1.0% for AGIs $25k-50k, 0.3% for AGIs $50k-75k, 0.5% for AGIs $75k-100k, 0.8% for AGIs $100k-200k)
Net capital gain/loss in AGI: +$1,400 (reported on 14.9% of returns)
Here:
+$1,400
State:
+$9,326
(% of AGI for various income ranges: 0.2% for AGIs $75k-100k, 1.0% for AGIs $100k-200k)
Profit/loss from business: +$9,926 (reported on 12.8% of returns)
Here:
+$9,926
State:
+$11,523
(% of AGI for various income ranges: 5.2% for AGIs below $25k, 2.8% for AGIs $25k-50k, 2.4% for AGIs $50k-75k, 1.2% for AGIs $75k-100k, 2.4% for AGIs $100k-200k)
Taxable individual retirement arrangement distribution: $11,924 (reported on 11.5% of returns)
48140:
$11,924
Michigan:
$15,298
(% of AGI for various income ranges: 2.3% for AGIs below $25k, 4.3% for AGIs $25k-50k, 2.6% for AGIs $50k-75k, 2.1% for AGIs $75k-100k, 2.3% for AGIs $100k-200k)
Total itemized deductions: $18,539 (19% of AGI, reported on 33.1% of returns)
Here:
$18,539
State:
$21,628
Here:
18.7% of AGI
State:
18.4% of AGI
(% of AGI for various income ranges: 8.9% for AGIs below $25k, 7.3% for AGIs $25k-50k, 11.1% for AGIs $50k-75k, 10.4% for AGIs $75k-100k, 12.1% for AGIs $100k-200k, 9.9% for AGIs over 200k)
Charity contributions: $2,345 (reported on 27.0% of returns)
Here:
$2,345
State:
$4,225
(% of AGI for various income ranges: 0.9% for AGIs $25k-50k, 0.9% for AGIs $50k-75k, 1.0% for AGIs $75k-100k, 1.5% for AGIs $100k-200k, 1.5% for AGIs over 200k)
Taxes paid: $6,608 (reported on 33.1% of returns)
48140:
$6,608
State:
$8,327
(% of AGI for various income ranges: 1.1% for AGIs below $25k, 1.9% for AGIs $25k-50k, 3.0% for AGIs $50k-75k, 3.8% for AGIs $75k-100k, 4.9% for AGIs $100k-200k, 5.7% for AGIs over 200k)
Earned income credit: $1,985 (reported on 8.8% of returns)
Here:
$1,985
State:
$2,306
(% of AGI for various income ranges: 3.1% for AGIs below $25k, 0.7% for AGIs $25k-50k)
Percentage of individuals using paid preparers for their 2012 taxes: 62.2%
Here:
62%
State:
57%
(% for various income ranges: 56.9% for AGIs below $25k, 59.3% for AGIs $25k-50k, 60.9% for AGIs $50k-75k, 66.7% for AGIs $75k-100k, 70.8% for AGIs $100k-200k, 100.0% for AGIs over 200k)
Averages for the 2004 tax year for zip code 48140, filed in 2005:
Average Adjusted Gross Income (AGI) in 2004: $49,961 (Individual Income Tax Returns)
Here:
$49,961
State:
$48,204
Salary/wage: $47,292 (reported on 86.5% of returns)
Here:
$47,292
State:
$42,791
(% of AGI for various income ranges: 82.9% for AGIs below $10k, 65.5% for AGIs $10k-25k, 70.9% for AGIs $25k-50k, 84.3% for AGIs $50k-75k, 88.0% for AGIs $75k-100k, 83.3% for AGIs over 100k)
Taxable interest for individuals: $955 (reported on 56.6% of returns)
This zip code:
$955
Michigan:
$1,725
(% of AGI for various income ranges: 6.1% for AGIs below $10k, 3.0% for AGIs $10k-25k, 2.1% for AGIs $25k-50k, 0.8% for AGIs $50k-75k, 0.5% for AGIs $75k-100k, 0.6% for AGIs over 100k)
Taxable dividends: $1,368 (reported on 27.9% of returns)
Here:
$1,368
State:
$3,420
(% of AGI for various income ranges: 1.9% for AGIs below $10k, 1.6% for AGIs $10k-25k, 1.3% for AGIs $25k-50k, 0.2% for AGIs $50k-75k, 0.5% for AGIs $75k-100k, 0.9% for AGIs over 100k)
Net capital gain/loss: +$3,139 (reported on 18.4% of returns)
Here:
+$3,139
State:
+$8,532
(% of AGI for various income ranges: -2.2% for AGIs below $10k, 0.4% for AGIs $10k-25k, 0.5% for AGIs $25k-50k, 0.0% for AGIs $50k-75k, 0.4% for AGIs $75k-100k, 3.1% for AGIs over 100k)
Profit/loss from business: +$6,332 (reported on 14.7% of returns)
Here:
+$6,332
State:
+$9,547
(% of AGI for various income ranges: 5.2% for AGIs below $10k, 3.5% for AGIs $10k-25k, 3.5% for AGIs $25k-50k, 1.8% for AGIs $50k-75k, 0.8% for AGIs $75k-100k, 1.5% for AGIs over 100k)
IRA payment deduction: $2,172 (reported on 2.0% of returns)
48140:
$2,172
Michigan:
$2,875
Total itemized deductions: $16,478 (20% of AGI, reported on 41.1% of returns)
Here:
$16,478
State:
$18,509
Here:
20.1% of AGI
State:
20.7% of AGI
(% of AGI for various income ranges: 9.0% for AGIs $10k-25k, 11.7% for AGIs $25k-50k, 14.6% for AGIs $50k-75k, 15.3% for AGIs $75k-100k, 13.9% for AGIs over 100k)
Charity contributions deductions: $2,149 (3% of AGI, reported on 36.6% of returns)
Here:
$2,149
State:
$3,365
Here:
2.6% of AGI
State:
3.6% of AGI
(% of AGI for various income ranges: 0.8% for AGIs $10k-25k, 0.8% for AGIs $25k-50k, 1.7% for AGIs $50k-75k, 1.9% for AGIs $75k-100k, 1.8% for AGIs over 100k)
Total tax: $6,301 (reported on 80.9% of returns)
48140:
$6,301
State:
$7,691
(% of AGI for various income ranges: 3.2% for AGIs below $10k, 4.5% for AGIs $10k-25k, 7.1% for AGIs $25k-50k, 8.4% for AGIs $50k-75k, 9.4% for AGIs $75k-100k, 14.9% for AGIs over 100k)
Earned income credit: $1,449 (reported on 7.2% of returns)
Here:
$1,449
State:
$1,737
Percentage of individuals using paid preparers for their 2004 taxes: 62.0%
Here:
62%
State:
60%
(% for various income ranges: 49.1% for AGIs below $10k, 58.2% for AGIs $10k-25k, 65.8% for AGIs $25k-50k, 64.8% for AGIs $50k-75k, 68.4% for AGIs $75k-100k, 70.5% for AGIs over 100k)
Household received Food Stamps/SNAP in the past 12 months: 52 Household did not receive Food Stamps/SNAP in the past 12 months: 1,162
Women who had a birth in the past 12 months: 42 (43 now married, 0 unmarried) Women who did not have a birth in the past 12 months: 795 (359 now married, 435 unmarried)
Housing units in zip code 48140 with a mortgage: 840 (56 second mortgage, 58 both second mortgage and home equity loan) Houses without a mortgage: 30
Median monthly owner costs for units with a mortgage: $1,594 Median monthly owner costs for units without a mortgage: $527
Residents with income below the poverty level in 2022:
This zip code:
3.6%
Whole state:
13.4%
Residents with income below 50% of the poverty level in 2022:
This zip code:
1.4%
Whole state:
6.9%
Median number of rooms in houses and condos:
Here:
7.0
State:
6.5
Median number of rooms in apartments:
Here:
6.7
State:
4.3
Notable locations in this zip code not listed on our city pages
Notable locations in zip code 48140: Morocco Station (A), Lulu Station (B), Ida Township Volunteer Fire Department (C), Ida Brown Library (D), Ida Township Hall (E). Display/hide their locations on the map
Churches in zip code 48140 include: Immanuel Church (A), Prince of Peace Church (B), True Gospel Church (C), Lulu United Methodist Church (D), Cornerstone Baptist Church (E), Saint Joseph's Church (F), Community Christian Fellowship (G), Ida United Methodist Church (H), Morocco United Church (I). Display/hide their locations on the map
Cemeteries: Richardson Cemetery (1), Saint Joseph Cemetery (2), West Ida Emmanuel Lutheran Church Cemetery (3), Lulu Cemetery (4), Maplewood Cemetery (5). Display/hide their locations on the map
Streams, rivers, and creeks: West Bates Drain (A), Peters Drain (B), Wittkop Drain (C), Fitzgerald Drain (D), Shober Number One Drain (E), Darrow Drain (F). Display/hide their locations on the map
In group quarters: 7 (-1 institutionalized population)
Size of family households: 352 2-persons, 147 3-persons, 304 4-persons, 71 5-persons, 14 6-persons
Size of nonfamily households: 240 1-person, 61 2-persons, 24 4-persons
506 married couples with children.
146 single-parent households (77 men, 69 women).
98.8% of residents of 48140 zip code speak English at home.
0.4% of residents speak Spanish at home (100% very well).
0.2% of residents speak other language at home (100% very well).
Foreign born population: 45 (1.3%) (61.2% of them are naturalized citizens)
This zip code:
1.3%
Whole state:
6.9%
38%Romania
16%Georgia
36%German
30%American
6%English
5%Polish
2%Irish
2%Scottish
1%Italian
Year of entry for the foreign-born population
02010 or later
252000 to 2009
171990 to 1999
6Before 1990
Public high school in in zip code 48140 not listed on the city page:
IDA HIGH SCHOOL(Students: 569, Location: 3145 PRAIRIE ST, Grades: 9-12)
Public elementary/middle schools in in zip code 48140 not listed on the city page:
IDA MIDDLE SCHOOL(Students: 530, Location: 3143 PRAIRIE ST, Grades: 5-8)
Facilities with environmental interests located in this zip code:
ACTUATOR SPECIALTIES INC (8376 WESTWOOD in IDA, MI)
(Resource Conservation and Recovery Act (tracking hazardous waste)) Business NAICS classification: PRECISION TURNED PRODUCT MANUFACTURING.
BOLLS BODY SHOP (8420 EGGERT RD in IDA, MI)
(Resource Conservation and Recovery Act (tracking hazardous waste))
AT&T LONG LINES IDA MI (APPROX 1 MI N OF YARGERVILLE in IDA, MI)
Conditionally Exempt Small Quantity Generators, less than 100 kg/month of hazardous waste (Resource Conservation and Recovery Act (tracking hazardous waste)) Business NAICS classification: CELLULAR AND OTHER WIRELESS TELECOMMUNICATIONS. Organizations: AT & T (CONTACT/OPERATOR)
Housing units lacking complete plumbing facilities: 0.8% Housing units lacking complete kitchen facilities: 1.3%
56.8%Utility gas
26.7%Bottled, tank, or LP gas
6.0%Electricity
5.1%Other fuel
3.8%Fuel oil, kerosene, etc.
0.9%Wood
0.9%No fuel used
Population in 1990: 2,690. Population change in the 1990s: +648 (+24.1%).
Place of birth for U.S.-born residents:
This state: 2,044
Northeast: 59
Midwest: 1,137
South: 101
West: 24
71% of the 48140 zip code residents lived in the same house 5 years ago. Out of people who lived in different houses, 66% lived in this county. Out of people who lived in different counties, 50% lived in Michigan.
90% of the 48140 zip code residents lived in the same house 1 year ago. Out of people who lived in different houses, 79% moved from this county. Out of people who lived in different houses, 8% moved from different county within same state. Out of people who lived in different houses, 4% moved from different state. Out of people who lived in different houses, 6% moved from abroad.
Private vs. public school enrollment:
Students in private schools in grades 1 to 8 (elementary and middle school):
Here:
0.0%
Michigan:
12.4%
Students in private schools in grades 9 to 12 (high school): 5
Here:
2.1%
Michigan:
9.8%
Students in private undergraduate colleges: 34
Here:
19.2%
Michigan:
14.9%
Occupation by median earnings in the past 12 months ($)
113,271Sales and related occupations
104,316Computer and mathematical occupations
92,627Architecture and engineering occupations
91,007Health diagnosing and treating practitioners and other technical occupations
76,545Construction and extraction occupations
74,299Business and financial operations occupations
Top industries in this zip code by the number of employees in 2005:
Other Services (except Public Administration): Commercial and Industrial Machinery and Equipment (except Automotive and Electronic) Repair and Maintenance (50-99 employees: 1 establishment)
Professional, Scientific, and Technical Services: Engineering Services (20-49: 1)
Health Care and Social Assistance: Child Day Care Services (10-19: 1, 5-9: 1, 1-4: 1)
Construction: Plumbing, Heating, and Air-Conditioning Contractors (10-19: 1, 1-4: 2)
Accommodation and Food Services: Full-Service Restaurants (10-19: 1)
Administrative and Support and Waste Management and Remediation Services: All Other Travel Arrangement and Reservation Services (10-19: 1)
Administrative and Support and Waste Management and Remediation Services: All Other Support Services (10-19: 1)
Other Services (except Public Administration): Religious Organizations (5-9: 1, 1-4: 4)
People in group quarters in 2010:
10 people in group homes intended for adults
4 people in workers' group living quarters and job corps centers
People in group quarters in 2000:
22 people in agriculture workers' dormitories on farms
6 people in homes for the mentally retarded
3 people in religious group quarters
Fatal accident statistics in 2014:
Fatal accident count: 1
Vehicles involved in fatal accidents: 1
Fatal accidents caused by drunken drivers: 1
Fatalities: 1
Persons involved in fatal accidents: 1
Pedestrians involved in fatal accidents: 0
Fatal accident statistics in 2011:
Fatal accident count: 1
Vehicles involved in fatal accidents: 2
Fatal accidents caused by drunken drivers: 0
Fatalities: 1
Persons involved in fatal accidents: 2
Pedestrians involved in fatal accidents: 0
Home Mortgage Disclosure Act Aggregated Statistics For Year 2009 (Based on 4 partial tracts)
A) FHA, FSA/RHS & VA Home Purchase Loans
B) Conventional Home Purchase Loans
C) Refinancings
D) Home Improvement Loans
E) Loans on Dwellings For 5+ Families
F) Non-occupant Loans on < 5 Family Dwellings (A B C & D)
G) Loans On Manufactured Home Dwelling (A B C & D)
Number
Average Value
Number
Average Value
Number
Average Value
Number
Average Value
Number
Average Value
Number
Average Value
Number
Average Value
LOANS ORIGINATED
18
$157,078
21
$103,955
111
$145,729
8
$12,101
1
$103,010
4
$82,260
5
$55,506
APPLICATIONS APPROVED, NOT ACCEPTED
3
$115,180
3
$67,520
17
$143,218
1
$51,420
0
$0
0
$0
4
$50,215
APPLICATIONS DENIED
5
$170,144
9
$78,558
44
$169,176
7
$25,480
0
$0
0
$0
6
$69,667
APPLICATIONS WITHDRAWN
4
$95,200
5
$94,990
22
$170,658
0
$0
0
$0
0
$0
3
$40,173
FILES CLOSED FOR INCOMPLETENESS
0
$0
0
$0
6
$167,158
1
$27,690
0
$0
0
$0
0
$0
Aggregated Statistics For Year 2008 (Based on 4 partial tracts)
A) FHA, FSA/RHS & VA Home Purchase Loans
B) Conventional Home Purchase Loans
C) Refinancings
D) Home Improvement Loans
F) Non-occupant Loans on < 5 Family Dwellings (A B C & D)
G) Loans On Manufactured Home Dwelling (A B C & D)
Number
Average Value
Number
Average Value
Number
Average Value
Number
Average Value
Number
Average Value
Number
Average Value
LOANS ORIGINATED
13
$141,174
31
$142,823
75
$173,029
11
$34,424
4
$131,075
4
$98,488
APPLICATIONS APPROVED, NOT ACCEPTED
0
$0
4
$91,438
22
$194,476
3
$71,437
1
$27,470
3
$52,020
APPLICATIONS DENIED
5
$130,842
26
$102,209
71
$168,707
12
$25,585
3
$96,270
9
$43,617
APPLICATIONS WITHDRAWN
2
$142,880
6
$123,377
26
$160,862
1
$252,730
0
$0
2
$76,060
FILES CLOSED FOR INCOMPLETENESS
0
$0
0
$0
3
$136,603
0
$0
0
$0
0
$0
Aggregated Statistics For Year 2007 (Based on 4 partial tracts)
A) FHA, FSA/RHS & VA Home Purchase Loans
B) Conventional Home Purchase Loans
C) Refinancings
D) Home Improvement Loans
E) Loans on Dwellings For 5+ Families
F) Non-occupant Loans on < 5 Family Dwellings (A B C & D)
G) Loans On Manufactured Home Dwelling (A B C & D)
Number
Average Value
Number
Average Value
Number
Average Value
Number
Average Value
Number
Average Value
Number
Average Value
Number
Average Value
LOANS ORIGINATED
4
$147,632
47
$135,717
101
$134,004
22
$44,394
0
$0
6
$104,850
7
$61,459
APPLICATIONS APPROVED, NOT ACCEPTED
1
$107,240
9
$96,952
33
$164,551
3
$18,187
0
$0
0
$0
5
$72,914
APPLICATIONS DENIED
0
$0
23
$96,944
135
$156,441
21
$63,563
1
$143,990
4
$134,850
23
$73,932
APPLICATIONS WITHDRAWN
0
$0
11
$137,168
36
$175,421
0
$0
0
$0
1
$147,390
1
$215,220
FILES CLOSED FOR INCOMPLETENESS
0
$0
0
$0
12
$250,939
0
$0
0
$0
0
$0
1
$199,370
Aggregated Statistics For Year 2006 (Based on 4 partial tracts)
A) FHA, FSA/RHS & VA Home Purchase Loans
B) Conventional Home Purchase Loans
C) Refinancings
D) Home Improvement Loans
F) Non-occupant Loans on < 5 Family Dwellings (A B C & D)
G) Loans On Manufactured Home Dwelling (A B C & D)
Number
Average Value
Number
Average Value
Number
Average Value
Number
Average Value
Number
Average Value
Number
Average Value
LOANS ORIGINATED
3
$156,913
85
$136,232
148
$130,201
28
$61,819
5
$103,186
9
$56,037
APPLICATIONS APPROVED, NOT ACCEPTED
0
$0
12
$133,658
36
$155,999
5
$110,710
1
$115,190
4
$76,322
APPLICATIONS DENIED
0
$0
27
$114,511
102
$146,413
20
$75,797
3
$110,527
13
$75,432
APPLICATIONS WITHDRAWN
2
$152,295
7
$150,773
49
$145,906
3
$105,670
1
$112,980
0
$0
FILES CLOSED FOR INCOMPLETENESS
0
$0
2
$91,375
17
$145,508
0
$0
0
$0
0
$0
Aggregated Statistics For Year 2005 (Based on 4 partial tracts)
A) FHA, FSA/RHS & VA Home Purchase Loans
B) Conventional Home Purchase Loans
C) Refinancings
D) Home Improvement Loans
F) Non-occupant Loans on < 5 Family Dwellings (A B C & D)
G) Loans On Manufactured Home Dwelling (A B C & D)
Number
Average Value
Number
Average Value
Number
Average Value
Number
Average Value
Number
Average Value
Number
Average Value
LOANS ORIGINATED
5
$164,012
130
$161,684
172
$158,702
22
$79,688
5
$134,050
6
$98,555
APPLICATIONS APPROVED, NOT ACCEPTED
0
$0
15
$106,614
37
$159,776
2
$27,310
7
$131,963
6
$50,720
APPLICATIONS DENIED
1
$24,650
26
$113,403
126
$156,950
19
$100,207
1
$232,600
11
$57,170
APPLICATIONS WITHDRAWN
0
$0
14
$147,566
62
$128,783
7
$82,111
4
$118,512
0
$0
FILES CLOSED FOR INCOMPLETENESS
0
$0
3
$84,893
35
$169,793
3
$42,943
0
$0
0
$0
Aggregated Statistics For Year 2004 (Based on 4 partial tracts)
A) FHA, FSA/RHS & VA Home Purchase Loans
B) Conventional Home Purchase Loans
C) Refinancings
D) Home Improvement Loans
E) Loans on Dwellings For 5+ Families
F) Non-occupant Loans on < 5 Family Dwellings (A B C & D)
G) Loans On Manufactured Home Dwelling (A B C & D)
Number
Average Value
Number
Average Value
Number
Average Value
Number
Average Value
Number
Average Value
Number
Average Value
Number
Average Value
LOANS ORIGINATED
6
$122,057
116
$167,143
192
$141,922
26
$34,863
1
$127,370
7
$129,673
8
$63,098
APPLICATIONS APPROVED, NOT ACCEPTED
1
$210,440
14
$139,405
44
$163,260
5
$68,378
0
$0
0
$0
11
$56,256
APPLICATIONS DENIED
1
$98,580
31
$89,499
98
$155,051
22
$46,867
0
$0
4
$104,100
20
$75,056
APPLICATIONS WITHDRAWN
0
$0
10
$181,567
61
$162,985
6
$38,293
0
$0
0
$0
1
$132,910
FILES CLOSED FOR INCOMPLETENESS
0
$0
6
$160,412
35
$166,255
2
$204,350
0
$0
0
$0
0
$0
Aggregated Statistics For Year 2003 (Based on 4 partial tracts)
A) FHA, FSA/RHS & VA Home Purchase Loans
B) Conventional Home Purchase Loans
C) Refinancings
D) Home Improvement Loans
E) Loans on Dwellings For 5+ Families
F) Non-occupant Loans on < 5 Family Dwellings (A B C & D)
Number
Average Value
Number
Average Value
Number
Average Value
Number
Average Value
Number
Average Value
Number
Average Value
LOANS ORIGINATED
6
$161,193
121
$152,539
503
$133,340
19
$28,034
1
$149,530
7
$105,857
APPLICATIONS APPROVED, NOT ACCEPTED
0
$0
15
$101,526
65
$132,230
7
$32,633
0
$0
0
$0
APPLICATIONS DENIED
0
$0
42
$57,548
167
$138,606
29
$40,244
0
$0
4
$89,510
APPLICATIONS WITHDRAWN
1
$203,800
23
$108,530
61
$170,847
4
$37,382
0
$0
4
$70,610
FILES CLOSED FOR INCOMPLETENESS
0
$0
3
$173,893
18
$143,760
1
$60,690
0
$0
0
$0
Aggregated Statistics For Year 2002 (Based on 4 partial tracts)
A) FHA, FSA/RHS & VA Home Purchase Loans
B) Conventional Home Purchase Loans
C) Refinancings
D) Home Improvement Loans
F) Non-occupant Loans on < 5 Family Dwellings (A B C & D)
Number
Average Value
Number
Average Value
Number
Average Value
Number
Average Value
Number
Average Value
LOANS ORIGINATED
4
$127,115
81
$155,685
381
$129,968
31
$23,495
6
$85,138
APPLICATIONS APPROVED, NOT ACCEPTED
1
$191,610
24
$73,190
61
$120,195
5
$29,176
1
$64,800
APPLICATIONS DENIED
1
$54,590
43
$52,499
117
$130,897
11
$25,090
1
$64,800
APPLICATIONS WITHDRAWN
0
$0
4
$128,205
48
$127,858
1
$11,080
1
$22,150
FILES CLOSED FOR INCOMPLETENESS
0
$0
3
$66,640
34
$155,113
0
$0
0
$0
Aggregated Statistics For Year 2001 (Based on 4 partial tracts)
A) FHA, FSA/RHS & VA Home Purchase Loans
B) Conventional Home Purchase Loans
C) Refinancings
D) Home Improvement Loans
E) Loans on Dwellings For 5+ Families
F) Non-occupant Loans on < 5 Family Dwellings (A B C & D)
Number
Average Value
Number
Average Value
Number
Average Value
Number
Average Value
Number
Average Value
Number
Average Value
LOANS ORIGINATED
9
$134,546
86
$140,326
326
$120,107
44
$23,394
1
$93,040
7
$68,833
APPLICATIONS APPROVED, NOT ACCEPTED
0
$0
36
$86,227
43
$115,258
7
$20,240
0
$0
1
$107,420
APPLICATIONS DENIED
1
$152,850
109
$60,521
92
$130,351
17
$16,612
0
$0
7
$58,976
APPLICATIONS WITHDRAWN
2
$145,650
9
$143,960
37
$147,920
3
$11,427
1
$125,160
0
$0
FILES CLOSED FOR INCOMPLETENESS
0
$0
0
$0
8
$157,489
0
$0
0
$0
0
$0
Aggregated Statistics For Year 2000 (Based on 4 partial tracts)
A) FHA, FSA/RHS & VA Home Purchase Loans
B) Conventional Home Purchase Loans
C) Refinancings
D) Home Improvement Loans
E) Loans on Dwellings For 5+ Families
F) Non-occupant Loans on < 5 Family Dwellings (A B C & D)
Number
Average Value
Number
Average Value
Number
Average Value
Number
Average Value
Number
Average Value
Number
Average Value
LOANS ORIGINATED
2
$142,325
84
$127,865
86
$109,971
36
$21,561
1
$146,200
2
$63,135
APPLICATIONS APPROVED, NOT ACCEPTED
0
$0
38
$70,571
21
$91,548
13
$18,712
0
$0
3
$47,490
APPLICATIONS DENIED
0
$0
102
$60,649
33
$92,665
15
$20,066
0
$0
1
$40,500
APPLICATIONS WITHDRAWN
0
$0
3
$48,780
40
$105,524
2
$146,755
0
$0
0
$0
FILES CLOSED FOR INCOMPLETENESS
0
$0
0
$0
7
$112,376
0
$0
0
$0
0
$0
Aggregated Statistics For Year 1999 (Based on 2 partial tracts)
A) FHA, FSA/RHS & VA Home Purchase Loans
B) Conventional Home Purchase Loans
C) Refinancings
D) Home Improvement Loans
F) Non-occupant Loans on < 5 Family Dwellings (A B C & D)
Detailed PMIC statistics for the following Tracts:8310.00
, 8328.00
2002 - 2018 National Fire Incident Reporting System (NFIRS) incidents
Based on the data from the years 2002 - 2018 the average number of fires per year is 13. The highest number of reported fire incidents - 27 took place in 2010, and the least - 1 in 2006. The data has a declining trend.
When looking into fire subcategories, the most incidents belonged to: Structure Fires (52.8%), and Outside Fires (35.3%).
Fire incident types reported to NFIRS in Zip Code 48140


 Nearest zip codes: 48177, 48182, 49270, 48161, 48131, 48145.


 (Students: 569, Location: 3145 PRAIRIE ST, Grades: 9-12)
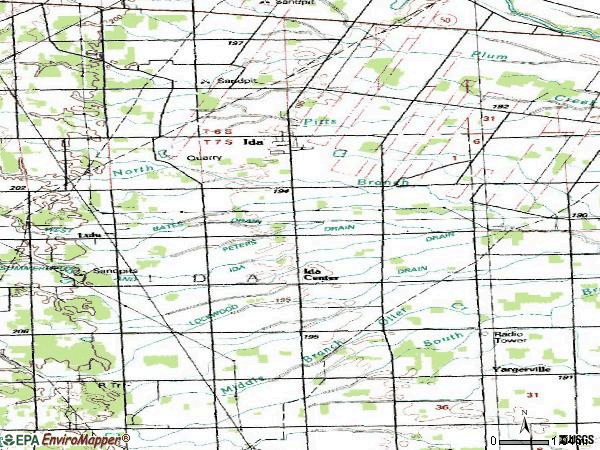


 Based on the data from the years 2002 - 2018 the average number of fires per year is 13. The highest number of reported fire incidents - 27 took place in 2010, and the least - 1 in 2006. The data has a declining trend.
 When looking into fire subcategories, the most incidents belonged to: Structure Fires (52.8%), and Outside Fires (35.3%).