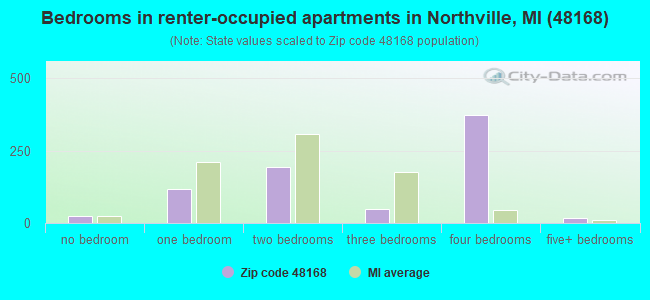
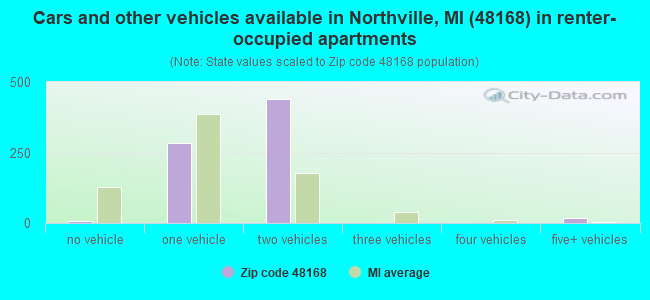
Houses and condos: 9,472 Renter-occupied apartments: 749
% of renters here:
8%
State:
27%
March 2022 cost of living index in zip code 48168: 96.6 (near average, U.S. average is 100)
Land area: 20.4 sq. mi. Water area: 0.2 sq. mi.
Population density: 1,244 people per square mile
(low).
OSM Map
Google Map
MSN Map
OSM Map
General Map
Google Map
MSN Map
OSM Map
Google Map
MSN Map
OSM Map
Google Map
MSN Map
Please wait while loading the map...
Real estate property taxes paid for housing units in 2022:
This zip code:
1.3% ($7,459)
Michigan:
1.2% ($2,746)
Median real estate property taxes paid for housing units with mortgages in 2022: $8,415 (1.3%) Median real estate property taxes paid for housing units with no mortgage in 2022: $6,495 (1.3%)
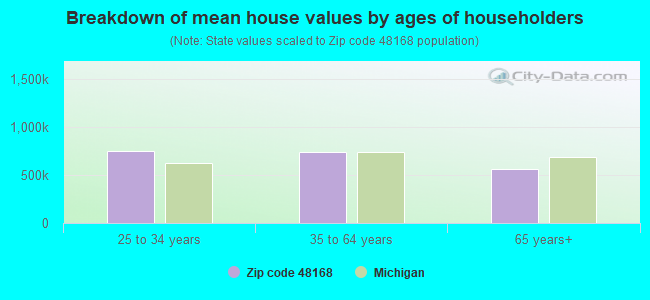
Estimated median house/condo value in 2022: $561,391
48168:
$561,391
Michigan:
$224,400
According to our research of Michigan and other state lists, there were 2 registered sex offenders living in 48168 zip code as of May 15, 2024. The ratio of all residents to sex offenders in zip code 48168 is 11,055 to 1. The ratio of registered sex offenders to all residents in this zip code is much lower than the state average.
Median resident age:
This zip code:
45.0 years
Michigan median age:
40.3 years
Average household size:
This zip code:
2.7 people
Michigan:
2.4 people
Averages for the 2020 tax year for zip code 48168, filed in 2021:
Average Adjusted Gross Income (AGI) in 2020: $198,374 (Individual Income Tax Returns)
Here:
$198,374
State:
$68,945
Salary/wage: $153,497 (reported on 76.8% of returns)
Here:
$153,497
State:
$57,142
(% of AGI for various income ranges: 985.5% for AGIs below $25k, 3156.1% for AGIs $25k-50k, 5960.3% for AGIs $50k-75k, 7993.2% for AGIs $75k-100k, 17481.8% for AGIs $100k-200k, 107250.8% for AGIs over 200k)
Taxable interest for individuals: $3,071 (reported on 59.0% of returns)
This zip code:
$3,071
Michigan:
$1,630
(% of AGI for various income ranges: 39.0% for AGIs below $25k, 106.1% for AGIs $25k-50k, 113.8% for AGIs $50k-75k, 181.4% for AGIs $75k-100k, 283.4% for AGIs $100k-200k, 1488.6% for AGIs over 200k)
Ordinary dividends: $12,107 (reported on 49.7% of returns)
Here:
$12,107
State:
$6,972
(% of AGI for various income ranges: 68.6% for AGIs below $25k, 205.5% for AGIs $25k-50k, 333.4% for AGIs $50k-75k, 538.6% for AGIs $75k-100k, 751.6% for AGIs $100k-200k, 5545.8% for AGIs over 200k)
Net capital gain/loss in AGI: +$36,085 (reported on 47.7% of returns)
Here:
+$36,085
State:
+$20,064
(% of AGI for various income ranges: 73.5% for AGIs below $25k, 169.8% for AGIs $25k-50k, 266.1% for AGIs $50k-75k, 507.5% for AGIs $75k-100k, 857.4% for AGIs $100k-200k, 19570.6% for AGIs over 200k)
Profit/loss from business: +$24,990 (reported on 15.4% of returns)
Here:
+$24,990
State:
+$11,172
(% of AGI for various income ranges: 76.3% for AGIs below $25k, 144.6% for AGIs $25k-50k, 234.4% for AGIs $50k-75k, 341.4% for AGIs $75k-100k, 616.4% for AGIs $100k-200k, 3244.0% for AGIs over 200k)
Taxable individual retirement arrangement distribution: $35,925 (reported on 16.4% of returns)
48168:
$35,925
Michigan:
$19,803
(% of AGI for various income ranges: 60.6% for AGIs below $25k, 274.4% for AGIs $25k-50k, 637.3% for AGIs $50k-75k, 1167.9% for AGIs $75k-100k, 1961.6% for AGIs $100k-200k, 2815.3% for AGIs over 200k)
Self-employed (Keogh) retirement plans: $32,050 (reported on 2.0% of returns)
48168:
$32,050
Michigan:
$25,132
(% of AGI for various income ranges: 21.8% for AGIs below $25k, 55.4% for AGIs $100k-200k, 686.0% for AGIs over 200k)
Total itemized deductions: $36,364 (reported on 20.2% of returns)
Here:
$36,364
State:
$34,117
(% of AGI for various income ranges: 122.5% for AGIs below $25k, 289.3% for AGIs $25k-50k, 540.5% for AGIs $50k-75k, 843.0% for AGIs $75k-100k, 1321.8% for AGIs $100k-200k, 5834.3% for AGIs over 200k)
Charity contributions: $11,905 (reported on 18.1% of returns)
Here:
$11,905
State:
$13,548
(% of AGI for various income ranges: 6.8% for AGIs below $25k, 31.0% for AGIs $25k-50k, 69.4% for AGIs $50k-75k, 138.2% for AGIs $75k-100k, 271.2% for AGIs $100k-200k, 2106.4% for AGIs over 200k)
Taxes paid: $9,349 (reported on 20.2% of returns)
48168:
$9,349
State:
$7,972
(% of AGI for various income ranges: 19.9% for AGIs below $25k, 70.1% for AGIs $25k-50k, 134.7% for AGIs $50k-75k, 252.1% for AGIs $75k-100k, 424.0% for AGIs $100k-200k, 1369.8% for AGIs over 200k)
Earned income credit: $1,319 (reported on 2.7% of returns)
Here:
$1,319
State:
$2,251
(% of AGI for various income ranges: 17.9% for AGIs below $25k, 17.6% for AGIs $25k-50k)
Percentage of individuals using paid preparers for their 2020 taxes: 92.1%
Here:
92%
State:
93%
(% for various income ranges: 89.8% for AGIs below $25k, 92.7% for AGIs $25k-50k, 93.1% for AGIs $50k-75k, 91.8% for AGIs $75k-100k, 91.6% for AGIs $100k-200k, 94.3% for AGIs over 200k)
Averages for the 2012 tax year for zip code 48168, filed in 2013:
Average Adjusted Gross Income (AGI) in 2012: $158,620 (Individual Income Tax Returns)
Here:
$158,620
State:
$55,609
Salary/wage: $132,792 (reported on 80.1% of returns)
Here:
$132,792
State:
$46,782
(% of AGI for various income ranges: 67.3% for AGIs below $25k, 60.4% for AGIs $25k-50k, 57.7% for AGIs $50k-75k, 59.1% for AGIs $75k-100k, 73.0% for AGIs $100k-200k, 66.1% for AGIs over 200k)
Taxable interest for individuals: $2,650 (reported on 64.2% of returns)
This zip code:
$2,650
Michigan:
$1,491
(% of AGI for various income ranges: 2.6% for AGIs below $25k, 1.6% for AGIs $25k-50k, 1.2% for AGIs $50k-75k, 1.4% for AGIs $75k-100k, 0.9% for AGIs $100k-200k, 1.1% for AGIs over 200k)
Ordinary dividends: $9,091 (reported on 49.5% of returns)
Here:
$9,091
State:
$6,225
(% of AGI for various income ranges: 5.6% for AGIs below $25k, 3.0% for AGIs $25k-50k, 3.1% for AGIs $50k-75k, 2.9% for AGIs $75k-100k, 1.8% for AGIs $100k-200k, 3.2% for AGIs over 200k)
Net capital gain/loss in AGI: +$9,791 (reported on 44.5% of returns)
Here:
+$9,791
State:
+$9,326
(% of AGI for various income ranges: 0.9% for AGIs $75k-100k, 0.7% for AGIs $100k-200k, 4.1% for AGIs over 200k)
Profit/loss from business: +$28,372 (reported on 15.2% of returns)
Here:
+$28,372
State:
+$11,523
(% of AGI for various income ranges: 5.2% for AGIs below $25k, 4.3% for AGIs $25k-50k, 3.4% for AGIs $50k-75k, 2.9% for AGIs $75k-100k, 2.7% for AGIs $100k-200k, 2.5% for AGIs over 200k)
Taxable individual retirement arrangement distribution: $25,946 (reported on 18.9% of returns)
48168:
$25,946
Michigan:
$15,298
(% of AGI for various income ranges: 6.7% for AGIs below $25k, 5.5% for AGIs $25k-50k, 6.6% for AGIs $50k-75k, 7.5% for AGIs $75k-100k, 5.0% for AGIs $100k-200k, 1.6% for AGIs over 200k)
Self-employment retirement plans: $26,128 (reported on 2.4% of returns)
48168:
$26,128
Michigan:
$20,834
(% of AGI for various income ranges: 0.5% for AGIs $50k-75k, 0.3% for AGIs $100k-200k, 0.5% for AGIs over 200k)
Total itemized deductions: $34,080 (14% of AGI, reported on 60.2% of returns)
Here:
$34,080
State:
$21,628
Here:
14.3% of AGI
State:
18.4% of AGI
(% of AGI for various income ranges: 18.1% for AGIs below $25k, 16.3% for AGIs $25k-50k, 20.1% for AGIs $50k-75k, 16.6% for AGIs $75k-100k, 16.3% for AGIs $100k-200k, 10.6% for AGIs over 200k)
Charity contributions: $4,838 (reported on 54.9% of returns)
Here:
$4,838
State:
$4,225
(% of AGI for various income ranges: 1.0% for AGIs below $25k, 1.8% for AGIs $25k-50k, 1.8% for AGIs $50k-75k, 2.2% for AGIs $75k-100k, 2.0% for AGIs $100k-200k, 1.5% for AGIs over 200k)
Taxes paid: $16,567 (reported on 60.2% of returns)
48168:
$16,567
State:
$8,327
(% of AGI for various income ranges: 4.0% for AGIs below $25k, 4.9% for AGIs $25k-50k, 6.0% for AGIs $50k-75k, 6.2% for AGIs $75k-100k, 7.3% for AGIs $100k-200k, 6.0% for AGIs over 200k)
Earned income credit: $1,567 (reported on 3.1% of returns)
Here:
$1,567
State:
$2,306
(% of AGI for various income ranges: 1.5% for AGIs below $25k, 0.4% for AGIs $25k-50k)
Percentage of individuals using paid preparers for their 2012 taxes: 57.5%
Here:
58%
State:
57%
(% for various income ranges: 48.5% for AGIs below $25k, 57.5% for AGIs $25k-50k, 60.8% for AGIs $50k-75k, 60.8% for AGIs $75k-100k, 55.5% for AGIs $100k-200k, 68.4% for AGIs over 200k)
Averages for the 2004 tax year for zip code 48168, filed in 2005:
Average Adjusted Gross Income (AGI) in 2004: $133,924 (Individual Income Tax Returns)
Here:
$133,924
State:
$48,204
Salary/wage: $97,389 (reported on 85.2% of returns)
Here:
$97,389
State:
$42,791
(% of AGI for various income ranges: 80.0% for AGIs $10k-25k, 79.0% for AGIs $25k-50k, 78.1% for AGIs $50k-75k, 73.9% for AGIs $75k-100k, 57.9% for AGIs over 100k)
Taxable interest for individuals: $3,156 (reported on 62.4% of returns)
This zip code:
$3,156
Michigan:
$1,725
(% of AGI for various income ranges: 1.7% for AGIs $10k-25k, 0.9% for AGIs $25k-50k, 2.5% for AGIs $50k-75k, 2.3% for AGIs $75k-100k, 1.3% for AGIs over 100k)
Taxable dividends: $10,324 (reported on 41.5% of returns)
Here:
$10,324
State:
$3,420
(% of AGI for various income ranges: 2.1% for AGIs $10k-25k, 2.1% for AGIs $25k-50k, 4.1% for AGIs $50k-75k, 2.1% for AGIs $75k-100k, 3.3% for AGIs over 100k)
Net capital gain/loss: +$10,899 (reported on 41.4% of returns)
Here:
+$10,899
State:
+$8,532
(% of AGI for various income ranges: -1.3% for AGIs $10k-25k, 0.0% for AGIs $25k-50k, -0.7% for AGIs $50k-75k, -0.1% for AGIs $75k-100k, 4.1% for AGIs over 100k)
Profit/loss from business: +$38,336 (reported on 17.5% of returns)
Here:
+$38,336
State:
+$9,547
(% of AGI for various income ranges: 3.0% for AGIs $25k-50k, 3.0% for AGIs $75k-100k, 5.6% for AGIs over 100k)
IRA payment deduction: $3,526 (reported on 2.3% of returns)
48168:
$3,526
Michigan:
$2,875
Self-employed pension: $22,091 (reported on 4.0% of returns)
Here:
$22,091
Michigan:
$13,826
Total itemized deductions: $33,752 (15% of AGI, reported on 56.7% of returns)
Here:
$33,752
State:
$18,509
Here:
15.3% of AGI
State:
20.7% of AGI
(% of AGI for various income ranges: 13.7% for AGIs $10k-25k, 15.7% for AGIs $25k-50k, 19.6% for AGIs $50k-75k, 23.0% for AGIs $75k-100k, 13.0% for AGIs over 100k)
Charity contributions deductions: $5,087 (2% of AGI, reported on 52.2% of returns)
Here:
$5,087
State:
$3,365
Here:
2.3% of AGI
State:
3.6% of AGI
(% of AGI for various income ranges: 1.8% for AGIs $10k-25k, 2.7% for AGIs $25k-50k, 2.1% for AGIs $50k-75k, 2.7% for AGIs $75k-100k, 1.9% for AGIs over 100k)
Total tax: $31,370 (reported on 82.8% of returns)
48168:
$31,370
State:
$7,691
(% of AGI for various income ranges: 4.6% for AGIs $10k-25k, 7.9% for AGIs $25k-50k, 10.1% for AGIs $50k-75k, 9.4% for AGIs $75k-100k, 21.2% for AGIs over 100k)
Earned income credit: $1,758 (reported on 4.0% of returns)
Here:
$1,758
State:
$1,737
Percentage of individuals using paid preparers for their 2004 taxes: 57.7%
Here:
58%
State:
60%
(% for various income ranges: 37.4% for AGIs below $10k, 43.2% for AGIs $10k-25k, 62.8% for AGIs $25k-50k, 65.8% for AGIs $50k-75k, 62.9% for AGIs $75k-100k, 70.2% for AGIs over 100k)
Likely homosexual households (counted as self-reported same-sex unmarried-partner households)
Lesbian couples: 0.1% of all households
Gay men: 0.0% of all households
Household received Food Stamps/SNAP in the past 12 months: 54 Household did not receive Food Stamps/SNAP in the past 12 months: 9,132
Women who had a birth in the past 12 months: 167 (171 now married, 0 unmarried) Women who did not have a birth in the past 12 months: 5,221 (2,844 now married, 2,358 unmarried)
Housing units in zip code 48168 with a mortgage: 5,027 (752 second mortgage, 9 home equity loan, 661 both second mortgage and home equity loan) Houses without a mortgage: 119
Median monthly owner costs for units with a mortgage: $3,004 Median monthly owner costs for units without a mortgage: $1,051
Residents with income below the poverty level in 2022:
This zip code:
2.9%
Whole state:
13.4%
Residents with income below 50% of the poverty level in 2022:
This zip code:
0.7%
Whole state:
6.9%
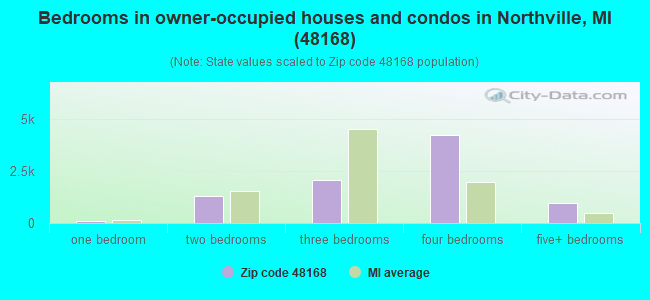
Median number of rooms in houses and condos:
Here:
8.2
State:
6.5
Median number of rooms in apartments:
Here:
6.6
State:
4.3
Notable locations in this zip code not listed on our city pages
Notable locations in zip code 48168: Brooklane Golf Course (A), Salem Hills Golf Club (B), Northville Hills Golf Club (C), Bushwood Golf Course (D), Scott Regional Prison (E), Hawthorne Center (F), Wayne County Child Development Center (G), Northville Fire Station Number 1 (H), Northville Water and Sewer Building (I), Michigan State Police Post Number 2 (J), Northville Township Fire Department Station 2 (K), Salem Township Fire Department (L), Northville Township Fire Department Station 1 Headquarters (M). Display/hide their locations on the map
Shopping Centers: Northville Village Center Shopping Center (1), Northville Square Shopping Center (2), Northville Plaza Mall Shopping Center (3). Display/hide their locations on the map
Churches in zip code 48168 include: West Salem Church (A), Northville Christian Assembly Church (B), Salem Bible Church (C). Display/hide their locations on the map
Cemeteries: Rural Hill Cemetery (1), Waterford Cemetery (2), Thayer Cemetery (3), Salem-Walker Cemetery (4), Worden Cemetery (5). Display/hide their locations on the map
In group quarters: 23 (-1 institutionalized population)
Size of family households: 2,965 2-persons, 1,471 3-persons, 1,742 4-persons, 624 5-persons, 287 6-persons, 32 7-or-more-persons
Size of nonfamily households: 1,733 1-person, 321 2-persons, 27 3-persons
5,500 married couples with children.
370 single-parent households (86 men, 284 women).
76.8% of residents of 48168 zip code speak English at home.
1.7% of residents speak Spanish at home (97% very well, 3% not well).
8.6% of residents speak other Indo-European language at home (85% very well, 12% well, 2% not well, 1% not at all).
9.8% of residents speak Asian or Pacific Island language at home (70% very well, 23% well, 5% not well, 2% not at all).
3.1% of residents speak other language at home (96% very well, 2% well, 3% not well).
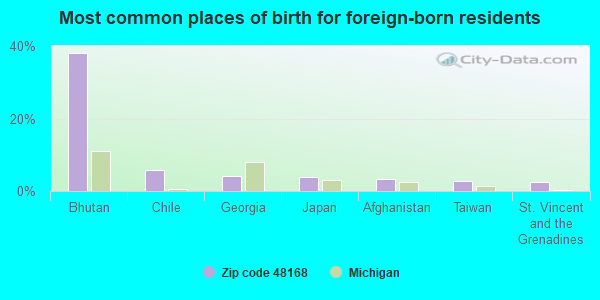
Foreign born population: 4,762 (18.8%) (73.9% of them are naturalized citizens)
This zip code:
18.8%
Whole state:
6.9%
38%Bhutan
6%Chile
4%Georgia
4%Japan
3%Afghanistan
3%Taiwan
2%St. Vincent and the Grenadines
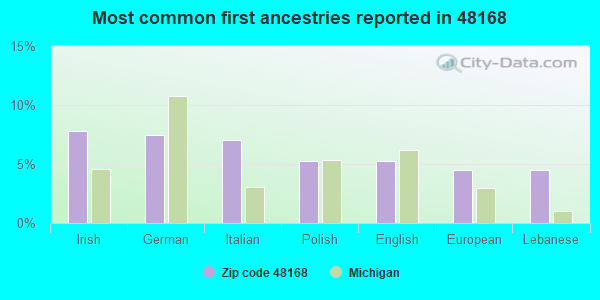
8%Irish
7%German
7%Italian
5%Polish
5%English
5%European
4%Lebanese
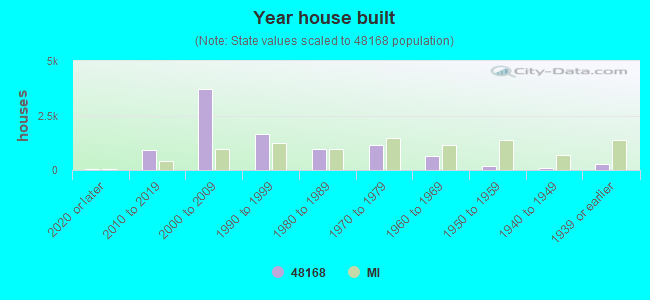
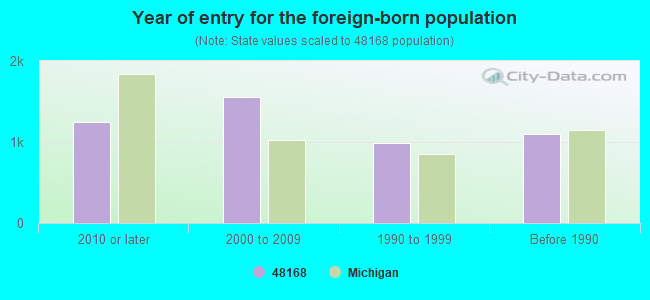
Year of entry for the foreign-born population
1,2422010 or later
1,5552000 to 2009
9831990 to 1999
1,096Before 1990
Housing units lacking complete plumbing facilities: 0.7% Housing units lacking complete kitchen facilities: 0.4%
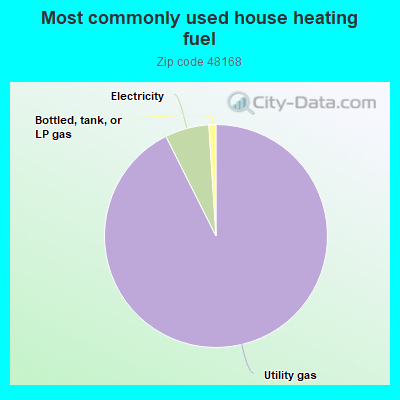
92.4%Utility gas
6.4%Electricity
1.0%Bottled, tank, or LP gas
Place of birth for U.S.-born residents:
This state: 15,226
Northeast: 1,099
Midwest: 2,165
South: 1,322
West: 635
92% of the 48168 zip code residents lived in the same house 1 year ago. Out of people who lived in different houses, 23% moved from this county. Out of people who lived in different houses, 41% moved from different county within same state. Out of people who lived in different houses, 21% moved from different state. Out of people who lived in different houses, 20% moved from abroad.
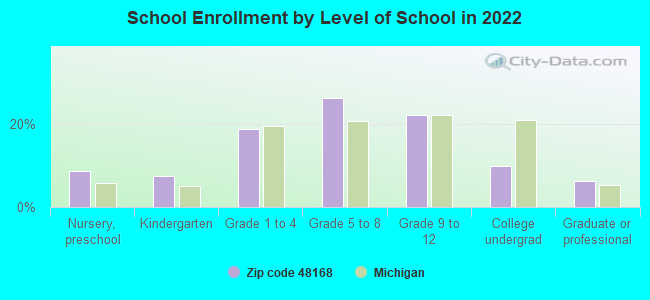
Private vs. public school enrollment:
Students in private schools in grades 1 to 8 (elementary and middle school): 318
Here:
10.2%
Michigan:
12.4%
Students in private schools in grades 9 to 12 (high school): 251
Here:
16.3%
Michigan:
9.8%
Students in private undergraduate colleges: 65
Here:
9.6%
Michigan:
14.9%
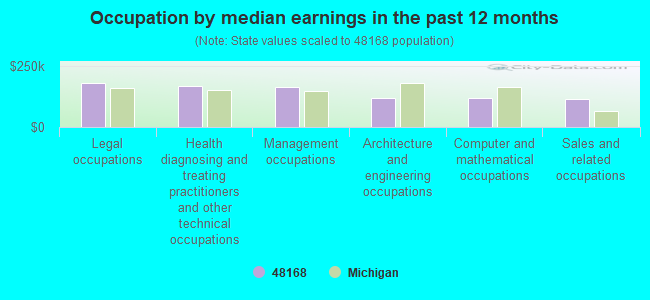
Occupation by median earnings in the past 12 months ($)
181,410Legal occupations
170,500Health diagnosing and treating practitioners and other technical occupations
163,943Management occupations
119,596Architecture and engineering occupations
119,073Computer and mathematical occupations
116,311Sales and related occupations
Top industries in this zip code by the number of employees in 2005:
Other Services (except Public Administration): Religious Organizations (100-249 employees: 1 establishment, 50-99 employees: 1 establishment, 10-19 employees: 1 establishment)
Accommodation and Food Services: Full-Service Restaurants (20-49: 2)
Accommodation and Food Services: Snack and Nonalcoholic Beverage Bars (20-49: 1)
Other Services (except Public Administration): Beauty Salons (10-19: 1, 1-4: 2)
Professional, Scientific, and Technical Services: Other Accounting Services (10-19: 1)
Management of Companies and Enterprises: Corporate, Subsidiary, and Regional Managing Offices (10-19: 1)
Fatal accident statistics in 2013:
Fatal accident count: 1
Vehicles involved in fatal accidents: 2
Fatal accidents caused by drunken drivers: 0
Fatalities: 1
Persons involved in fatal accidents: 4
Pedestrians involved in fatal accidents: 0
Fatal accident statistics in 2012:
Fatal accident count: 1
Vehicles involved in fatal accidents: 2
Fatal accidents caused by drunken drivers: 0
Fatalities: 1
Persons involved in fatal accidents: 2
Pedestrians involved in fatal accidents: 0
2005 - 2018 National Fire Incident Reporting System (NFIRS) incidents
According to the data from the years 2005 - 2018 the average number of fire incidents per year is 17. The highest number of fire incidents - 39 took place in 2016, and the least - 0 in 2007. The data has an increasing trend.
When looking into fire subcategories, the most incidents belonged to: Structure Fires (47.9%), and Outside Fires (34.5%).
Fire incident types reported to NFIRS in Zip Code 48168


 According to the data from the years 2005 - 2018 the average number of fire incidents per year is 17. The highest number of fire incidents - 39 took place in 2016, and the least - 0 in 2007. The data has an increasing trend.
 When looking into fire subcategories, the most incidents belonged to: Structure Fires (47.9%), and Outside Fires (34.5%).