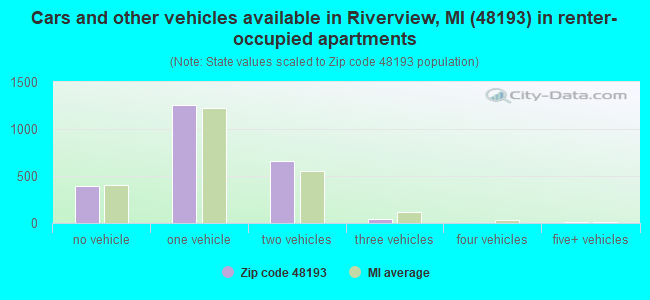
Houses and condos: 6,965 Renter-occupied apartments: 2,358
% of renters here:
35%
State:
27%
March 2022 cost of living index in zip code 48193: 91.2 (less than average, U.S. average is 100)
Land area: 7.0 sq. mi. Water area: 0.3 sq. mi.
Population density: 2,384 people per square mile
(low).
OSM Map
Google Map
MSN Map
OSM Map
General Map
Google Map
MSN Map
OSM Map
Google Map
MSN Map
OSM Map
Google Map
MSN Map
Please wait while loading the map...
Real estate property taxes paid for housing units in 2022:
This zip code:
1.7% ($3,591)
Michigan:
1.2% ($2,746)
Median real estate property taxes paid for housing units with mortgages in 2022: $3,697 (1.7%) Median real estate property taxes paid for housing units with no mortgage in 2022: $3,454 (1.6%)
Business Search- 14 Million verified businesses
Males: 8,098
(48.4%)
Females: 8,648
(51.6%)
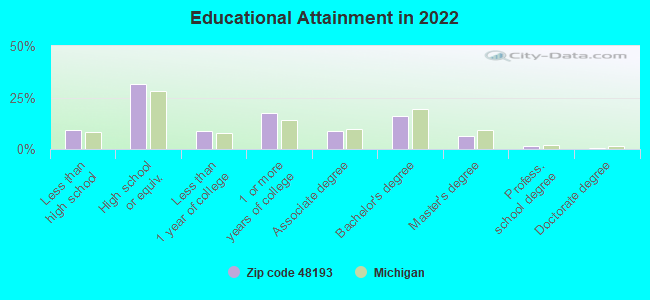
For population 25 years and over in 48193:
High school or higher: 90.4%
Bachelor's degree or higher: 24.5%
Graduate or professional degree: 8.7%
Unemployed: 2.6%
Mean travel time to work (commute): 24.5 minutes
For population 15 years and over in 48193:
Never married: 32.5%
Now married: 43.1%
Separated: 0.4%
Widowed: 8.8%
Divorced: 15.2%
Zip code 48193 compared to state average:
Unemployed percentage below state average.
Length of stay since moving in significantly above state average.
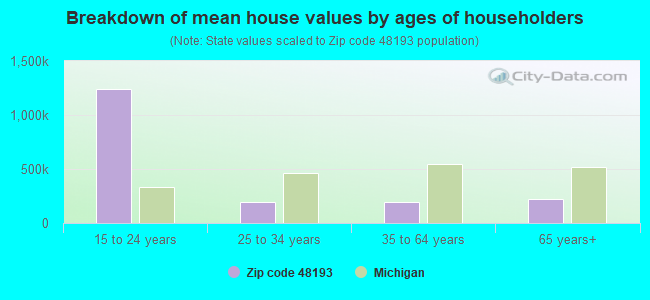
Estimated median house/condo value in 2022: $213,576
48193:
$213,576
Michigan:
$224,400
According to our research of Michigan and other state lists, there were 24 registered sex offenders living in 48193 zip code as of May 14, 2024. The ratio of all residents to sex offenders in zip code 48193 is 646 to 1. The ratio of registered sex offenders to all residents in this zip code is lower than the state average.
Median resident age:
This zip code:
41.2 years
Michigan median age:
40.3 years
Average household size:
This zip code:
2.4 people
Michigan:
2.4 people
Averages for the 2020 tax year for zip code 48193, filed in 2021:
Average Adjusted Gross Income (AGI) in 2020: $57,977 (Individual Income Tax Returns)
Here:
$57,977
State:
$68,945
Salary/wage: $51,037 (reported on 76.5% of returns)
Here:
$51,037
State:
$57,142
(% of AGI for various income ranges: 981.7% for AGIs below $25k, 3060.9% for AGIs $25k-50k, 6016.1% for AGIs $50k-75k, 8693.4% for AGIs $75k-100k, 14872.7% for AGIs $100k-200k, 51585.7% for AGIs over 200k)
Taxable interest for individuals: $1,200 (reported on 30.4% of returns)
This zip code:
$1,200
Michigan:
$1,630
(% of AGI for various income ranges: 19.3% for AGIs below $25k, 20.9% for AGIs $25k-50k, 43.4% for AGIs $50k-75k, 78.8% for AGIs $75k-100k, 107.4% for AGIs $100k-200k, 910.0% for AGIs over 200k)
Ordinary dividends: $4,137 (reported on 17.2% of returns)
Here:
$4,137
State:
$6,972
(% of AGI for various income ranges: 22.4% for AGIs below $25k, 30.4% for AGIs $25k-50k, 92.4% for AGIs $50k-75k, 142.1% for AGIs $75k-100k, 267.5% for AGIs $100k-200k, 1814.3% for AGIs over 200k)
Net capital gain/loss in AGI: +$8,375 (reported on 15.0% of returns)
Here:
+$8,375
State:
+$20,064
(% of AGI for various income ranges: 7.1% for AGIs below $25k, 14.7% for AGIs $25k-50k, 80.1% for AGIs $50k-75k, 83.4% for AGIs $75k-100k, 359.3% for AGIs $100k-200k, 8511.4% for AGIs over 200k)
Profit/loss from business: +$8,244 (reported on 12.0% of returns)
Here:
+$8,244
State:
+$11,172
(% of AGI for various income ranges: 53.0% for AGIs below $25k, 41.0% for AGIs $25k-50k, 151.8% for AGIs $50k-75k, 152.4% for AGIs $75k-100k, 273.4% for AGIs $100k-200k, 3104.3% for AGIs over 200k)
Taxable individual retirement arrangement distribution: $17,758 (reported on 11.4% of returns)
48193:
$17,758
Michigan:
$19,803
(% of AGI for various income ranges: 66.2% for AGIs below $25k, 129.3% for AGIs $25k-50k, 270.3% for AGIs $50k-75k, 408.1% for AGIs $75k-100k, 944.9% for AGIs $100k-200k, 2038.6% for AGIs over 200k)
Total itemized deductions: $25,018 (reported on 4.7% of returns)
Here:
$25,018
State:
$34,117
(% of AGI for various income ranges: 32.1% for AGIs below $25k, 66.7% for AGIs $25k-50k, 207.2% for AGIs $50k-75k, 306.0% for AGIs $75k-100k, 418.6% for AGIs $100k-200k, 1721.4% for AGIs over 200k)
Charity contributions: $7,397 (reported on 3.7% of returns)
Here:
$7,397
State:
$13,548
(% of AGI for various income ranges: 16.0% for AGIs $25k-50k, 45.5% for AGIs $50k-75k, 53.3% for AGIs $75k-100k, 105.1% for AGIs $100k-200k, 692.9% for AGIs over 200k)
Taxes paid: $6,982 (reported on 4.7% of returns)
48193:
$6,982
State:
$7,972
(% of AGI for various income ranges: 4.7% for AGIs below $25k, 16.0% for AGIs $25k-50k, 49.8% for AGIs $50k-75k, 92.1% for AGIs $75k-100k, 137.1% for AGIs $100k-200k, 484.3% for AGIs over 200k)
Earned income credit: $2,083 (reported on 13.0% of returns)
Here:
$2,083
State:
$2,251
(% of AGI for various income ranges: 63.4% for AGIs below $25k, 65.4% for AGIs $25k-50k)
Percentage of individuals using paid preparers for their 2020 taxes: 93.7%
Here:
94%
State:
93%
(% for various income ranges: 93.2% for AGIs below $25k, 94.6% for AGIs $25k-50k, 93.6% for AGIs $50k-75k, 92.8% for AGIs $75k-100k, 93.9% for AGIs $100k-200k, 94.4% for AGIs over 200k)
Averages for the 2012 tax year for zip code 48193, filed in 2013:
Average Adjusted Gross Income (AGI) in 2012: $50,199 (Individual Income Tax Returns)
Here:
$50,199
State:
$55,609
Salary/wage: $45,036 (reported on 79.3% of returns)
Here:
$45,036
State:
$46,782
(% of AGI for various income ranges: 67.4% for AGIs below $25k, 71.4% for AGIs $25k-50k, 71.6% for AGIs $50k-75k, 69.8% for AGIs $75k-100k, 76.9% for AGIs $100k-200k, 59.4% for AGIs over 200k)
Taxable interest for individuals: $1,054 (reported on 36.3% of returns)
This zip code:
$1,054
Michigan:
$1,491
(% of AGI for various income ranges: 1.4% for AGIs below $25k, 0.8% for AGIs $25k-50k, 0.6% for AGIs $50k-75k, 0.9% for AGIs $75k-100k, 0.6% for AGIs $100k-200k, 0.7% for AGIs over 200k)
Ordinary dividends: $3,287 (reported on 20.7% of returns)
Here:
$3,287
State:
$6,225
(% of AGI for various income ranges: 1.3% for AGIs below $25k, 1.1% for AGIs $25k-50k, 1.3% for AGIs $50k-75k, 1.0% for AGIs $75k-100k, 1.3% for AGIs $100k-200k, 2.6% for AGIs over 200k)
Net capital gain/loss in AGI: +$1,454 (reported on 15.0% of returns)
Here:
+$1,454
State:
+$9,326
(% of AGI for various income ranges: 0.4% for AGIs $75k-100k, 0.7% for AGIs $100k-200k, 1.9% for AGIs over 200k)
Profit/loss from business: +$11,073 (reported on 10.9% of returns)
Here:
+$11,073
State:
+$11,523
(% of AGI for various income ranges: 5.4% for AGIs below $25k, 2.3% for AGIs $25k-50k, 1.6% for AGIs $50k-75k, 1.5% for AGIs $75k-100k, 0.6% for AGIs $100k-200k, 7.7% for AGIs over 200k)
Taxable individual retirement arrangement distribution: $13,546 (reported on 13.2% of returns)
48193:
$13,546
Michigan:
$15,298
(% of AGI for various income ranges: 3.8% for AGIs below $25k, 2.7% for AGIs $25k-50k, 3.0% for AGIs $50k-75k, 4.0% for AGIs $75k-100k, 3.8% for AGIs $100k-200k, 4.0% for AGIs over 200k)
Total itemized deductions: $18,510 (19% of AGI, reported on 28.9% of returns)
Here:
$18,510
State:
$21,628
Here:
19.3% of AGI
State:
18.4% of AGI
(% of AGI for various income ranges: 7.3% for AGIs below $25k, 8.1% for AGIs $25k-50k, 10.5% for AGIs $50k-75k, 11.3% for AGIs $75k-100k, 12.8% for AGIs $100k-200k, 10.8% for AGIs over 200k)
Charity contributions: $2,911 (reported on 25.8% of returns)
Here:
$2,911
State:
$4,225
(% of AGI for various income ranges: 0.7% for AGIs below $25k, 1.0% for AGIs $25k-50k, 1.4% for AGIs $50k-75k, 1.5% for AGIs $75k-100k, 1.9% for AGIs $100k-200k, 2.0% for AGIs over 200k)
Taxes paid: $7,191 (reported on 28.9% of returns)
48193:
$7,191
State:
$8,327
(% of AGI for various income ranges: 1.8% for AGIs below $25k, 2.2% for AGIs $25k-50k, 3.6% for AGIs $50k-75k, 4.4% for AGIs $75k-100k, 5.6% for AGIs $100k-200k, 5.5% for AGIs over 200k)
Earned income credit: $2,181 (reported on 15.5% of returns)
Here:
$2,181
State:
$2,306
(% of AGI for various income ranges: 5.5% for AGIs below $25k, 0.9% for AGIs $25k-50k)
Percentage of individuals using paid preparers for their 2012 taxes: 61.2%
Here:
61%
State:
57%
(% for various income ranges: 57.9% for AGIs below $25k, 60.8% for AGIs $25k-50k, 66.0% for AGIs $50k-75k, 61.3% for AGIs $75k-100k, 64.8% for AGIs $100k-200k, 84.6% for AGIs over 200k)
Averages for the 2004 tax year for zip code 48193, filed in 2005:
Average Adjusted Gross Income (AGI) in 2004: $36,055 (Individual Income Tax Returns)
Here:
$36,055
State:
$48,204
Salary/wage: $33,811 (reported on 84.9% of returns)
Here:
$33,811
State:
$42,791
(% of AGI for various income ranges: 95.5% for AGIs below $10k, 77.5% for AGIs $10k-25k, 83.8% for AGIs $25k-50k, 69.7% for AGIs $50k-75k, 76.3% for AGIs $75k-100k, 83.3% for AGIs over 100k)
Taxable interest for individuals: $1,493 (reported on 31.0% of returns)
This zip code:
$1,493
Michigan:
$1,725
(% of AGI for various income ranges: 3.3% for AGIs below $10k, 4.4% for AGIs $10k-25k, 0.4% for AGIs $25k-50k, 1.5% for AGIs $50k-75k, 0.4% for AGIs $75k-100k, 0.7% for AGIs over 100k)
Taxable dividends: $1,658 (reported on 15.5% of returns)
Here:
$1,658
State:
$3,420
(% of AGI for various income ranges: 0.9% for AGIs below $10k, 1.0% for AGIs $10k-25k, 0.8% for AGIs $25k-50k, 1.3% for AGIs $50k-75k, 0.4% for AGIs over 100k)
Net capital gain/loss: +$2,299 (reported on 13.6% of returns)
Here:
+$2,299
State:
+$8,532
(% of AGI for various income ranges: -1.2% for AGIs $10k-25k, 0.5% for AGIs $25k-50k, 0.7% for AGIs $50k-75k, 2.6% for AGIs over 100k)
Profit/loss from business: +$7,979 (reported on 9.6% of returns)
Here:
+$7,979
State:
+$9,547
Total itemized deductions: $18,656 (24% of AGI, reported on 26.1% of returns)
Here:
$18,656
State:
$18,509
Here:
24.2% of AGI
State:
20.7% of AGI
(% of AGI for various income ranges: 10.7% for AGIs $10k-25k, 10.7% for AGIs $25k-50k, 14.5% for AGIs $50k-75k, 14.0% for AGIs $75k-100k, 17.8% for AGIs over 100k)
Charity contributions deductions: $2,243 (3% of AGI, reported on 23.4% of returns)
Here:
$2,243
State:
$3,365
Here:
2.8% of AGI
State:
3.6% of AGI
(% of AGI for various income ranges: 1.2% for AGIs $25k-50k, 1.8% for AGIs $50k-75k, 2.7% for AGIs $75k-100k, 1.6% for AGIs over 100k)
Total tax: $5,162 (reported on 69.2% of returns)
48193:
$5,162
State:
$7,691
(% of AGI for various income ranges: 2.1% for AGIs below $10k, 4.0% for AGIs $10k-25k, 7.9% for AGIs $25k-50k, 8.6% for AGIs $50k-75k, 12.3% for AGIs $75k-100k, 14.9% for AGIs over 100k)
Earned income credit: $1,639 (reported on 16.9% of returns)
Here:
$1,639
State:
$1,737
Percentage of individuals using paid preparers for their 2004 taxes: 62.7%
Here:
63%
State:
60%
(% for various income ranges: 44.0% for AGIs below $10k, 64.8% for AGIs $10k-25k, 64.8% for AGIs $25k-50k, 76.4% for AGIs $50k-75k, 80.8% for AGIs $75k-100k, 80.0% for AGIs over 100k)
Likely homosexual households (counted as self-reported same-sex unmarried-partner households)
Lesbian couples: 0.6% of all households
Gay men: 0.0% of all households
Household received Food Stamps/SNAP in the past 12 months: 891 Household did not receive Food Stamps/SNAP in the past 12 months: 5,819
Women who had a birth in the past 12 months: 75 (51 now married, 23 unmarried) Women who did not have a birth in the past 12 months: 3,469 (1,486 now married, 1,980 unmarried)
Housing units in zip code 48193 with a mortgage: 2,724 (251 second mortgage, 15 home equity loan, 213 both second mortgage and home equity loan) Houses without a mortgage: 106
Median monthly owner costs for units with a mortgage: $1,510 Median monthly owner costs for units without a mortgage: $667
Residents with income below the poverty level in 2022:
This zip code:
11.1%
Whole state:
13.4%
Residents with income below 50% of the poverty level in 2022:
This zip code:
4.1%
Whole state:
6.9%
Median number of rooms in houses and condos:
Here:
6.5
State:
6.5
Median number of rooms in apartments:
Here:
4.4
State:
4.3
Notable locations in this zip code not listed on our city pages
Notable locations in zip code 48193: Riverview Highlands Golf Course (A), Oakwood Family Health - Riverview Center (B), Riverview City Hall (C), Riverview Fire Department (D), Riverview Library (E), Riverview Police Station (F). Display/hide their locations on the map
Parks in zip code 48193 include: Vreeland Park (1), Dawnshire Park (2), Ray Street Park (3), Kingswood Park (4), Coachwood Park (5), Pensalt Park (6), Young Patriots Park (7). Display/hide their locations on the map
In group quarters: 523 (-1 institutionalized population)
Size of family households: 2,349 2-persons, 766 3-persons, 743 4-persons, 384 5-persons, 158 6-persons, 43 7-or-more-persons
Size of nonfamily households: 2,031 1-person, 220 2-persons, 9 3-persons
2,559 married couples with children.
1,061 single-parent households (409 men, 652 women).
88.0% of residents of 48193 zip code speak English at home.
1.2% of residents speak Spanish at home (87% very well, 9% well, 4% not at all).
5.8% of residents speak other Indo-European language at home (66% very well, 15% well, 14% not well, 5% not at all).
1.4% of residents speak Asian or Pacific Island language at home (54% very well, 31% well, 14% not well).
3.8% of residents speak other language at home (72% very well, 12% well, 16% not well).
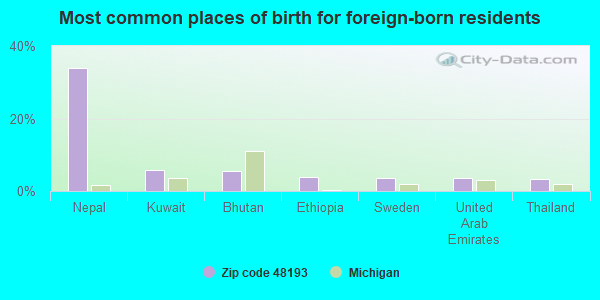
Foreign born population: 1,311 (7.8%) (71.0% of them are naturalized citizens)
This zip code:
7.8%
Whole state:
6.9%
34%Nepal
6%Kuwait
6%Bhutan
4%Ethiopia
4%Sweden
3%United Arab Emirates
3%Thailand
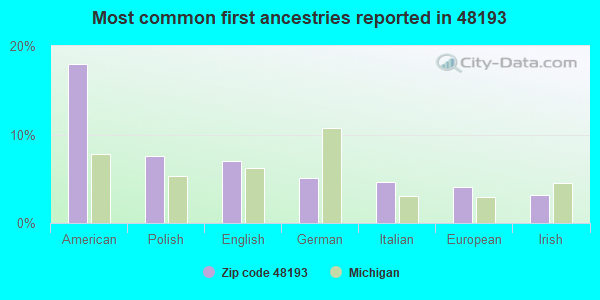
18%American
8%Polish
7%English
5%German
5%Italian
4%European
3%Irish
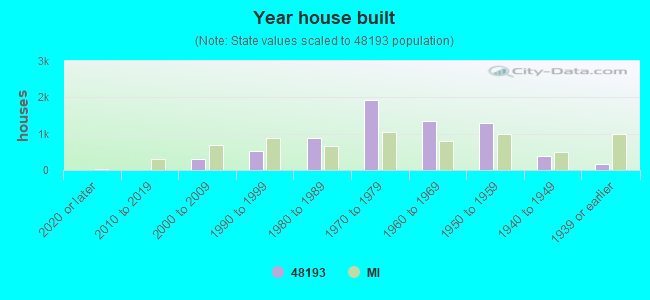
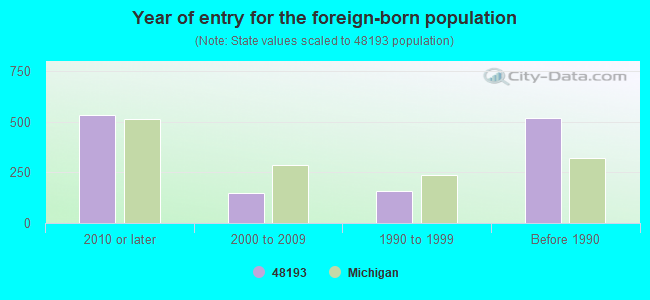
Year of entry for the foreign-born population
5332010 or later
1462000 to 2009
1601990 to 1999
516Before 1990
Housing units lacking complete kitchen facilities: 0.1%
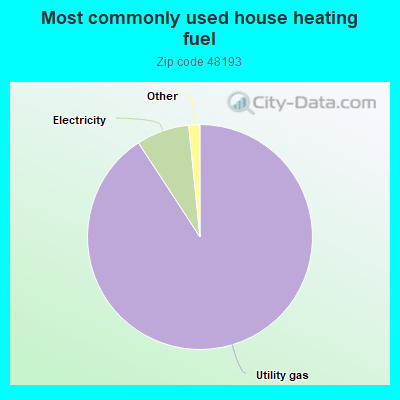
90.8%Utility gas
7.6%Electricity
0.8%Bottled, tank, or LP gas
0.7%No fuel used
Place of birth for U.S.-born residents:
This state: 13,496
Northeast: 232
Midwest: 638
South: 846
West: 142
93% of the 48193 zip code residents lived in the same house 1 year ago. Out of people who lived in different houses, 79% moved from this county. Out of people who lived in different houses, 14% moved from different county within same state. Out of people who lived in different houses, 4% moved from different state. Out of people who lived in different houses, 2% moved from abroad.
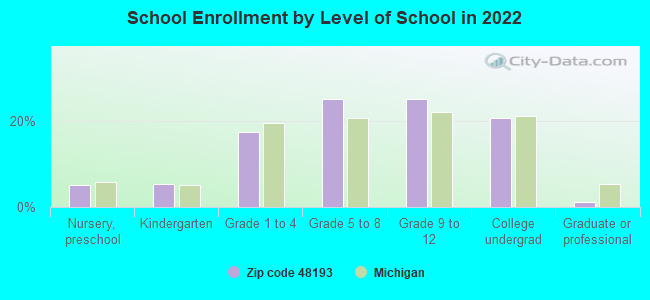
Private vs. public school enrollment:
Students in private schools in grades 1 to 8 (elementary and middle school): 47
Here:
2.9%
Michigan:
12.4%
Students in private schools in grades 9 to 12 (high school): 11
Here:
1.2%
Michigan:
9.8%
Students in private undergraduate colleges: 62
Here:
7.9%
Michigan:
14.9%
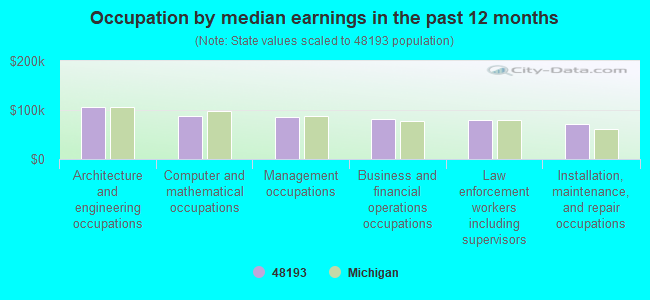
Occupation by median earnings in the past 12 months ($)
106,471Architecture and engineering occupations
86,876Computer and mathematical occupations
85,889Management occupations
81,370Business and financial operations occupations
79,939Law enforcement workers including supervisors
71,113Installation, maintenance, and repair occupations
Top industries in this zip code by the number of employees in 2005:
Other Services (except Public Administration): Religious Organizations (20-49 employees: 1 establishment, 10-19 employees: 1 establishment, 5-9 employees: 2 establishments, 1-4 employees: 5 establishments)
Educational Services: Elementary and Secondary Schools (50-99: 1)
2005 - 2018 National Fire Incident Reporting System (NFIRS) incidents
Based on the data from the years 2005 - 2018 the average number of fire incidents per year is 32. The highest number of fires - 56 took place in 2006, and the least - 12 in 2005. The data has a growing trend.
When looking into fire subcategories, the most incidents belonged to: Structure Fires (54.8%), and Outside Fires (23.0%).
Fire incident types reported to NFIRS in Zip Code 48193


 Based on the data from the years 2005 - 2018 the average number of fire incidents per year is 32. The highest number of fires - 56 took place in 2006, and the least - 12 in 2005. The data has a growing trend.
 When looking into fire subcategories, the most incidents belonged to: Structure Fires (54.8%), and Outside Fires (23.0%).