Estimated zip code population in 2022: 21,535 Zip code population in 2010: 20,245 Zip code population in 2000: 16,718
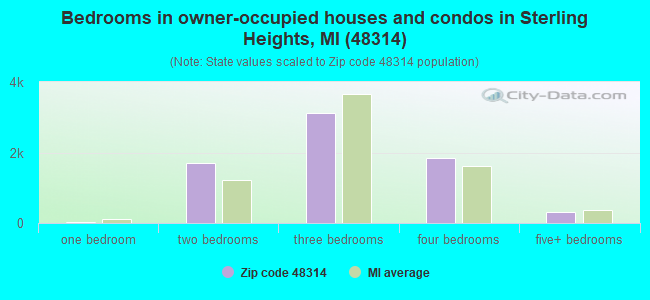
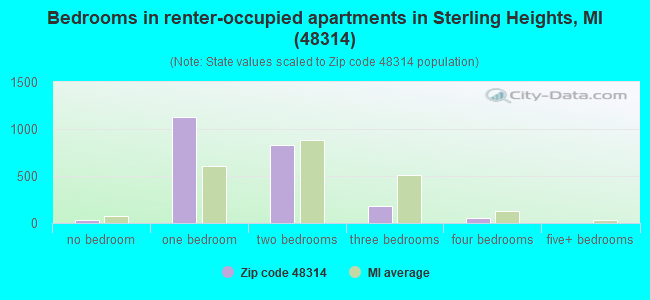
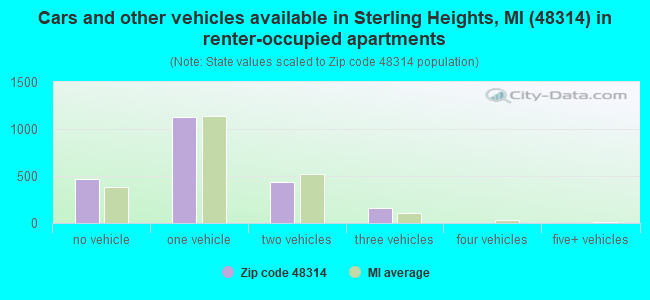
Houses and condos: 9,225 Renter-occupied apartments: 2,194
% of renters here:
24%
State:
27%
March 2022 cost of living index in zip code 48314: 98.4 (near average, U.S. average is 100)
Land area: 7.7 sq. mi. Water area: 0.0 sq. mi.
Population density: 2,794 people per square mile
(average).
OSM Map
General Map
Google Map
MSN Map
OSM Map
General Map
Google Map
MSN Map
OSM Map
General Map
Google Map
MSN Map
OSM Map
General Map
Google Map
MSN Map
Please wait while loading the map...
Real estate property taxes paid for housing units in 2022:
This zip code:
1.2% ($3,959)
Michigan:
1.2% ($2,746)
Median real estate property taxes paid for housing units with mortgages in 2022: $3,878 (1.2%) Median real estate property taxes paid for housing units with no mortgage in 2022: $4,108 (1.3%)
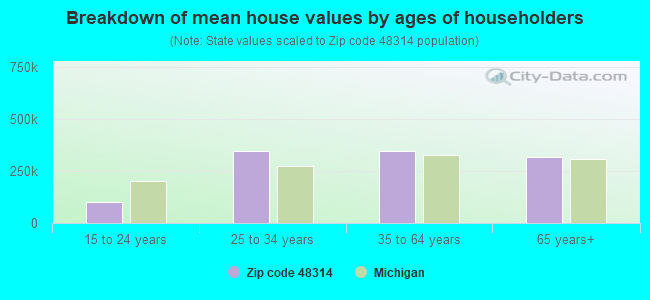
Estimated median house/condo value in 2022: $325,386
48314:
$325,386
Michigan:
$224,400
According to our research of Michigan and other state lists, there were 29 registered sex offenders living in 48314 zip code as of May 15, 2024. The ratio of all residents to sex offenders in zip code 48314 is 721 to 1. The ratio of registered sex offenders to all residents in this zip code is lower than the state average.
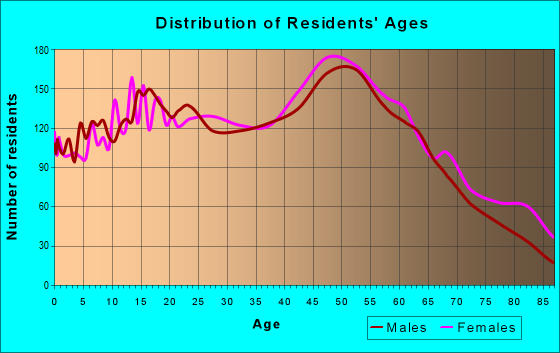
Median resident age:
This zip code:
46.7 years
Michigan median age:
40.3 years
Average household size:
This zip code:
2.3 people
Michigan:
2.4 people
Averages for the 2020 tax year for zip code 48314, filed in 2021:
Average Adjusted Gross Income (AGI) in 2020: $66,966 (Individual Income Tax Returns)
Here:
$66,966
State:
$68,945
Salary/wage: $55,974 (reported on 74.0% of returns)
Here:
$55,974
State:
$57,142
(% of AGI for various income ranges: 1124.8% for AGIs below $25k, 3325.1% for AGIs $25k-50k, 6296.2% for AGIs $50k-75k, 9395.9% for AGIs $75k-100k, 17099.6% for AGIs $100k-200k, 67400.0% for AGIs over 200k)
Taxable interest for individuals: $1,750 (reported on 34.2% of returns)
This zip code:
$1,750
Michigan:
$1,630
(% of AGI for various income ranges: 21.0% for AGIs below $25k, 49.0% for AGIs $25k-50k, 71.0% for AGIs $50k-75k, 108.3% for AGIs $75k-100k, 204.3% for AGIs $100k-200k, 1470.0% for AGIs over 200k)
Ordinary dividends: $4,699 (reported on 22.5% of returns)
Here:
$4,699
State:
$6,972
(% of AGI for various income ranges: 29.7% for AGIs below $25k, 56.6% for AGIs $25k-50k, 128.5% for AGIs $50k-75k, 209.5% for AGIs $75k-100k, 476.8% for AGIs $100k-200k, 2180.0% for AGIs over 200k)
Net capital gain/loss in AGI: +$16,312 (reported on 22.1% of returns)
Here:
+$16,312
State:
+$20,064
(% of AGI for various income ranges: 18.3% for AGIs below $25k, 64.4% for AGIs $25k-50k, 149.5% for AGIs $50k-75k, 242.7% for AGIs $75k-100k, 681.6% for AGIs $100k-200k, 21529.3% for AGIs over 200k)
Profit/loss from business: +$10,669 (reported on 14.0% of returns)
Here:
+$10,669
State:
+$11,172
(% of AGI for various income ranges: 96.4% for AGIs below $25k, 168.5% for AGIs $25k-50k, 162.5% for AGIs $50k-75k, 178.6% for AGIs $75k-100k, 383.7% for AGIs $100k-200k, 3790.0% for AGIs over 200k)
Taxable individual retirement arrangement distribution: $20,030 (reported on 11.3% of returns)
48314:
$20,030
Michigan:
$19,803
(% of AGI for various income ranges: 64.7% for AGIs below $25k, 158.0% for AGIs $25k-50k, 302.7% for AGIs $50k-75k, 553.9% for AGIs $75k-100k, 1106.0% for AGIs $100k-200k, 2853.6% for AGIs over 200k)
Self-employed (Keogh) retirement plans: $24,367 (reported on 0.3% of returns)
48314:
$24,367
Michigan:
$25,132
(% of AGI for various income ranges: 522.1% for AGIs over 200k)
Total itemized deductions: $30,288 (reported on 7.1% of returns)
Here:
$30,288
State:
$34,117
(% of AGI for various income ranges: 59.5% for AGIs below $25k, 138.7% for AGIs $25k-50k, 253.8% for AGIs $50k-75k, 498.9% for AGIs $75k-100k, 821.3% for AGIs $100k-200k, 4947.1% for AGIs over 200k)
Charity contributions: $7,287 (reported on 6.0% of returns)
Here:
$7,287
State:
$13,548
(% of AGI for various income ranges: 3.9% for AGIs below $25k, 18.5% for AGIs $25k-50k, 35.6% for AGIs $50k-75k, 81.2% for AGIs $75k-100k, 171.0% for AGIs $100k-200k, 1438.6% for AGIs over 200k)
Taxes paid: $7,883 (reported on 7.1% of returns)
48314:
$7,883
State:
$7,972
(% of AGI for various income ranges: 11.8% for AGIs below $25k, 32.5% for AGIs $25k-50k, 78.7% for AGIs $50k-75k, 151.4% for AGIs $75k-100k, 255.3% for AGIs $100k-200k, 901.4% for AGIs over 200k)
Earned income credit: $2,114 (reported on 11.7% of returns)
Here:
$2,114
State:
$2,251
(% of AGI for various income ranges: 74.0% for AGIs below $25k, 67.7% for AGIs $25k-50k, 1.3% for AGIs $50k-75k)
Percentage of individuals using paid preparers for their 2020 taxes: 92.1%
Here:
92%
State:
93%
(% for various income ranges: 91.0% for AGIs below $25k, 92.7% for AGIs $25k-50k, 92.9% for AGIs $50k-75k, 91.7% for AGIs $75k-100k, 92.7% for AGIs $100k-200k, 93.8% for AGIs over 200k)
Averages for the 2012 tax year for zip code 48314, filed in 2013:
Average Adjusted Gross Income (AGI) in 2012: $58,194 (Individual Income Tax Returns)
Here:
$58,194
State:
$55,609
Salary/wage: $51,111 (reported on 79.6% of returns)
Here:
$51,111
State:
$46,782
(% of AGI for various income ranges: 69.5% for AGIs below $25k, 68.8% for AGIs $25k-50k, 68.2% for AGIs $50k-75k, 72.8% for AGIs $75k-100k, 77.6% for AGIs $100k-200k, 57.7% for AGIs over 200k)
Taxable interest for individuals: $1,953 (reported on 39.7% of returns)
This zip code:
$1,953
Michigan:
$1,491
(% of AGI for various income ranges: 1.6% for AGIs below $25k, 0.9% for AGIs $25k-50k, 1.1% for AGIs $50k-75k, 0.6% for AGIs $75k-100k, 0.8% for AGIs $100k-200k, 3.1% for AGIs over 200k)
Ordinary dividends: $3,796 (reported on 24.3% of returns)
Here:
$3,796
State:
$6,225
(% of AGI for various income ranges: 1.7% for AGIs below $25k, 1.5% for AGIs $25k-50k, 2.0% for AGIs $50k-75k, 1.3% for AGIs $75k-100k, 1.3% for AGIs $100k-200k, 1.9% for AGIs over 200k)
Net capital gain/loss in AGI: +$3,256 (reported on 20.4% of returns)
Here:
+$3,256
State:
+$9,326
(% of AGI for various income ranges: 0.3% for AGIs $75k-100k, 0.4% for AGIs $100k-200k, 5.3% for AGIs over 200k)
Profit/loss from business: +$10,465 (reported on 12.4% of returns)
Here:
+$10,465
State:
+$11,523
(% of AGI for various income ranges: 6.6% for AGIs below $25k, 3.9% for AGIs $25k-50k, 2.3% for AGIs $50k-75k, 1.3% for AGIs $75k-100k, 2.0% for AGIs $100k-200k, 0.5% for AGIs over 200k)
Taxable individual retirement arrangement distribution: $15,050 (reported on 12.6% of returns)
48314:
$15,050
Michigan:
$15,298
(% of AGI for various income ranges: 4.1% for AGIs below $25k, 3.5% for AGIs $25k-50k, 3.9% for AGIs $50k-75k, 3.8% for AGIs $75k-100k, 3.3% for AGIs $100k-200k, 1.8% for AGIs over 200k)
Self-employment retirement plans: $11,250 (reported on 0.4% of returns)
48314:
$11,250
Michigan:
$20,834
Total itemized deductions: $20,507 (19% of AGI, reported on 34.6% of returns)
Here:
$20,507
State:
$21,628
Here:
18.9% of AGI
State:
18.4% of AGI
(% of AGI for various income ranges: 10.1% for AGIs below $25k, 11.6% for AGIs $25k-50k, 13.0% for AGIs $50k-75k, 12.7% for AGIs $75k-100k, 13.6% for AGIs $100k-200k, 10.2% for AGIs over 200k)
Charity contributions: $3,138 (reported on 30.0% of returns)
Here:
$3,138
State:
$4,225
(% of AGI for various income ranges: 0.7% for AGIs below $25k, 1.3% for AGIs $25k-50k, 1.4% for AGIs $50k-75k, 1.6% for AGIs $75k-100k, 2.1% for AGIs $100k-200k, 1.7% for AGIs over 200k)
Taxes paid: $7,675 (reported on 34.6% of returns)
48314:
$7,675
State:
$8,327
(% of AGI for various income ranges: 2.3% for AGIs below $25k, 3.1% for AGIs $25k-50k, 3.8% for AGIs $50k-75k, 4.7% for AGIs $75k-100k, 5.7% for AGIs $100k-200k, 5.0% for AGIs over 200k)
Earned income credit: $2,150 (reported on 13.2% of returns)
Here:
$2,150
State:
$2,306
(% of AGI for various income ranges: 4.8% for AGIs below $25k, 0.9% for AGIs $25k-50k)
Percentage of individuals using paid preparers for their 2012 taxes: 62.3%
Here:
62%
State:
57%
(% for various income ranges: 61.0% for AGIs below $25k, 63.1% for AGIs $25k-50k, 66.0% for AGIs $50k-75k, 61.8% for AGIs $75k-100k, 59.7% for AGIs $100k-200k, 70.0% for AGIs over 200k)
Averages for the 2004 tax year for zip code 48314, filed in 2005:
Average Adjusted Gross Income (AGI) in 2004: $55,637 (Individual Income Tax Returns)
Here:
$55,637
State:
$48,204
Salary/wage: $51,414 (reported on 83.1% of returns)
Here:
$51,414
State:
$42,791
(% of AGI for various income ranges: 102.1% for AGIs below $10k, 61.7% for AGIs $10k-25k, 72.9% for AGIs $25k-50k, 75.8% for AGIs $50k-75k, 81.3% for AGIs $75k-100k, 77.9% for AGIs over 100k)
Taxable interest for individuals: $1,993 (reported on 60.1% of returns)
This zip code:
$1,993
Michigan:
$1,725
(% of AGI for various income ranges: 8.2% for AGIs below $10k, 4.8% for AGIs $10k-25k, 2.6% for AGIs $25k-50k, 1.8% for AGIs $50k-75k, 1.6% for AGIs $75k-100k, 1.8% for AGIs over 100k)
Taxable dividends: $2,137 (reported on 32.1% of returns)
Here:
$2,137
State:
$3,420
(% of AGI for various income ranges: 4.1% for AGIs below $10k, 2.7% for AGIs $10k-25k, 1.7% for AGIs $25k-50k, 1.3% for AGIs $50k-75k, 1.0% for AGIs $75k-100k, 0.9% for AGIs over 100k)
Net capital gain/loss: +$4,041 (reported on 26.3% of returns)
Here:
+$4,041
State:
+$8,532
(% of AGI for various income ranges: -1.6% for AGIs below $10k, -0.3% for AGIs $10k-25k, 0.5% for AGIs $25k-50k, 0.5% for AGIs $50k-75k, 1.1% for AGIs $75k-100k, 3.6% for AGIs over 100k)
Profit/loss from business: +$10,464 (reported on 11.4% of returns)
Here:
+$10,464
State:
+$9,547
(% of AGI for various income ranges: 6.5% for AGIs below $10k, 5.5% for AGIs $10k-25k, 2.6% for AGIs $25k-50k, 2.8% for AGIs $50k-75k, 1.8% for AGIs $75k-100k, 1.4% for AGIs over 100k)
IRA payment deduction: $3,153 (reported on 2.4% of returns)
48314:
$3,153
Michigan:
$2,875
(% of AGI for various income ranges: 0.2% for AGIs $10k-25k, 0.2% for AGIs $25k-50k, 0.2% for AGIs $50k-75k, 0.1% for AGIs $75k-100k, 0.1% for AGIs over 100k)
Self-employed pension: $10,154 (reported on 0.5% of returns)
Here:
$10,154
Michigan:
$13,826
Total itemized deductions: $18,793 (21% of AGI, reported on 46.7% of returns)
Here:
$18,793
State:
$18,509
Here:
20.9% of AGI
State:
20.7% of AGI
(% of AGI for various income ranges: 18.3% for AGIs below $10k, 12.3% for AGIs $10k-25k, 15.2% for AGIs $25k-50k, 18.3% for AGIs $50k-75k, 18.0% for AGIs $75k-100k, 14.5% for AGIs over 100k)
Charity contributions deductions: $2,819 (3% of AGI, reported on 43.0% of returns)
Here:
$2,819
State:
$3,365
Here:
3.0% of AGI
State:
3.6% of AGI
(% of AGI for various income ranges: 0.9% for AGIs below $10k, 1.1% for AGIs $10k-25k, 1.8% for AGIs $25k-50k, 2.1% for AGIs $50k-75k, 2.5% for AGIs $75k-100k, 2.4% for AGIs over 100k)
Total tax: $8,552 (reported on 80.7% of returns)
48314:
$8,552
State:
$7,691
(% of AGI for various income ranges: 2.8% for AGIs below $10k, 4.4% for AGIs $10k-25k, 7.6% for AGIs $25k-50k, 9.4% for AGIs $50k-75k, 10.5% for AGIs $75k-100k, 17.0% for AGIs over 100k)
Earned income credit: $1,530 (reported on 7.7% of returns)
Here:
$1,530
State:
$1,737
Percentage of individuals using paid preparers for their 2004 taxes: 60.1%
Here:
60%
State:
60%
(% for various income ranges: 53.3% for AGIs below $10k, 62.1% for AGIs $10k-25k, 64.3% for AGIs $25k-50k, 60.8% for AGIs $50k-75k, 61.1% for AGIs $75k-100k, 58.1% for AGIs over 100k)
Household received Food Stamps/SNAP in the past 12 months: 864 Household did not receive Food Stamps/SNAP in the past 12 months: 8,289
Women who had a birth in the past 12 months: 230 (188 now married, 44 unmarried) Women who did not have a birth in the past 12 months: 4,367 (1,854 now married, 2,509 unmarried)
Housing units in zip code 48314 with a mortgage: 4,114 (521 second mortgage, 35 home equity loan, 432 both second mortgage and home equity loan) Houses without a mortgage: 313
Median monthly owner costs for units with a mortgage: $1,630 Median monthly owner costs for units without a mortgage: $751
Residents with income below the poverty level in 2022:
This zip code:
9.9%
Whole state:
13.4%
Residents with income below 50% of the poverty level in 2022:
This zip code:
5.4%
Whole state:
6.9%
Median number of rooms in houses and condos:
Here:
6.4
State:
6.5
Median number of rooms in apartments:
Here:
3.6
State:
4.3
Notable locations in this zip code not listed on our city pages
Notable locations in zip code 48314: Four Seasons Shopping Plaza (A), Beaumont Outpatient Medical Building (B), Sterling Heights Fire Department Station 5 Headquarters (C). Display/hide their locations on the map
Churches in zip code 48314 include: Utica United Methodist Church (A), Covenant Baptist Church (B), Community Christian Church (C), Freedom Christian Assembly Church (D), Saint Cyril and Methodius Church (E). Display/hide their locations on the map
3,118 married couples with children.
501 single-parent households (197 men, 304 women).
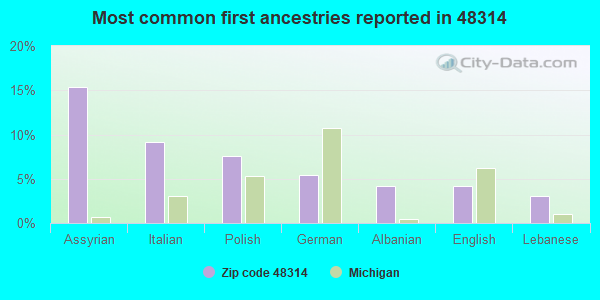
65.6% of residents of 48314 zip code speak English at home.
1.8% of residents speak Spanish at home (51% very well, 41% well, 3% not well, 5% not at all).
13.0% of residents speak other Indo-European language at home (77% very well, 14% well, 7% not well, 1% not at all).
5.7% of residents speak Asian or Pacific Island language at home (70% very well, 22% well, 8% not well).
14.3% of residents speak other language at home (66% very well, 18% well, 9% not well, 6% not at all).
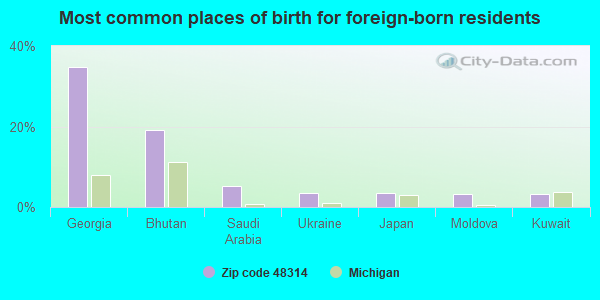
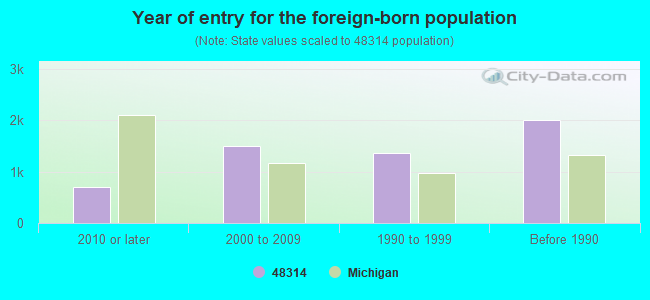
Foreign born population: 5,807 (27.0%) (84.1% of them are naturalized citizens)
Major facilities with environmental interests located in this zip code:
AUTOMOTIVE COMPOSITES COMPANY (44650 MERRILL RD. in STERLING HTS, MI)
AIR SYNTHETIC MINOR (AIRS/AFS) COMPLIANCE ACTIVITY (Tracking inspections of insecticide, fungicide, and rodenticide, and toxic substances) CRITERIA AND HAZARDOUS AIR POLLUTANT INVENTORY (Inventory of air pollution sources) (Resource Conservation and Recovery Act (tracking hazardous waste)) HAZARDOUS WASTE BIENNIAL REPORTER (Resource Conservation and Recovery Act (tracking hazardous waste)) - ICIS-, ENFORCEMENT/COMPLIANCE ACTIVITY Small Quantity Generators, between 100 kg and 1000 kg of hazardous waste/month (Resource Conservation and Recovery Act (tracking hazardous waste)) - ICIS-, ENFORCEMENT/COMPLIANCE ACTIVITY TRI REPORTER (Tracking of toxic chemicals releasing facilities) - ICIS-05-2004-0110, FORMAL ENFORCEMENT ACTION Business SIC classification: MOTOR VEHICLE PARTS AND ACCESSORIES Organizations: RAYBESTOS AUTOMOTIVE COMPONENTS COMPANY (CONTACT/OPERATOR)
, RAYBESTOS PRODUCTS COMPANY (CONTACT/OWNER)
Alternative names: ADVANCED FRICTION MATERIALS CO, RAYBESTOS AUTOMOTIVE COMPONENTS CO
AIR SYNTHETIC MINOR (AIRS/AFS) (Integrated Compliance Information System) - ICIS-05-1985-0149, FORMAL ENFORCEMENT ACTION Large Quantity Generators, more that 1000 kg of hazardous waste/month (Resource Conservation and Recovery Act (tracking hazardous waste)) TRI REPORTER (Tracking of toxic chemicals releasing facilities) Business SIC classification: MOTOR VEHICLE PARTS AND ACCESSORIES Organizations: DCT INC (CONTACT/OPERATOR)
Alternative names: BORG & BECK, BORG-WARNER CORP BORG & BECK DIV, BORG WARNER AUTOMOTIVE
FORD VAN DYKE PLANT (41111 VAN DYKE in STERLING HTS, MI)
AIR SYNTHETIC MINOR (AIRS/AFS) COMPLIANCE ACTIVITY (Tracking inspections of insecticide, fungicide, and rodenticide, and toxic substances) CRITERIA AND HAZARDOUS AIR POLLUTANT INVENTORY (Inventory of air pollution sources) HAZARDOUS WASTE BIENNIAL REPORTER (Resource Conservation and Recovery Act (tracking hazardous waste)) Small Quantity Generators, between 100 kg and 1000 kg of hazardous waste/month (Resource Conservation and Recovery Act (tracking hazardous waste)) TRI REPORTER (Tracking of toxic chemicals releasing facilities) Business SIC classification: AUTOMOTIVE STAMPINGS; MOTOR VEHICLE PARTS AND ACCESSORIES Organizations: FORD MOTOR CO (CONTACT/OPERATOR)
Alternative names: FORD MOTOR CO, FORD MOTOR CO VAN DYKE PLT
EQUILON ENTERPRISES LLC (39600 VAN DYKE in STERLING HEIGHTS, MI)
HAZARDOUS WASTE BIENNIAL REPORTER (Resource Conservation and Recovery Act (tracking hazardous waste)) (Resource Conservation and Recovery Act (tracking hazardous waste)) Alternative names: EQUILON ENTERPRISES LLC SERVICE ST-MI, SHELL OIL CO 221 9001 0904
DRESDEN ELEMENTARY SCHOOL (11400 DELVIN DRIVE in STERLING HEIGHTS, MI)
(National Center for Education Statistics) - STATE ID-00958 Organizations: UTICA COMMUNITY SCHOOLS (SCHOOL DISTRICT)
EXELON SERVICES INC (6260 18 1/2 MILE ROAD in STERLING HEIGHTS, MI)
CHIVAS PRODUCTS LIMITED (42555 MERRILL in STERLING HTS, MI)
AIR SYNTHETIC MINOR (AIRS/AFS) CRITERIA AND HAZARDOUS AIR POLLUTANT INVENTORY (Inventory of air pollution sources) Conditionally Exempt Small Quantity Generators, less than 100 kg/month of hazardous waste (Resource Conservation and Recovery Act (tracking hazardous waste)) TRI REPORTER (Tracking of toxic chemicals releasing facilities) Business SIC classification: MOTOR VEHICLES AND PASSENGER CAR BODIES; MOTOR VEHICLE PARTS AND ACCESSORIES Organizations: RDM HOLDINGS (CONTACT/OPERATOR)
Alternative names: CONTINENTAL LIGHTING
GILBAR ENGINEERING (6570 19 MILE RD in STERLING HEIGHTS, MI)
(Resource Conservation and Recovery Act (tracking hazardous waste)) Organizations: GARY REBAR (BUS) LEDD`S DEV(PROP) (CONTACT/OWNER)
, GILBAR TESTING LAB (CONTACT/OWNER)
Alternative names: GILBAR TESTING LAB
MI DEPT/TRANSPORTATION BRIDGE (M-53 OVER CLINTON RIVER in STERLING HEIGHTS, MI)
(Resource Conservation and Recovery Act (tracking hazardous waste)) Organizations: MICH DEPT OF TRANSPORTATION (CONTACT/OPERATOR)
Alternative names: MIDOT BRIDGE M-53 OVER CLINTON RIVER
AMOCO OIL CO 285 0002 (5955 18 MILE in STERLING HEIGHTS, MI)
(Resource Conservation and Recovery Act (tracking hazardous waste)) Organizations: AMOCO OIL COMPANY (CONTACT/OWNER)
FORD MOTOR CO STERLING II PLANT (6650 18 1/2 MILE RD in STERLING HEIGHTS, MI)
CRITERIA AND HAZARDOUS AIR POLLUTANT INVENTORY (Inventory of air pollution sources) Small Quantity Generators, between 100 kg and 1000 kg of hazardous waste/month (Resource Conservation and Recovery Act (tracking hazardous waste)) TRI REPORTER (Tracking of toxic chemicals releasing facilities) Business SIC classification: MOTOR VEHICLE PARTS AND ACCESSORIES Alternative names: VISTEON CORPORATION - GEAR FACILITY, VISTEON CORP STERLING II PLANT, VISTEON CORPORTION
Housing units lacking complete plumbing facilities: 0.3% Housing units lacking complete kitchen facilities: 1.6%
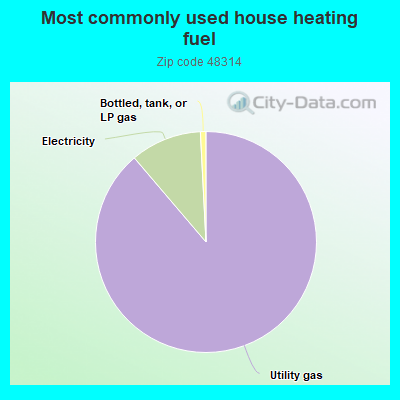
88.5%Utility gas
10.4%Electricity
0.8%Bottled, tank, or LP gas
Population in 1990: 8,502. Population change in the 1990s: +8,216 (+96.6%).
Place of birth for U.S.-born residents:
This state: 13,554
Northeast: 492
Midwest: 735
South: 633
West: 260
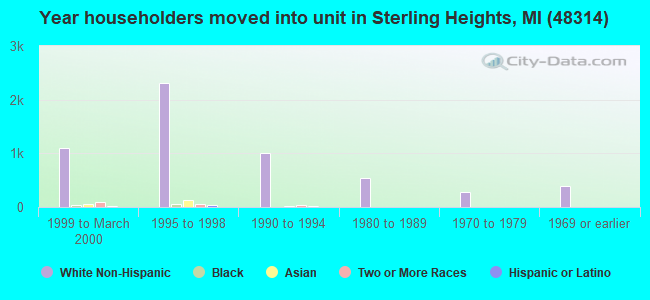
42% of the 48314 zip code residents lived in the same house 5 years ago. Out of people who lived in different houses, 60% lived in this county. Out of people who lived in different counties, 50% lived in Michigan.
91% of the 48314 zip code residents lived in the same house 1 year ago. Out of people who lived in different houses, 63% moved from this county. Out of people who lived in different houses, 24% moved from different county within same state. Out of people who lived in different houses, 10% moved from different state. Out of people who lived in different houses, 2% moved from abroad.
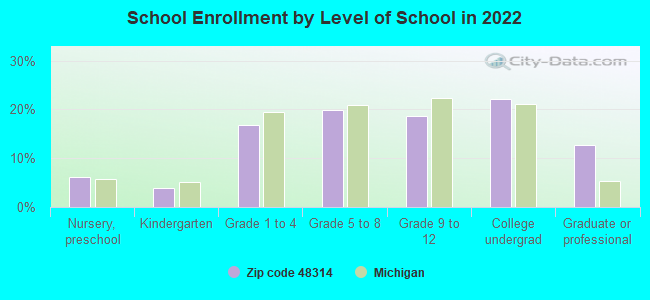
Private vs. public school enrollment:
Students in private schools in grades 1 to 8 (elementary and middle school): 131
Here:
7.4%
Michigan:
12.4%
Students in private schools in grades 9 to 12 (high school): 66
Here:
7.4%
Michigan:
9.8%
Students in private undergraduate colleges: 107
Here:
10.1%
Michigan:
14.9%
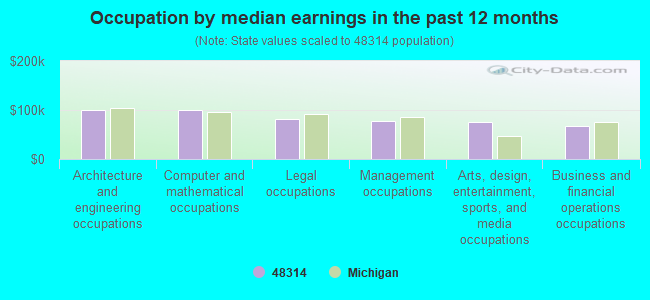
Occupation by median earnings in the past 12 months ($)
99,500Architecture and engineering occupations
99,458Computer and mathematical occupations
81,634Legal occupations
78,096Management occupations
74,766Arts, design, entertainment, sports, and media occupations
68,091Business and financial operations occupations
Companies with biggest federal contracts located in this zip code (STERLING HEIGH, MI):
STEWART & STEVENSON VEHICLE SE (6750 NINETEEN MILE ROAD) : $15,883,878 in 8 contractsfrom 2003 to 2005
Contracts for Other Research and Development -- Basic Research (R&D), Defense Tank - Automotive -- Advanced Development (R&D), Other Professional Services by Army Signed by year:2000: $0; 2001: $0; 2002: $0; 2003: $784,533; 2004: $3,646,181; 2005: $11,453,164; 2006: $0.
Biggest contracts:
$8,942,008 with Army for Other Research and Development -- Basic Research (R&D). Signed on 2005-08-22. Completion date: 2007-05-30.
$2,411,156, same as above.Signed on 2005-09-13. Completion date: 2005-06-30.
$2,052,466, same as above.Signed on 2004-09-28. Completion date: 2005-06-30.
$1,532,566 with Army for Defense Tank - Automotive -- Advanced Development (R&D). Signed on 2004-12-17. Completion date: 2005-09-30.
INTEGRETED CONCEPTS&RESEARCH C (41150 TECHNOLOGY PARK DRIV; small business) : $2,682,191 in 11 contractsfrom 2001 to 2005
Contracts for Surface Motor Vehicles -- Advanced Development (R&D), Defense Aircraft -- Basic Research (R&D), X-Ray Equipment and Supplies: Medical, Dental, Veterinary, Ophthalmic Instruments, Equipment, and Supplies, and moreby Army, Air Force, Department of Veterans Affairs, Public Health Service, and others Signed by year:2000: $0; 2001: $0; 2002: $0; 2003: $0; 2004: $1,820,619; 2005: $861,572; 2006: $0.
Biggest contracts:
$1,690,269 with Army for Surface Motor Vehicles -- Advanced Development (R&D). Signed on 2004-06-23. Completion date: 2005-10-31.
$400,000, same as above.Signed on 2005-06-08. Completion date: 2005-10-31.
$162,594, same as above.Signed on 2005-03-01. Completion date: 2005-10-31.
$103,247, same as above.Signed on 2005-12-21. Completion date: 2005-10-31.
C DAVIS ROOFING, INC (6539 BURROUGHS; small business) : $726,150 in 7 contractsfrom 2000 to 2004
Contracts for Maintenance, Repair or Alteration of Real Property -- Other Airfield Structures, Maintenance, Repair or Alteration of Real Property -- Other Administrative Facilities and Service Buildings, Maintenance, Repair or Alteration of Real Property -- Maintenance Buildings by Army Signed by year:2000: $45,000; 2001: $120,000; 2002: $261,500; 2003: $300,700; 2004: -$1,050; 2005: $0; 2006: $0.
Biggest contracts:
$180,700 with Army for Maintenance, Repair or Alteration of Real Property -- Other Airfield Structures. Signed on 2003-09-29. Completion date: 2004-01-26.
$134,500 with Army for Maintenance, Repair or Alteration of Real Property -- Other Administrative Facilities and Service Buildings. Signed on 2002-09-29. Completion date: 2002-12-31.
$127,000, same as above.Signed on 2002-09-29. Completion date: 2003-01-30.
$120,000, same as above.Signed on 2003-09-29. Completion date: 2003-12-15.
SYSTEMS INTEGRATION SPECIALIST (6605 19 1/2 MILE RD; small business) : $220,689 in 8 contractsfrom 2004 to 2006
Contracts for ADP Software by U.S. Army Corps of Engineers - civil program financing only, Army Signed by year:2000: $0; 2001: $0; 2002: $0; 2003: $0; 2004: $12,525; 2005: $188,144; 2006: $20,020.
Biggest contracts:
$54,043 with U.S. Army Corps of Engineers - civil program financing only for ADP Software. Taking place in OR. Signed on 2005-09-12. Completion date: 2005-09-30.
$54,043 with Army for ADP Software. Taking place in OR. Signed on 2005-09-12. Completion date: 2005-09-30.
$30,022 with U.S. Army Corps of Engineers - civil program financing only for ADP Software. Taking place in MT. Signed on 2005-08-10. Completion date: 2005-08-15.
$30,022 with Army for ADP Software. Taking place in MT. Signed on 2005-08-10. Completion date: 2005-08-15.
NATIONAL CASE CORPORATION (42710 MOUND RD; small business) : $219,029 in 2 contractsfrom 2003 to 2005
$210,843 with Army for Boxes, Cartons, and Crates. Taking place in MD. Signed on 2003-09-29. Completion date: 2003-12-09.
$8,186 with Army for Specialized Shipping and Storage Containers. Signed on 2005-04-15. Completion date: 2005-04-27.
THREAD-CRAFT INC (43643 UTICA RD; small business) : $179,568 in 10 contractsfrom 2005 to 2006
Contracts for Electron Tubes and Associated Hardware by Navy Signed by year:2000: $0; 2001: $0; 2002: $0; 2003: $0; 2004: $0; 2005: $153,452; 2006: $26,116.
Biggest contracts:
$115,752 with Navy for Electron Tubes and Associated Hardware. Signed on 2005-05-18. Completion date: 2005-08-26.
$23,040, same as above.Signed on 2005-09-29. Completion date: 2005-12-06.
$14,660, same as above.Signed on 2005-05-19. Completion date: 2005-07-04.
$12,085, same as above.Signed on 2006-04-24. Completion date: 2006-06-19.
FAIRBANKS SCALES INC (42748 MOUND RD) : $81,813 in 4 contractsfrom 2004 to 2005
$63,813 with Defense Logistics Agency for Scales and Balances. Taking place in AK. Signed on 2004-02-06. Completion date: 2004-03-31.
$6,000, same as above.Signed on 2004-12-06. Completion date: 2005-09-30.
$6,000, same as above.Signed on 2005-07-15. Completion date: 2005-09-30.
$6,000 with Defense Logistics Agency for Scales and Balances. Signed on 2004-10-01. Completion date: 2004-10-30.
C AND J TOOL AND GAGE CO (42882 MOUND ROAD; small business) : $56,617 in 8 contractsfrom 2003 to 2005
Contracts for Machine Tool Accessories, Defense Tank - Automotive -- Basic Research (R&D), Invalid code: AC97, Miscellaneous Defense Hard Goods -- Basic Research (R&D), and moreby Army Signed by year:2000: $0; 2001: $0; 2002: $0; 2003: $23,900; 2004: $11,636; 2005: $21,081; 2006: $0.
Biggest contracts:
$13,604 with Army for Machine Tool Accessories. Signed on 2003-07-29. Completion date: 2003-09-15.
$13,288 with Army for Defense Tank - Automotive -- Basic Research (R&D). Signed on 2005-03-23. Completion date: 2005-05-02.
$8,380 with Army for Invalid code: AC97. Signed on 2004-01-12. Completion date: 2004-02-26.
$7,793 with Army for Defense Tank - Automotive -- Basic Research (R&D). Signed on 2005-01-11. Completion date: 2005-03-31.
INTERNATIONAL WIRE & CABLE INC (42822 MOUND RD; small business) : $48,096 in 2 contractsfrom 2004 to 2005
$24,600 with Army for Fiber Optic Cable Assemblies and Harnesses. Signed on 2005-03-30. Completion date: 2005-04-08.
$23,496 with Army for Miscellaneous Electric Power and Distribution Equipment. Signed on 2004-04-16. Completion date: 2004-05-17.
E&R INDUSTRIAL SALES INCORPORA (40800 ENTERPRISE DRIVE; small business) : $32,302 in 2 contractsfrom 2001 to 2002
$32,302 with Army for Miscellaneous Machine Tools. Signed on 2001-09-06. Completion date: 2001-10-20.
$0 with Defense Logistics Agency for Cutting Tools for Machine Tools. Signed on 2002-03-28. Completion date: 2007-03-27.
Top industries in this zip code by the number of employees in 2005:
Administrative and Support and Waste Management and Remediation Services: Temporary Help Services (250-499: 1)
Administrative and Support and Waste Management and Remediation Services: Professional Employer Organizations (100-249: 1, 50-99: 1, 20-49: 1, 10-19: 1, 5-9: 1, 1-4: 1)
Professional, Scientific, and Technical Services: Human Resources and Executive Search Consulting Services (100-249: 1, 50-99: 1, 1-4: 1)
People in group quarters in 2010:
12 people in correctional facilities intended for juveniles
10 people in group homes intended for adults
2 people in nursing facilities/skilled-nursing facilities
People in group quarters in 2000:
126 people in other noninstitutional group quarters
5 people in homes for the mentally retarded
4 people in homes for the mentally ill
Fatal accident statistics in 2013:
Fatal accident count: 1
Vehicles involved in fatal accidents: 2
Fatal accidents caused by drunken drivers: 0
Fatalities: 1
Persons involved in fatal accidents: 3
Pedestrians involved in fatal accidents: 0
Fatal accident statistics in 2011:
Fatal accident count: 3
Vehicles involved in fatal accidents: 5
Fatal accidents caused by drunken drivers: 2
Fatalities: 3
Persons involved in fatal accidents: 5
Pedestrians involved in fatal accidents: 1
Home Mortgage Disclosure Act Aggregated Statistics For Year 2009 (Based on 6 full tracts)
A) FHA, FSA/RHS & VA Home Purchase Loans
B) Conventional Home Purchase Loans
C) Refinancings
D) Home Improvement Loans
F) Non-occupant Loans on < 5 Family Dwellings (A B C & D)
G) Loans On Manufactured Home Dwelling (A B C & D)
Number
Average Value
Number
Average Value
Number
Average Value
Number
Average Value
Number
Average Value
Number
Average Value
LOANS ORIGINATED
106
$143,214
150
$126,122
609
$154,076
16
$67,055
16
$103,275
0
$0
APPLICATIONS APPROVED, NOT ACCEPTED
12
$155,747
16
$198,911
71
$172,040
2
$316,480
6
$81,757
0
$0
APPLICATIONS DENIED
31
$139,348
61
$183,796
262
$202,728
20
$34,102
6
$136,170
4
$7,168
APPLICATIONS WITHDRAWN
20
$96,677
22
$202,115
105
$194,105
2
$148,350
2
$49,450
0
$0
FILES CLOSED FOR INCOMPLETENESS
4
$241,810
12
$129,064
51
$187,886
0
$0
2
$94,945
0
$0
Aggregated Statistics For Year 2008 (Based on 6 full tracts)
A) FHA, FSA/RHS & VA Home Purchase Loans
B) Conventional Home Purchase Loans
C) Refinancings
D) Home Improvement Loans
E) Loans on Dwellings For 5+ Families
F) Non-occupant Loans on < 5 Family Dwellings (A B C & D)
G) Loans On Manufactured Home Dwelling (A B C & D)
Number
Average Value
Number
Average Value
Number
Average Value
Number
Average Value
Number
Average Value
Number
Average Value
Number
Average Value
LOANS ORIGINATED
93
$126,019
258
$164,491
373
$165,420
28
$34,701
2
$4,520,390
37
$79,027
6
$20,390
APPLICATIONS APPROVED, NOT ACCEPTED
4
$87,465
20
$195,080
77
$186,876
4
$32,638
0
$0
2
$234,395
2
$14,335
APPLICATIONS DENIED
12
$128,437
134
$198,405
262
$215,615
22
$38,439
0
$0
16
$129,428
25
$27,643
APPLICATIONS WITHDRAWN
10
$152,283
34
$131,338
59
$186,368
0
$0
0
$0
4
$79,120
0
$0
FILES CLOSED FOR INCOMPLETENESS
0
$0
12
$204,558
24
$187,176
4
$53,845
0
$0
4
$111,758
0
$0
Aggregated Statistics For Year 2007 (Based on 6 full tracts)
A) FHA, FSA/RHS & VA Home Purchase Loans
B) Conventional Home Purchase Loans
C) Refinancings
D) Home Improvement Loans
E) Loans on Dwellings For 5+ Families
F) Non-occupant Loans on < 5 Family Dwellings (A B C & D)
G) Loans On Manufactured Home Dwelling (A B C & D)
Number
Average Value
Number
Average Value
Number
Average Value
Number
Average Value
Number
Average Value
Number
Average Value
Number
Average Value
LOANS ORIGINATED
22
$125,656
363
$165,393
612
$168,254
73
$72,089
2
$13,104,250
31
$123,894
11
$9,905
APPLICATIONS APPROVED, NOT ACCEPTED
2
$133,515
45
$189,230
118
$174,303
27
$31,087
0
$0
8
$79,376
8
$13,142
APPLICATIONS DENIED
0
$0
128
$194,864
465
$194,346
39
$52,052
0
$0
26
$142,702
33
$42,871
APPLICATIONS WITHDRAWN
2
$165,825
41
$210,760
114
$180,513
2
$44,505
0
$0
8
$130,680
0
$0
FILES CLOSED FOR INCOMPLETENESS
0
$0
10
$136,296
69
$245,649
4
$137,952
0
$0
10
$147,048
0
$0
Aggregated Statistics For Year 2006 (Based on 6 full tracts)
A) FHA, FSA/RHS & VA Home Purchase Loans
B) Conventional Home Purchase Loans
C) Refinancings
D) Home Improvement Loans
E) Loans on Dwellings For 5+ Families
F) Non-occupant Loans on < 5 Family Dwellings (A B C & D)
G) Loans On Manufactured Home Dwelling (A B C & D)
Number
Average Value
Number
Average Value
Number
Average Value
Number
Average Value
Number
Average Value
Number
Average Value
Number
Average Value
LOANS ORIGINATED
31
$160,227
455
$163,882
821
$159,107
102
$61,953
2
$29,284,290
39
$133,183
8
$15,478
APPLICATIONS APPROVED, NOT ACCEPTED
0
$0
57
$187,383
187
$193,039
14
$80,761
0
$0
16
$161,668
2
$21,985
APPLICATIONS DENIED
0
$0
195
$164,828
438
$171,647
57
$74,176
0
$0
29
$148,784
23
$19,964
APPLICATIONS WITHDRAWN
0
$0
51
$183,387
249
$192,106
10
$115,597
0
$0
6
$106,362
0
$0
FILES CLOSED FOR INCOMPLETENESS
0
$0
10
$336,656
95
$176,827
12
$67,630
0
$0
4
$133,515
0
$0
Aggregated Statistics For Year 2005 (Based on 6 full tracts)
A) FHA, FSA/RHS & VA Home Purchase Loans
B) Conventional Home Purchase Loans
C) Refinancings
D) Home Improvement Loans
F) Non-occupant Loans on < 5 Family Dwellings (A B C & D)
G) Loans On Manufactured Home Dwelling (A B C & D)
Number
Average Value
Number
Average Value
Number
Average Value
Number
Average Value
Number
Average Value
Number
Average Value
LOANS ORIGINATED
41
$153,100
679
$160,405
1,050
$215,500
100
$60,497
61
$128,153
10
$26,891
APPLICATIONS APPROVED, NOT ACCEPTED
4
$175,862
63
$162,595
177
$200,113
14
$34,756
2
$399,555
12
$16,861
APPLICATIONS DENIED
6
$160,008
123
$117,316
452
$187,547
55
$119,360
23
$142,737
31
$20,139
APPLICATIONS WITHDRAWN
0
$0
89
$175,259
248
$326,903
14
$205,952
12
$176,085
4
$21,672
FILES CLOSED FOR INCOMPLETENESS
0
$0
10
$149,974
166
$201,465
14
$76,718
0
$0
0
$0
Aggregated Statistics For Year 2004 (Based on 6 full tracts)
A) FHA, FSA/RHS & VA Home Purchase Loans
B) Conventional Home Purchase Loans
C) Refinancings
D) Home Improvement Loans
F) Non-occupant Loans on < 5 Family Dwellings (A B C & D)
G) Loans On Manufactured Home Dwelling (A B C & D)
Number
Average Value
Number
Average Value
Number
Average Value
Number
Average Value
Number
Average Value
Number
Average Value
LOANS ORIGINATED
49
$155,187
850
$169,806
1,389
$180,054
63
$115,535
53
$125,778
8
$23,179
APPLICATIONS APPROVED, NOT ACCEPTED
10
$156,938
102
$183,913
185
$189,820
18
$111,828
8
$179,009
2
$44,925
APPLICATIONS DENIED
6
$150,328
139
$134,113
395
$175,793
47
$33,994
8
$136,311
50
$32,635
APPLICATIONS WITHDRAWN
0
$0
65
$180,413
199
$195,395
14
$64,762
4
$99,395
0
$0
FILES CLOSED FOR INCOMPLETENESS
4
$178,295
24
$180,151
185
$193,180
6
$152,635
4
$247,595
0
$0
Aggregated Statistics For Year 2003 (Based on 6 full tracts)
A) FHA, FSA/RHS & VA Home Purchase Loans
B) Conventional Home Purchase Loans
C) Refinancings
D) Home Improvement Loans
F) Non-occupant Loans on < 5 Family Dwellings (A B C & D)
Number
Average Value
Number
Average Value
Number
Average Value
Number
Average Value
Number
Average Value
LOANS ORIGINATED
61
$150,541
950
$157,739
4,141
$162,334
63
$35,907
74
$107,365
APPLICATIONS APPROVED, NOT ACCEPTED
8
$124,486
105
$138,006
554
$171,263
16
$35,319
14
$236,622
APPLICATIONS DENIED
2
$146,235
187
$120,060
568
$171,029
47
$27,331
22
$144,800
APPLICATIONS WITHDRAWN
2
$134,505
67
$192,024
313
$173,151
8
$41,291
10
$217,939
FILES CLOSED FOR INCOMPLETENESS
0
$0
21
$173,097
95
$222,373
0
$0
2
$37,275
Aggregated Statistics For Year 2002 (Based on 6 full tracts)
A) FHA, FSA/RHS & VA Home Purchase Loans
B) Conventional Home Purchase Loans
C) Refinancings
D) Home Improvement Loans
F) Non-occupant Loans on < 5 Family Dwellings (A B C & D)
Number
Average Value
Number
Average Value
Number
Average Value
Number
Average Value
Number
Average Value
LOANS ORIGINATED
41
$150,219
705
$164,659
3,044
$166,076
102
$37,528
39
$129,024
APPLICATIONS APPROVED, NOT ACCEPTED
0
$0
74
$132,168
333
$171,098
10
$30,432
6
$87,747
APPLICATIONS DENIED
0
$0
166
$62,678
383
$163,592
39
$15,846
8
$134,911
APPLICATIONS WITHDRAWN
2
$158,955
57
$173,730
234
$166,521
6
$47,802
8
$118,745
FILES CLOSED FOR INCOMPLETENESS
0
$0
10
$149,868
142
$174,945
0
$0
0
$0
Aggregated Statistics For Year 2001 (Based on 6 full tracts)
A) FHA, FSA/RHS & VA Home Purchase Loans
B) Conventional Home Purchase Loans
C) Refinancings
D) Home Improvement Loans
F) Non-occupant Loans on < 5 Family Dwellings (A B C & D)
Number
Average Value
Number
Average Value
Number
Average Value
Number
Average Value
Number
Average Value
LOANS ORIGINATED
51
$146,986
966
$145,096
2,252
$157,216
138
$37,608
51
$123,004
APPLICATIONS APPROVED, NOT ACCEPTED
0
$0
153
$98,247
264
$157,837
10
$57,960
10
$94,501
APPLICATIONS DENIED
0
$0
294
$55,308
341
$151,831
33
$24,300
10
$62,399
APPLICATIONS WITHDRAWN
4
$118,678
47
$171,755
249
$140,914
4
$34,615
6
$99,188
FILES CLOSED FOR INCOMPLETENESS
2
$158,665
8
$169,322
84
$155,113
4
$14,738
2
$88,020
Aggregated Statistics For Year 2000 (Based on 6 full tracts)
A) FHA, FSA/RHS & VA Home Purchase Loans
B) Conventional Home Purchase Loans
C) Refinancings
D) Home Improvement Loans
E) Loans on Dwellings For 5+ Families
F) Non-occupant Loans on < 5 Family Dwellings (A B C & D)
Number
Average Value
Number
Average Value
Number
Average Value
Number
Average Value
Number
Average Value
Number
Average Value
LOANS ORIGINATED
27
$142,626
1,072
$139,223
416
$140,714
124
$31,130
4
$179,998
43
$101,121
APPLICATIONS APPROVED, NOT ACCEPTED
0
$0
175
$93,911
81
$103,923
25
$48,342
0
$0
2
$7,645
APPLICATIONS DENIED
8
$117,698
401
$58,994
141
$144,146
52
$33,973
0
$0
17
$56,792
APPLICATIONS WITHDRAWN
4
$128,962
61
$165,037
112
$118,816
10
$84,437
0
$0
2
$106,095
FILES CLOSED FOR INCOMPLETENESS
0
$0
16
$199,278
45
$125,659
0
$0
0
$0
0
$0
Aggregated Statistics For Year 1999 (Based on 3 full tracts)
A) FHA, FSA/RHS & VA Home Purchase Loans
B) Conventional Home Purchase Loans
C) Refinancings
D) Home Improvement Loans
F) Non-occupant Loans on < 5 Family Dwellings (A B C & D)
2002 - 2018 National Fire Incident Reporting System (NFIRS) incidents
According to the data from the years 2002 - 2018 the average number of fires per year is 50. The highest number of fires - 66 took place in 2012, and the least - 31 in 2015. The data has a declining trend.
When looking into fire subcategories, the most reports belonged to: Structure Fires (47.8%), and Outside Fires (28.5%).
Fire incident types reported to NFIRS in Zip Code 48314
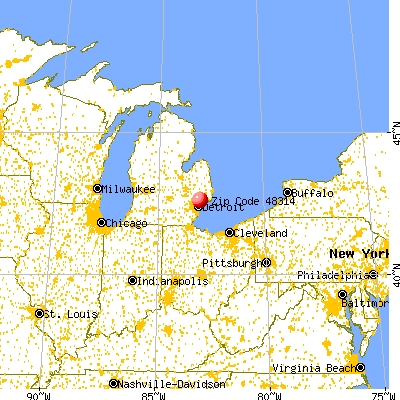


 Nearest zip codes: 48317, 48310, 48313, 48085, 48312, 48316.


 According to the data from the years 2002 - 2018 the average number of fires per year is 50. The highest number of fires - 66 took place in 2012, and the least - 31 in 2015. The data has a declining trend.
 When looking into fire subcategories, the most reports belonged to: Structure Fires (47.8%), and Outside Fires (28.5%).