Estimated zip code population in 2022: 25,656
Zip code population in 2010: 24,960
Zip code population in 2000: 26,443
Houses and condos: 11,986
Renter-occupied apartments: 3,946
% of renters here:
34%State:
27%
March 2022 cost of living index in zip code 48328: 95.7
(near average, U.S. average is 100)
Land area: 9.0
sq. mi.
Water area: 2.6
sq. mi.
Population density: 2,838 people per square mile (average).
OSM Map
General Map
Google Map
MSN Map
OSM Map
General Map
Google Map
MSN Map
OSM Map
General Map
Google Map
MSN Map
OSM Map
General Map
Google Map
MSN Map
Please wait while loading the map...
Real estate property taxes paid for housing units in 2022:
This zip code:
1.1% ($2,434)Michigan:
1.2% ($2,746)
Median real estate property taxes paid for housing units with mortgages in 2022: $2,582 (1.2%)
Median real estate property taxes paid for housing units with no mortgage in 2022: $2,126 (1.0%)
Profiles of local businesses
Business Search - 14 Million verified businesses
Males: 12,978 Females: 12,676
For population 25 years and over in 48328:
High school or higher: 90.2%Bachelor's degree or higher: 27.6%Graduate or professional degree: 8.6%Unemployed: 4.1%Mean travel time to work (commute): 24.5 minutes
For population 15 years and over in 48328:
Never married: 35.6%Now married: 42.2%Separated: 1.0%Widowed: 6.1%Divorced: 15.1%
Zip code 48328 compared to state average:
Hispanic race population percentage above state average. Length of stay since moving in above state average. 18,507 72.1% White 2,954 11.5% Hispanic or Latino 2,406 9.4% Black 1,175 4.6% Two or more races 486 1.9% Asian 50 0.2% American Indian 61 0.2% Some other race 12 0.05% Native Hawaiian and Other
Data:
Median household income ($)
Median household income (% change since 2000)
Household income diversity
Ratio of average income to average house value (%)
Ratio of average income to average rent
Median household income ($) - White
Median household income ($) - Black or African American
Median household income ($) - Asian
Median household income ($) - Hispanic or Latino
Median household income ($) - American Indian and Alaska Native
Median household income ($) - Multirace
Median household income ($) - Other Race
Median household income for houses/condos with a mortgage ($)
Median household income for apartments without a mortgage ($)
Races - White alone (%)
Races - White alone (% change since 2000)
Races - Black alone (%)
Races - Black alone (% change since 2000)
Races - American Indian alone (%)
Races - American Indian alone (% change since 2000)
Races - Asian alone (%)
Races - Asian alone (% change since 2000)
Races - Hispanic (%)
Races - Hispanic (% change since 2000)
Races - Native Hawaiian and Other Pacific Islander alone (%)
Races - Native Hawaiian and Other Pacific Islander alone (% change since 2000)
Races - Two or more races (%)
Races - Two or more races (% change since 2000)
Races - Other race alone (%)
Races - Other race alone (% change since 2000)
Racial diversity
Unemployment (%)
Unemployment (% change since 2000)
Unemployment (%) - White
Unemployment (%) - Black or African American
Unemployment (%) - Asian
Unemployment (%) - Hispanic or Latino
Unemployment (%) - American Indian and Alaska Native
Unemployment (%) - Multirace
Unemployment (%) - Other Race
Population density (people per square mile)
Population - Males (%)
Population - Females (%)
Population - Males (%) - White
Population - Males (%) - Black or African American
Population - Males (%) - Asian
Population - Males (%) - Hispanic or Latino
Population - Males (%) - American Indian and Alaska Native
Population - Males (%) - Multirace
Population - Males (%) - Other Race
Population - Females (%) - White
Population - Females (%) - Black or African American
Population - Females (%) - Asian
Population - Females (%) - Hispanic or Latino
Population - Females (%) - American Indian and Alaska Native
Population - Females (%) - Multirace
Population - Females (%) - Other Race
Coronavirus confirmed cases (May 14, 2024)
Deaths caused by coronavirus (May 14, 2024)
Coronavirus confirmed cases (per 100k population) (May 14, 2024)
Deaths caused by coronavirus (per 100k population) (May 14, 2024)
Daily increase in number of cases (May 14, 2024)
Weekly increase in number of cases (May 14, 2024)
Cases doubled (in days) (May 14, 2024)
Hospitalized patients (Apr 18, 2022)
Negative test results (Apr 18, 2022)
Total test results (Apr 18, 2022)
COVID Vaccine doses distributed (per 100k population) (Sep 19, 2023)
COVID Vaccine doses administered (per 100k population) (Sep 19, 2023)
COVID Vaccine doses distributed (Sep 19, 2023)
COVID Vaccine doses administered (Sep 19, 2023)
Likely homosexual households (%)
Likely homosexual households (% change since 2000)
Likely homosexual households - Lesbian couples (%)
Likely homosexual households - Lesbian couples (% change since 2000)
Likely homosexual households - Gay men (%)
Likely homosexual households - Gay men (% change since 2000)
Cost of living index
Median gross rent ($)
Median contract rent ($)
Median monthly housing costs ($)
Median house or condo value ($)
Median house or condo value ($ change since 2000)
Mean house or condo value by units in structure - 1, detached ($)
Mean house or condo value by units in structure - 1, attached ($)
Mean house or condo value by units in structure - 2 ($)
Mean house or condo value by units in structure by units in structure - 3 or 4 ($)
Mean house or condo value by units in structure - 5 or more ($)
Mean house or condo value by units in structure - Boat, RV, van, etc. ($)
Mean house or condo value by units in structure - Mobile home ($)
Median house or condo value ($) - White
Median house or condo value ($) - Black or African American
Median house or condo value ($) - Asian
Median house or condo value ($) - Hispanic or Latino
Median house or condo value ($) - American Indian and Alaska Native
Median house or condo value ($) - Multirace
Median house or condo value ($) - Other Race
Median resident age
Resident age diversity
Median resident age - Males
Median resident age - Females
Median resident age - White
Median resident age - Black or African American
Median resident age - Asian
Median resident age - Hispanic or Latino
Median resident age - American Indian and Alaska Native
Median resident age - Multirace
Median resident age - Other Race
Median resident age - Males - White
Median resident age - Males - Black or African American
Median resident age - Males - Asian
Median resident age - Males - Hispanic or Latino
Median resident age - Males - American Indian and Alaska Native
Median resident age - Males - Multirace
Median resident age - Males - Other Race
Median resident age - Females - White
Median resident age - Females - Black or African American
Median resident age - Females - Asian
Median resident age - Females - Hispanic or Latino
Median resident age - Females - American Indian and Alaska Native
Median resident age - Females - Multirace
Median resident age - Females - Other Race
Commute - mean travel time to work (minutes)
Travel time to work - Less than 5 minutes (%)
Travel time to work - Less than 5 minutes (% change since 2000)
Travel time to work - 5 to 9 minutes (%)
Travel time to work - 5 to 9 minutes (% change since 2000)
Travel time to work - 10 to 19 minutes (%)
Travel time to work - 10 to 19 minutes (% change since 2000)
Travel time to work - 20 to 29 minutes (%)
Travel time to work - 20 to 29 minutes (% change since 2000)
Travel time to work - 30 to 39 minutes (%)
Travel time to work - 30 to 39 minutes (% change since 2000)
Travel time to work - 40 to 59 minutes (%)
Travel time to work - 40 to 59 minutes (% change since 2000)
Travel time to work - 60 to 89 minutes (%)
Travel time to work - 60 to 89 minutes (% change since 2000)
Travel time to work - 90 or more minutes (%)
Travel time to work - 90 or more minutes (% change since 2000)
Marital status - Never married (%)
Marital status - Now married (%)
Marital status - Separated (%)
Marital status - Widowed (%)
Marital status - Divorced (%)
Median family income ($)
Median family income (% change since 2000)
Median non-family income ($)
Median non-family income (% change since 2000)
Median per capita income ($)
Median per capita income (% change since 2000)
Median family income ($) - White
Median family income ($) - Black or African American
Median family income ($) - Asian
Median family income ($) - Hispanic or Latino
Median family income ($) - American Indian and Alaska Native
Median family income ($) - Multirace
Median family income ($) - Other Race
Median year house/condo built
Median year apartment built
Year house built - Built 2005 or later (%)
Year house built - Built 2000 to 2004 (%)
Year house built - Built 1990 to 1999 (%)
Year house built - Built 1980 to 1989 (%)
Year house built - Built 1970 to 1979 (%)
Year house built - Built 1960 to 1969 (%)
Year house built - Built 1950 to 1959 (%)
Year house built - Built 1940 to 1949 (%)
Year house built - Built 1939 or earlier (%)
Average household size
Household density (households per square mile)
Average household size - White
Average household size - Black or African American
Average household size - Asian
Average household size - Hispanic or Latino
Average household size - American Indian and Alaska Native
Average household size - Multirace
Average household size - Other Race
Occupied housing units (%)
Vacant housing units (%)
Owner occupied housing units (%)
Renter occupied housing units (%)
Vacancy status - For rent (%)
Vacancy status - For sale only (%)
Vacancy status - Rented or sold, not occupied (%)
Vacancy status - For seasonal, recreational, or occasional use (%)
Vacancy status - For migrant workers (%)
Vacancy status - Other vacant (%)
Residents with income below the poverty level (%)
Residents with income below 50% of the poverty level (%)
Children below poverty level (%)
Poor families by family type - Married-couple family (%)
Poor families by family type - Male, no wife present (%)
Poor families by family type - Female, no husband present (%)
Poverty status for native-born residents (%)
Poverty status for foreign-born residents (%)
Poverty among high school graduates not in families (%)
Poverty among people who did not graduate high school not in families (%)
Residents with income below the poverty level (%) - White
Residents with income below the poverty level (%) - Black or African American
Residents with income below the poverty level (%) - Asian
Residents with income below the poverty level (%) - Hispanic or Latino
Residents with income below the poverty level (%) - American Indian and Alaska Native
Residents with income below the poverty level (%) - Multirace
Residents with income below the poverty level (%) - Other Race
Air pollution - Air Quality Index (AQI)
Air pollution - CO
Air pollution - NO2
Air pollution - SO2
Air pollution - Ozone
Air pollution - PM10
Air pollution - PM25
Air pollution - Pb
Crime - Murders per 100,000 population
Crime - Rapes per 100,000 population
Crime - Robberies per 100,000 population
Crime - Assaults per 100,000 population
Crime - Burglaries per 100,000 population
Crime - Thefts per 100,000 population
Crime - Auto thefts per 100,000 population
Crime - Arson per 100,000 population
Crime - City-data.com crime index
Crime - Violent crime index
Crime - Property crime index
Crime - Murders per 100,000 population (5 year average)
Crime - Rapes per 100,000 population (5 year average)
Crime - Robberies per 100,000 population (5 year average)
Crime - Assaults per 100,000 population (5 year average)
Crime - Burglaries per 100,000 population (5 year average)
Crime - Thefts per 100,000 population (5 year average)
Crime - Auto thefts per 100,000 population (5 year average)
Crime - Arson per 100,000 population (5 year average)
Crime - City-data.com crime index (5 year average)
Crime - Violent crime index (5 year average)
Crime - Property crime index (5 year average)
1996 Presidential Elections Results (%) - Democratic Party (Clinton)
1996 Presidential Elections Results (%) - Republican Party (Dole)
1996 Presidential Elections Results (%) - Other
2000 Presidential Elections Results (%) - Democratic Party (Gore)
2000 Presidential Elections Results (%) - Republican Party (Bush)
2000 Presidential Elections Results (%) - Other
2004 Presidential Elections Results (%) - Democratic Party (Kerry)
2004 Presidential Elections Results (%) - Republican Party (Bush)
2004 Presidential Elections Results (%) - Other
2008 Presidential Elections Results (%) - Democratic Party (Obama)
2008 Presidential Elections Results (%) - Republican Party (McCain)
2008 Presidential Elections Results (%) - Other
2012 Presidential Elections Results (%) - Democratic Party (Obama)
2012 Presidential Elections Results (%) - Republican Party (Romney)
2012 Presidential Elections Results (%) - Other
2016 Presidential Elections Results (%) - Democratic Party (Clinton)
2016 Presidential Elections Results (%) - Republican Party (Trump)
2016 Presidential Elections Results (%) - Other
2020 Presidential Elections Results (%) - Democratic Party (Biden)
2020 Presidential Elections Results (%) - Republican Party (Trump)
2020 Presidential Elections Results (%) - Other
Ancestries Reported - Arab (%)
Ancestries Reported - Czech (%)
Ancestries Reported - Danish (%)
Ancestries Reported - Dutch (%)
Ancestries Reported - English (%)
Ancestries Reported - French (%)
Ancestries Reported - French Canadian (%)
Ancestries Reported - German (%)
Ancestries Reported - Greek (%)
Ancestries Reported - Hungarian (%)
Ancestries Reported - Irish (%)
Ancestries Reported - Italian (%)
Ancestries Reported - Lithuanian (%)
Ancestries Reported - Norwegian (%)
Ancestries Reported - Polish (%)
Ancestries Reported - Portuguese (%)
Ancestries Reported - Russian (%)
Ancestries Reported - Scotch-Irish (%)
Ancestries Reported - Scottish (%)
Ancestries Reported - Slovak (%)
Ancestries Reported - Subsaharan African (%)
Ancestries Reported - Swedish (%)
Ancestries Reported - Swiss (%)
Ancestries Reported - Ukrainian (%)
Ancestries Reported - United States (%)
Ancestries Reported - Welsh (%)
Ancestries Reported - West Indian (%)
Ancestries Reported - Other (%)
Educational Attainment - No schooling completed (%)
Educational Attainment - Less than high school (%)
Educational Attainment - High school or equivalent (%)
Educational Attainment - Less than 1 year of college (%)
Educational Attainment - 1 or more years of college (%)
Educational Attainment - Associate degree (%)
Educational Attainment - Bachelor's degree (%)
Educational Attainment - Master's degree (%)
Educational Attainment - Professional school degree (%)
Educational Attainment - Doctorate degree (%)
School Enrollment - Nursery, preschool (%)
School Enrollment - Kindergarten (%)
School Enrollment - Grade 1 to 4 (%)
School Enrollment - Grade 5 to 8 (%)
School Enrollment - Grade 9 to 12 (%)
School Enrollment - College undergrad (%)
School Enrollment - Graduate or professional (%)
School Enrollment - Not enrolled in school (%)
School enrollment - Public schools (%)
School enrollment - Private schools (%)
School enrollment - Not enrolled (%)
Median number of rooms in houses and condos
Median number of rooms in apartments
Housing units lacking complete plumbing facilities (%)
Housing units lacking complete kitchen facilities (%)
Density of houses
Urban houses (%)
Rural houses (%)
Households with people 60 years and over (%)
Households with people 65 years and over (%)
Households with people 75 years and over (%)
Households with one or more nonrelatives (%)
Households with no nonrelatives (%)
Population in households (%)
Family households (%)
Nonfamily households (%)
Population in families (%)
Family households with own children (%)
Median number of bedrooms in owner occupied houses
Mean number of bedrooms in owner occupied houses
Median number of bedrooms in renter occupied houses
Mean number of bedrooms in renter occupied houses
Median number of vehichles in owner occupied houses
Mean number of vehichles in owner occupied houses
Median number of vehichles in renter occupied houses
Mean number of vehichles in renter occupied houses
Mortgage status - with mortgage (%)
Mortgage status - with second mortgage (%)
Mortgage status - with home equity loan (%)
Mortgage status - with both second mortgage and home equity loan (%)
Mortgage status - without a mortgage (%)
Average family size
Average family size - White
Average family size - Black or African American
Average family size - Asian
Average family size - Hispanic or Latino
Average family size - American Indian and Alaska Native
Average family size - Multirace
Average family size - Other Race
Geographical mobility - Same house 1 year ago (%)
Geographical mobility - Moved within same county (%)
Geographical mobility - Moved from different county within same state (%)
Geographical mobility - Moved from different state (%)
Geographical mobility - Moved from abroad (%)
Place of birth - Born in state of residence (%)
Place of birth - Born in other state (%)
Place of birth - Native, outside of US (%)
Place of birth - Foreign born (%)
Housing units in structures - 1, detached (%)
Housing units in structures - 1, attached (%)
Housing units in structures - 2 (%)
Housing units in structures - 3 or 4 (%)
Housing units in structures - 5 to 9 (%)
Housing units in structures - 10 to 19 (%)
Housing units in structures - 20 to 49 (%)
Housing units in structures - 50 or more (%)
Housing units in structures - Mobile home (%)
Housing units in structures - Boat, RV, van, etc. (%)
House/condo owner moved in on average (years ago)
Renter moved in on average (years ago)
Year householder moved into unit - Moved in 1999 to March 2000 (%)
Year householder moved into unit - Moved in 1995 to 1998 (%)
Year householder moved into unit - Moved in 1990 to 1994 (%)
Year householder moved into unit - Moved in 1980 to 1989 (%)
Year householder moved into unit - Moved in 1970 to 1979 (%)
Year householder moved into unit - Moved in 1969 or earlier (%)
Means of transportation to work - Drove car alone (%)
Means of transportation to work - Carpooled (%)
Means of transportation to work - Public transportation (%)
Means of transportation to work - Bus or trolley bus (%)
Means of transportation to work - Streetcar or trolley car (%)
Means of transportation to work - Subway or elevated (%)
Means of transportation to work - Railroad (%)
Means of transportation to work - Ferryboat (%)
Means of transportation to work - Taxicab (%)
Means of transportation to work - Motorcycle (%)
Means of transportation to work - Bicycle (%)
Means of transportation to work - Walked (%)
Means of transportation to work - Other means (%)
Working at home (%)
Industry diversity
Most Common Industries - Agriculture, forestry, fishing and hunting, and mining (%)
Most Common Industries - Agriculture, forestry, fishing and hunting (%)
Most Common Industries - Mining, quarrying, and oil and gas extraction (%)
Most Common Industries - Construction (%)
Most Common Industries - Manufacturing (%)
Most Common Industries - Wholesale trade (%)
Most Common Industries - Retail trade (%)
Most Common Industries - Transportation and warehousing, and utilities (%)
Most Common Industries - Transportation and warehousing (%)
Most Common Industries - Utilities (%)
Most Common Industries - Information (%)
Most Common Industries - Finance and insurance, and real estate and rental and leasing (%)
Most Common Industries - Finance and insurance (%)
Most Common Industries - Real estate and rental and leasing (%)
Most Common Industries - Professional, scientific, and management, and administrative and waste management services (%)
Most Common Industries - Professional, scientific, and technical services (%)
Most Common Industries - Management of companies and enterprises (%)
Most Common Industries - Administrative and support and waste management services (%)
Most Common Industries - Educational services, and health care and social assistance (%)
Most Common Industries - Educational services (%)
Most Common Industries - Health care and social assistance (%)
Most Common Industries - Arts, entertainment, and recreation, and accommodation and food services (%)
Most Common Industries - Arts, entertainment, and recreation (%)
Most Common Industries - Accommodation and food services (%)
Most Common Industries - Other services, except public administration (%)
Most Common Industries - Public administration (%)
Occupation diversity
Most Common Occupations - Management, business, science, and arts occupations (%)
Most Common Occupations - Management, business, and financial occupations (%)
Most Common Occupations - Management occupations (%)
Most Common Occupations - Business and financial operations occupations (%)
Most Common Occupations - Computer, engineering, and science occupations (%)
Most Common Occupations - Computer and mathematical occupations (%)
Most Common Occupations - Architecture and engineering occupations (%)
Most Common Occupations - Life, physical, and social science occupations (%)
Most Common Occupations - Education, legal, community service, arts, and media occupations (%)
Most Common Occupations - Community and social service occupations (%)
Most Common Occupations - Legal occupations (%)
Most Common Occupations - Education, training, and library occupations (%)
Most Common Occupations - Arts, design, entertainment, sports, and media occupations (%)
Most Common Occupations - Healthcare practitioners and technical occupations (%)
Most Common Occupations - Health diagnosing and treating practitioners and other technical occupations (%)
Most Common Occupations - Health technologists and technicians (%)
Most Common Occupations - Service occupations (%)
Most Common Occupations - Healthcare support occupations (%)
Most Common Occupations - Protective service occupations (%)
Most Common Occupations - Fire fighting and prevention, and other protective service workers including supervisors (%)
Most Common Occupations - Law enforcement workers including supervisors (%)
Most Common Occupations - Food preparation and serving related occupations (%)
Most Common Occupations - Building and grounds cleaning and maintenance occupations (%)
Most Common Occupations - Personal care and service occupations (%)
Most Common Occupations - Sales and office occupations (%)
Most Common Occupations - Sales and related occupations (%)
Most Common Occupations - Office and administrative support occupations (%)
Most Common Occupations - Natural resources, construction, and maintenance occupations (%)
Most Common Occupations - Farming, fishing, and forestry occupations (%)
Most Common Occupations - Construction and extraction occupations (%)
Most Common Occupations - Installation, maintenance, and repair occupations (%)
Most Common Occupations - Production, transportation, and material moving occupations (%)
Most Common Occupations - Production occupations (%)
Most Common Occupations - Transportation occupations (%)
Most Common Occupations - Material moving occupations (%)
People in Group quarters - Institutionalized population (%)
People in Group quarters - Correctional institutions (%)
People in Group quarters - Federal prisons and detention centers (%)
People in Group quarters - Halfway houses (%)
People in Group quarters - Local jails and other confinement facilities (including police lockups) (%)
People in Group quarters - Military disciplinary barracks (%)
People in Group quarters - State prisons (%)
People in Group quarters - Other types of correctional institutions (%)
People in Group quarters - Nursing homes (%)
People in Group quarters - Hospitals/wards, hospices, and schools for the handicapped (%)
People in Group quarters - Hospitals/wards and hospices for chronically ill (%)
People in Group quarters - Hospices or homes for chronically ill (%)
People in Group quarters - Military hospitals or wards for chronically ill (%)
People in Group quarters - Other hospitals or wards for chronically ill (%)
People in Group quarters - Hospitals or wards for drug/alcohol abuse (%)
People in Group quarters - Mental (Psychiatric) hospitals or wards (%)
People in Group quarters - Schools, hospitals, or wards for the mentally retarded (%)
People in Group quarters - Schools, hospitals, or wards for the physically handicapped (%)
People in Group quarters - Institutions for the deaf (%)
People in Group quarters - Institutions for the blind (%)
People in Group quarters - Orthopedic wards and institutions for the physically handicapped (%)
People in Group quarters - Wards in general hospitals for patients who have no usual home elsewhere (%)
People in Group quarters - Wards in military hospitals for patients who have no usual home elsewhere (%)
People in Group quarters - Juvenile institutions (%)
People in Group quarters - Long-term care (%)
People in Group quarters - Homes for abused, dependent, and neglected children (%)
People in Group quarters - Residential treatment centers for emotionally disturbed children (%)
People in Group quarters - Training schools for juvenile delinquents (%)
People in Group quarters - Short-term care, detention or diagnostic centers for delinquent children (%)
People in Group quarters - Type of juvenile institution unknown (%)
People in Group quarters - Noninstitutionalized population (%)
People in Group quarters - College dormitories (includes college quarters off campus) (%)
People in Group quarters - Military quarters (%)
People in Group quarters - On base (%)
People in Group quarters - Barracks, unaccompanied personnel housing (UPH), (Enlisted/Officer), ;and similar group living quarters for military personnel (%)
People in Group quarters - Transient quarters for temporary residents (%)
People in Group quarters - Military ships (%)
People in Group quarters - Group homes (%)
People in Group quarters - Homes or halfway houses for drug/alcohol abuse (%)
People in Group quarters - Homes for the mentally ill (%)
People in Group quarters - Homes for the mentally retarded (%)
People in Group quarters - Homes for the physically handicapped (%)
People in Group quarters - Other group homes (%)
People in Group quarters - Religious group quarters (%)
People in Group quarters - Dormitories (%)
People in Group quarters - Agriculture workers' dormitories on farms (%)
People in Group quarters - Job Corps and vocational training facilities (%)
People in Group quarters - Other workers' dormitories (%)
People in Group quarters - Crews of maritime vessels (%)
People in Group quarters - Other nonhousehold living situations (%)
People in Group quarters - Other noninstitutional group quarters (%)
Residents speaking English at home (%)
Residents speaking English at home - Born in the United States (%)
Residents speaking English at home - Native, born elsewhere (%)
Residents speaking English at home - Foreign born (%)
Residents speaking Spanish at home (%)
Residents speaking Spanish at home - Born in the United States (%)
Residents speaking Spanish at home - Native, born elsewhere (%)
Residents speaking Spanish at home - Foreign born (%)
Residents speaking other language at home (%)
Residents speaking other language at home - Born in the United States (%)
Residents speaking other language at home - Native, born elsewhere (%)
Residents speaking other language at home - Foreign born (%)
Class of Workers - Employee of private company (%)
Class of Workers - Self-employed in own incorporated business (%)
Class of Workers - Private not-for-profit wage and salary workers (%)
Class of Workers - Local government workers (%)
Class of Workers - State government workers (%)
Class of Workers - Federal government workers (%)
Class of Workers - Self-employed workers in own not incorporated business and Unpaid family workers (%)
House heating fuel used in houses and condos - Utility gas (%)
House heating fuel used in houses and condos - Bottled, tank, or LP gas (%)
House heating fuel used in houses and condos - Electricity (%)
House heating fuel used in houses and condos - Fuel oil, kerosene, etc. (%)
House heating fuel used in houses and condos - Coal or coke (%)
House heating fuel used in houses and condos - Wood (%)
House heating fuel used in houses and condos - Solar energy (%)
House heating fuel used in houses and condos - Other fuel (%)
House heating fuel used in houses and condos - No fuel used (%)
House heating fuel used in apartments - Utility gas (%)
House heating fuel used in apartments - Bottled, tank, or LP gas (%)
House heating fuel used in apartments - Electricity (%)
House heating fuel used in apartments - Fuel oil, kerosene, etc. (%)
House heating fuel used in apartments - Coal or coke (%)
House heating fuel used in apartments - Wood (%)
House heating fuel used in apartments - Solar energy (%)
House heating fuel used in apartments - Other fuel (%)
House heating fuel used in apartments - No fuel used (%)
Armed forces status - In Armed Forces (%)
Armed forces status - Civilian (%)
Armed forces status - Civilian - Veteran (%)
Armed forces status - Civilian - Nonveteran (%)
Fatal accidents locations in years 2005-2021
Fatal accidents locations in 2005
Fatal accidents locations in 2006
Fatal accidents locations in 2007
Fatal accidents locations in 2008
Fatal accidents locations in 2009
Fatal accidents locations in 2010
Fatal accidents locations in 2011
Fatal accidents locations in 2012
Fatal accidents locations in 2013
Fatal accidents locations in 2014
Fatal accidents locations in 2015
Fatal accidents locations in 2016
Fatal accidents locations in 2017
Fatal accidents locations in 2018
Fatal accidents locations in 2019
Fatal accidents locations in 2020
Fatal accidents locations in 2021
Alcohol use - People drinking some alcohol every month (%)
Alcohol use - People not drinking at all (%)
Alcohol use - Average days/month drinking alcohol
Alcohol use - Average drinks/week
Alcohol use - Average days/year people drink much
Audiometry - Average condition of hearing (%)
Audiometry - People that can hear a whisper from across a quiet room (%)
Audiometry - People that can hear normal voice from across a quiet room (%)
Audiometry - Ears ringing, roaring, buzzing (%)
Audiometry - Had a job exposure to loud noise (%)
Audiometry - Had off-work exposure to loud noise (%)
Blood Pressure & Cholesterol - Has high blood pressure (%)
Blood Pressure & Cholesterol - Checking blood pressure at home (%)
Blood Pressure & Cholesterol - Frequently checking blood cholesterol (%)
Blood Pressure & Cholesterol - Has high cholesterol level (%)
Consumer Behavior - Money monthly spent on food at supermarket/grocery store
Consumer Behavior - Money monthly spent on food at other stores
Consumer Behavior - Money monthly spent on eating out
Consumer Behavior - Money monthly spent on carryout/delivered foods
Consumer Behavior - Income spent on food at supermarket/grocery store (%)
Consumer Behavior - Income spent on food at other stores (%)
Consumer Behavior - Income spent on eating out (%)
Consumer Behavior - Income spent on carryout/delivered foods (%)
Current Health Status - General health condition (%)
Current Health Status - Blood donors (%)
Current Health Status - Has blood ever tested for HIV virus (%)
Current Health Status - Left-handed people (%)
Dermatology - People using sunscreen (%)
Diabetes - Diabetics (%)
Diabetes - Had a blood test for high blood sugar (%)
Diabetes - People taking insulin (%)
Diet Behavior & Nutrition - Diet health (%)
Diet Behavior & Nutrition - Milk product consumption (# of products/month)
Diet Behavior & Nutrition - Meals not home prepared (#/week)
Diet Behavior & Nutrition - Meals from fast food or pizza place (#/week)
Diet Behavior & Nutrition - Ready-to-eat foods (#/month)
Diet Behavior & Nutrition - Frozen meals/pizza (#/month)
Drug Use - People that ever used marijuana or hashish (%)
Drug Use - Ever used hard drugs (%)
Drug Use - Ever used any form of cocaine (%)
Drug Use - Ever used heroin (%)
Drug Use - Ever used methamphetamine (%)
Health Insurance - People covered by health insurance (%)
Kidney Conditions-Urology - Avg. # of times urinating at night
Medical Conditions - People with asthma (%)
Medical Conditions - People with anemia (%)
Medical Conditions - People with psoriasis (%)
Medical Conditions - People with overweight (%)
Medical Conditions - Elderly people having difficulties in thinking or remembering (%)
Medical Conditions - People who ever received blood transfusion (%)
Medical Conditions - People having trouble seeing even with glass/contacts (%)
Medical Conditions - People with arthritis (%)
Medical Conditions - People with gout (%)
Medical Conditions - People with congestive heart failure (%)
Medical Conditions - People with coronary heart disease (%)
Medical Conditions - People with angina pectoris (%)
Medical Conditions - People who ever had heart attack (%)
Medical Conditions - People who ever had stroke (%)
Medical Conditions - People with emphysema (%)
Medical Conditions - People with thyroid problem (%)
Medical Conditions - People with chronic bronchitis (%)
Medical Conditions - People with any liver condition (%)
Medical Conditions - People who ever had cancer or malignancy (%)
Mental Health - People who have little interest in doing things (%)
Mental Health - People feeling down, depressed, or hopeless (%)
Mental Health - People who have trouble sleeping or sleeping too much (%)
Mental Health - People feeling tired or having little energy (%)
Mental Health - People with poor appetite or overeating (%)
Mental Health - People feeling bad about themself (%)
Mental Health - People who have trouble concentrating on things (%)
Mental Health - People moving or speaking slowly or too fast (%)
Mental Health - People having thoughts they would be better off dead (%)
Oral Health - Average years since last visit a dentist
Oral Health - People embarrassed because of mouth (%)
Oral Health - People with gum disease (%)
Oral Health - General health of teeth and gums (%)
Oral Health - Average days a week using dental floss/device
Oral Health - Average days a week using mouthwash for dental problem
Oral Health - Average number of teeth
Pesticide Use - Households using pesticides to control insects (%)
Pesticide Use - Households using pesticides to kill weeds (%)
Physical Activity - People doing vigorous-intensity work activities (%)
Physical Activity - People doing moderate-intensity work activities (%)
Physical Activity - People walking or bicycling (%)
Physical Activity - People doing vigorous-intensity recreational activities (%)
Physical Activity - People doing moderate-intensity recreational activities (%)
Physical Activity - Average hours a day doing sedentary activities
Physical Activity - Average hours a day watching TV or videos
Physical Activity - Average hours a day using computer
Physical Functioning - People having limitations keeping them from working (%)
Physical Functioning - People limited in amount of work they can do (%)
Physical Functioning - People that need special equipment to walk (%)
Physical Functioning - People experiencing confusion/memory problems (%)
Physical Functioning - People requiring special healthcare equipment (%)
Prescription Medications - Average number of prescription medicines taking
Preventive Aspirin Use - Adults 40+ taking low-dose aspirin (%)
Reproductive Health - Vaginal deliveries (%)
Reproductive Health - Cesarean deliveries (%)
Reproductive Health - Deliveries resulted in a live birth (%)
Reproductive Health - Pregnancies resulted in a delivery (%)
Reproductive Health - Women breastfeeding newborns (%)
Reproductive Health - Women that had a hysterectomy (%)
Reproductive Health - Women that had both ovaries removed (%)
Reproductive Health - Women that have ever taken birth control pills (%)
Reproductive Health - Women taking birth control pills (%)
Reproductive Health - Women that have ever used Depo-Provera or injectables (%)
Reproductive Health - Women that have ever used female hormones (%)
Sexual Behavior - People 18+ that ever had sex (vaginal, anal, or oral) (%)
Sexual Behavior - Males 18+ that ever had vaginal sex with a woman (%)
Sexual Behavior - Males 18+ that ever performed oral sex on a woman (%)
Sexual Behavior - Males 18+ that ever had anal sex with a woman (%)
Sexual Behavior - Males 18+ that ever had any sex with a man (%)
Sexual Behavior - Females 18+ that ever had vaginal sex with a man (%)
Sexual Behavior - Females 18+ that ever performed oral sex on a man (%)
Sexual Behavior - Females 18+ that ever had anal sex with a man (%)
Sexual Behavior - Females 18+ that ever had any kind of sex with a woman (%)
Sexual Behavior - Average age people first had sex
Sexual Behavior - Average number of female sex partners in lifetime (males 18+)
Sexual Behavior - Average number of female vaginal sex partners in lifetime (males 18+)
Sexual Behavior - Average age people first performed oral sex on a woman (18+)
Sexual Behavior - Average number of woman performed oral sex on in lifetime (18+)
Sexual Behavior - Average number of male sex partners in lifetime (males 18+)
Sexual Behavior - Average number of male anal sex partners in lifetime (males 18+)
Sexual Behavior - Average age people first performed oral sex on a man (18+)
Sexual Behavior - Average number of male oral sex partners in lifetime (18+)
Sexual Behavior - People using protection when performing oral sex (%)
Sexual Behavior - Average number of times people have vaginal or anal sex a year
Sexual Behavior - People having sex without condom (%)
Sexual Behavior - Average number of male sex partners in lifetime (females 18+)
Sexual Behavior - Average number of male vaginal sex partners in lifetime (females 18+)
Sexual Behavior - Average number of female sex partners in lifetime (females 18+)
Sexual Behavior - Circumcised males 18+ (%)
Sleep Disorders - Average hours sleeping at night
Sleep Disorders - People that has trouble sleeping (%)
Smoking-Cigarette Use - People smoking cigarettes (%)
Taste & Smell - People 40+ having problems with smell (%)
Taste & Smell - People 40+ having problems with taste (%)
Taste & Smell - People 40+ that ever had wisdom teeth removed (%)
Taste & Smell - People 40+ that ever had tonsils teeth removed (%)
Taste & Smell - People 40+ that ever had a loss of consciousness because of a head injury (%)
Taste & Smell - People 40+ that ever had a broken nose or other serious injury to face or skull (%)
Taste & Smell - People 40+ that ever had two or more sinus infections (%)
Weight - Average height (inches)
Weight - Average weight (pounds)
Weight - Average BMI
Weight - People that are obese (%)
Weight - People that ever were obese (%)
Weight - People trying to lose weight (%)
100%
urban population.
Estimated median house/condo value in 2022: $220,271
48328:
$220,271Michigan:
$224,400
According to our research of Michigan and other state lists, there were 82 registered sex offenders living in 48328 zip code as of May 14, 2024 . The ratio of all residents to sex offenders in zip code 48328 is 322 to 1.The ratio of registered sex offenders to all residents in this zip code is near the state average.
Median resident age: This zip code:
42.5 yearsMichigan median age:
40.3 years
Average household size: This zip code:
2.2 peopleMichigan:
2.4 people
Averages for the 2020 tax year for zip code 48328, filed in 2021:
Average Adjusted Gross Income (AGI) in 2020: $60,445 (Individual Income Tax Returns) Here:
$60,445State:
$68,945
Salary/wage: $52,456 (reported on 79.2% of returns )Here:
$52,456State:
$57,142
(% of AGI for various income ranges: 1010.4% for AGIs below $25k , 3304.7% for AGIs $25k-50k , 6343.6% for AGIs $50k-75k , 9432.6% for AGIs $75k-100k , 17402.6% for AGIs $100k-200k , 76946.9% for AGIs over 200k ) Taxable interest for individuals: $1,231 (reported on 26.2% of returns )This zip code:
$1,231Michigan:
$1,630
(% of AGI for various income ranges: 12.4% for AGIs below $25k , 14.6% for AGIs $25k-50k , 34.3% for AGIs $50k-75k , 50.5% for AGIs $75k-100k , 113.3% for AGIs $100k-200k , 1184.6% for AGIs over 200k ) Ordinary dividends: $4,689 (reported on 16.5% of returns )(% of AGI for various income ranges: 19.9% for AGIs below $25k , 25.5% for AGIs $25k-50k , 71.3% for AGIs $50k-75k , 126.1% for AGIs $75k-100k , 286.3% for AGIs $100k-200k , 3259.2% for AGIs over 200k ) Net capital gain/loss in AGI: +$11,604 (reported on 15.6% of returns )Here:
+$11,604State:
+$20,064
(% of AGI for various income ranges: 5.2% for AGIs below $25k , 18.7% for AGIs $25k-50k , 72.9% for AGIs $50k-75k , 179.0% for AGIs $75k-100k , 441.4% for AGIs $100k-200k , 12633.8% for AGIs over 200k ) Profit/loss from business: +$11,284 (reported on 14.7% of returns )Here:
+$11,284State:
+$11,172
(% of AGI for various income ranges: 112.4% for AGIs below $25k , 119.0% for AGIs $25k-50k , 154.2% for AGIs $50k-75k , 257.8% for AGIs $75k-100k , 369.2% for AGIs $100k-200k , 5573.8% for AGIs over 200k ) Taxable individual retirement arrangement distribution: $17,306 (reported on 8.5% of returns )48328:
$17,306Michigan:
$19,803
(% of AGI for various income ranges: 51.4% for AGIs below $25k , 83.2% for AGIs $25k-50k , 167.6% for AGIs $50k-75k , 333.9% for AGIs $75k-100k , 752.7% for AGIs $100k-200k , 3036.9% for AGIs over 200k ) Self-employed (Keogh) retirement plans: $28,000 (reported on 0.3% of returns )48328:
$28,000Michigan:
$25,132
(% of AGI for various income ranges: 861.5% for AGIs over 200k ) Total itemized deductions: $29,013 (reported on 6.1% of returns )Here:
$29,013State:
$34,117
(% of AGI for various income ranges: 30.7% for AGIs below $25k , 79.1% for AGIs $25k-50k , 237.5% for AGIs $50k-75k , 400.0% for AGIs $75k-100k , 628.3% for AGIs $100k-200k , 6013.1% for AGIs over 200k ) Charity contributions: $7,198 (reported on 4.6% of returns )(% of AGI for various income ranges: 8.5% for AGIs $25k-50k , 30.2% for AGIs $50k-75k , 57.2% for AGIs $75k-100k , 118.2% for AGIs $100k-200k , 1666.9% for AGIs over 200k ) Taxes paid: $7,331 (reported on 6.0% of returns )(% of AGI for various income ranges: 3.8% for AGIs below $25k , 13.8% for AGIs $25k-50k , 58.6% for AGIs $50k-75k , 114.3% for AGIs $75k-100k , 211.9% for AGIs $100k-200k , 1301.5% for AGIs over 200k ) Earned income credit: $2,037 (reported on 13.4% of returns )(% of AGI for various income ranges: 71.4% for AGIs below $25k , 50.4% for AGIs $25k-50k , 1.2% for AGIs $50k-75k ) Percentage of individuals using paid preparers for their 2020 taxes: 92.5%(% for various income ranges: 90.5% for AGIs below $25k , 93.6% for AGIs $25k-50k , 93.1% for AGIs $50k-75k , 94.2% for AGIs $75k-100k , 92.7% for AGIs $100k-200k , 93.0% for AGIs over 200k )
Averages for the 2012 tax year for zip code 48328, filed in 2013:
Average Adjusted Gross Income (AGI) in 2012: $46,464 (Individual Income Tax Returns) Here:
$46,464State:
$55,609
Salary/wage: $40,950 (reported on 82.9% of returns )Here:
$40,950State:
$46,782
(% of AGI for various income ranges: 71.1% for AGIs below $25k , 77.2% for AGIs $25k-50k , 75.2% for AGIs $50k-75k , 75.9% for AGIs $75k-100k , 77.4% for AGIs $100k-200k , 56.1% for AGIs over 200k ) Taxable interest for individuals: $1,034 (reported on 28.5% of returns )This zip code:
$1,034Michigan:
$1,491
(% of AGI for various income ranges: 0.7% for AGIs below $25k , 0.5% for AGIs $25k-50k , 0.5% for AGIs $50k-75k , 0.5% for AGIs $75k-100k , 0.5% for AGIs $100k-200k , 1.1% for AGIs over 200k ) Ordinary dividends: $3,473 (reported on 17.3% of returns )(% of AGI for various income ranges: 1.3% for AGIs below $25k , 0.9% for AGIs $25k-50k , 1.0% for AGIs $50k-75k , 1.1% for AGIs $75k-100k , 1.2% for AGIs $100k-200k , 2.5% for AGIs over 200k ) Net capital gain/loss in AGI: +$2,908 (reported on 13.8% of returns )Here:
+$2,908State:
+$9,326
(% of AGI for various income ranges: 0.5% for AGIs $75k-100k , 0.8% for AGIs $100k-200k , 4.9% for AGIs over 200k ) Profit/loss from business: +$12,269 (reported on 12.6% of returns )Here:
+$12,269State:
+$11,523
(% of AGI for various income ranges: 6.5% for AGIs below $25k , 2.4% for AGIs $25k-50k , 2.0% for AGIs $50k-75k , 1.9% for AGIs $75k-100k , 2.5% for AGIs $100k-200k , 6.5% for AGIs over 200k ) Taxable individual retirement arrangement distribution: $13,620 (reported on 9.1% of returns )48328:
$13,620Michigan:
$15,298
(% of AGI for various income ranges: 2.2% for AGIs below $25k , 2.1% for AGIs $25k-50k , 2.6% for AGIs $50k-75k , 3.4% for AGIs $75k-100k , 3.3% for AGIs $100k-200k , 2.1% for AGIs over 200k ) Self-employment retirement plans: $15,860 (reported on 0.4% of returns )48328:
$15,860Michigan:
$20,834
Total itemized deductions: $18,259 (20% of AGI, reported on 28.4% of returns )Here:
$18,259State:
$21,628
Here:
20.1% of AGIState:
18.4% of AGI
(% of AGI for various income ranges: 7.7% for AGIs below $25k , 8.6% for AGIs $25k-50k , 11.3% for AGIs $50k-75k , 12.3% for AGIs $75k-100k , 14.0% for AGIs $100k-200k , 11.5% for AGIs over 200k ) Charity contributions: $2,774 (reported on 23.3% of returns )(% of AGI for various income ranges: 0.6% for AGIs below $25k , 1.0% for AGIs $25k-50k , 1.4% for AGIs $50k-75k , 1.7% for AGIs $75k-100k , 1.9% for AGIs $100k-200k , 1.5% for AGIs over 200k ) Taxes paid: $6,456 (reported on 28.3% of returns )(% of AGI for various income ranges: 1.6% for AGIs below $25k , 2.3% for AGIs $25k-50k , 3.5% for AGIs $50k-75k , 4.2% for AGIs $75k-100k , 5.6% for AGIs $100k-200k , 5.9% for AGIs over 200k ) Earned income credit: $2,096 (reported on 18.1% of returns )(% of AGI for various income ranges: 5.5% for AGIs below $25k , 1.0% for AGIs $25k-50k ) Percentage of individuals using paid preparers for their 2012 taxes: 52.8%(% for various income ranges: 48.3% for AGIs below $25k , 51.6% for AGIs $25k-50k , 57.6% for AGIs $50k-75k , 58.9% for AGIs $75k-100k , 61.2% for AGIs $100k-200k , 77.3% for AGIs over 200k )
Averages for the 2004 tax year for zip code 48328, filed in 2005:
Average Adjusted Gross Income (AGI) in 2004: $46,138 (Individual Income Tax Returns) Here:
$46,138State:
$48,204
Salary/wage: $42,494 (reported on 85.6% of returns )Here:
$42,494State:
$42,791
(% of AGI for various income ranges: 109.8% for AGIs below $10k , 68.7% for AGIs $10k-25k , 80.0% for AGIs $25k-50k , 83.8% for AGIs $50k-75k , 86.1% for AGIs $75k-100k , 72.2% for AGIs over 100k ) Taxable interest for individuals: $1,490 (reported on 46.9% of returns )This zip code:
$1,490Michigan:
$1,725
(% of AGI for various income ranges: 9.3% for AGIs below $10k , 2.6% for AGIs $10k-25k , 1.4% for AGIs $25k-50k , 1.0% for AGIs $50k-75k , 0.9% for AGIs $75k-100k , 1.7% for AGIs over 100k ) Taxable dividends: $2,031 (reported on 24.0% of returns )(% of AGI for various income ranges: 4.5% for AGIs below $10k , 1.7% for AGIs $10k-25k , 1.1% for AGIs $25k-50k , 0.8% for AGIs $50k-75k , 0.7% for AGIs $75k-100k , 1.1% for AGIs over 100k ) Net capital gain/loss: +$5,528 (reported on 18.0% of returns )Here:
+$5,528State:
+$8,532
(% of AGI for various income ranges: -2.0% for AGIs below $10k , -0.1% for AGIs $10k-25k , 0.3% for AGIs $25k-50k , 0.7% for AGIs $50k-75k , 0.5% for AGIs $75k-100k , 6.1% for AGIs over 100k ) Profit/loss from business: +$9,959 (reported on 12.8% of returns )Here:
+$9,959State:
+$9,547
(% of AGI for various income ranges: 11.3% for AGIs below $10k , 6.2% for AGIs $10k-25k , 2.0% for AGIs $25k-50k , 1.9% for AGIs $50k-75k , 1.7% for AGIs $75k-100k , 3.2% for AGIs over 100k ) IRA payment deduction: $2,563 (reported on 1.7% of returns )48328:
$2,563Michigan:
$2,875
(% of AGI for various income ranges: 0.2% for AGIs $10k-25k , 0.1% for AGIs $25k-50k , 0.1% for AGIs $50k-75k , 0.1% for AGIs $75k-100k , 0.1% for AGIs over 100k ) Self-employed pension: $11,797 (reported on 0.6% of returns )Here:
$11,797Michigan:
$13,826
(% of AGI for various income ranges: 0.2% for AGIs $10k-25k , 0.1% for AGIs $50k-75k , 0.3% for AGIs over 100k ) Total itemized deductions: $16,885 (22% of AGI, reported on 42.3% of returns )Here:
$16,885State:
$18,509
Here:
22.4% of AGIState:
20.7% of AGI
(% of AGI for various income ranges: 19.1% for AGIs below $10k , 11.9% for AGIs $10k-25k , 15.0% for AGIs $25k-50k , 17.2% for AGIs $50k-75k , 17.0% for AGIs $75k-100k , 14.6% for AGIs over 100k ) Charity contributions deductions: $2,233 (3% of AGI, reported on 36.9% of returns )Here:
2.8% of AGIState:
3.6% of AGI
(% of AGI for various income ranges: 1.0% for AGIs below $10k , 1.1% for AGIs $10k-25k , 1.5% for AGIs $25k-50k , 1.9% for AGIs $50k-75k , 2.1% for AGIs $75k-100k , 2.0% for AGIs over 100k ) Total tax: $6,621 (reported on 79.4% of returns )(% of AGI for various income ranges: 3.4% for AGIs below $10k , 4.4% for AGIs $10k-25k , 7.5% for AGIs $25k-50k , 9.5% for AGIs $50k-75k , 11.0% for AGIs $75k-100k , 17.7% for AGIs over 100k ) Earned income credit: $1,550 (reported on 12.3% of returns )Percentage of individuals using paid preparers for their 2004 taxes: 60.4%(% for various income ranges: 54.7% for AGIs below $10k , 62.2% for AGIs $10k-25k , 60.7% for AGIs $25k-50k , 60.3% for AGIs $50k-75k , 58.7% for AGIs $75k-100k , 67.7% for AGIs over 100k )
Estimated median household income in 2022: This zip code:
$64,230Michigan:
$66,986
Nearest zip codes: 48320 ,
48329 ,
48327 ,
48324 ,
48341 ,
48340 .
Orchard Lake Village Zip Code Map
Percentage of family households: This zip code:
40.0%Michigan:
43.3%
Percentage of households with unmarried partners: This zip code:
9.3%Michigan:
45.7%
Likely homosexual households (counted as self-reported same-sex unmarried-partner households)
Lesbian couples: 0.2% of all households Gay men: 0.2% of all households
Household received Food Stamps/SNAP in the past 12 months: 1,597Household did not receive Food Stamps/SNAP in the past 12 months: 9,981
Women who had a birth in the past 12 months: 286 (154 now married , 129 unmarried) Women who did not have a birth in the past 12 months: 5,250 (1,838 now married , 3,416 unmarried)
Housing units in zip code 48328 with a mortgage: 5,086 (575
second mortgage , 566
both second mortgage and home equity loan )
Houses without a mortgage: 156
Median monthly owner costs for units with a mortgage: $1,360
Median monthly owner costs for units without a mortgage: $590
Residents with income below the poverty level in 2022:
This zip code:
11.8%Whole state:
13.4%
Residents with income below 50% of the poverty level in 2022:
This zip code:
6.7%Whole state:
6.9%
Median number of rooms in houses and condos: Median number of rooms in apartments: Notable locations in this zip code not listed on our city pages
Click to draw/clear zip code borders Notable locations in zip code 48328: (A) , Waterford Township Fire Department Station 3 (B) . Display/hide their locations on the map
Shopping Centers: (1) , Summit Place Shopping Center (2) , Summit Place North Shopping Center (3) , Summit Place Mall Shopping Center (4) , Summit Crossing Shopping Center (5) , Waterford Town Square Shopping Center (6) , Waterford Corners Shopping Center (7) . Display/hide their locations on the map
Church in zip code 48328: (A) . Display/hide its location on the map
Lakes: (A) , Hess Lake (B) , Geneva Lake (C) , Otter Lake (D) , Fiddle Lake (E) , Elizabeth Lake (F) , Scott Lake (G) . Display/hide their locations on the map
Parks in zip code 48328 include: (1) , Dodge Brothers State Park Number 2 (2) . Display/hide their locations on the map
Year house built (houses)
0 2020 or later206 2010 to 2019652 2000 to 20091,356 1990 to 19991,244 1980 to 19892,493 1970 to 19791,858 1960 to 19691,903 1950 to 1959949 1940 to 19491,105 1939 or earlier
Zip code 48328 household income distribution in 2022 514 Less than $10,000476 $10,000 to $14,999406 $15,000 to $19,999496 $20,000 to $24,999449 $25,000 to $29,999689 $30,000 to $34,999587 $35,000 to $39,999623 $40,000 to $44,999441 $45,000 to $49,999802 $50,000 to $59,9991,336 $60,000 to $74,9991,420 $75,000 to $99,9991,157 $100,000 to $124,999598 $125,000 to $149,999622 $150,000 to $199,999972 $200,000 or moreEstimate of home value of owner-occupied houses/condos in 2022 in zip code 48328 64 Less than $10,00016 $10,000 to $14,99960 $15,000 to $19,99919 $20,000 to $24,99920 $25,000 to $29,99919 $30,000 to $34,99946 $40,000 to $49,99984 $50,000 to $59,999119 $60,000 to $69,99974 $70,000 to $79,999126 $80,000 to $89,99950 $90,000 to $99,999486 $100,000 to $124,999372 $125,000 to $149,9991,084 $150,000 to $174,999879 $175,000 to $199,9991,282 $200,000 to $249,999750 $250,000 to $299,999901 $300,000 to $399,999267 $400,000 to $499,999573 $500,000 to $749,99974 $750,000 to $999,999143 $1,000,000 to $1,499,99947 $1,500,000 to $1,999,99910 $2,000,000 or moreRent paid by renters in 2022 in zip code 48328 11 Less than $10020 $100 to $14925 $200 to $24967 $250 to $29937 $300 to $34978 $350 to $39928 $400 to $449128 $450 to $49963 $500 to $54932 $550 to $59988 $600 to $649147 $650 to $699316 $700 to $749418 $750 to $799817 $800 to $899328 $900 to $999697 $1,000 to $1,249208 $1,250 to $1,49985 $1,500 to $1,99949 $2,000 to $2,49970 $2,500 to $2,99933 $3,000 to $3,4997 $3,500 or more72 No cash rent
Median gross rent in 2022: $983.
Median price asked for vacant for-sale houses and condos in 2022: $226,276.
Estimated median house (or condo) value in 2022 for: White Non-Hispanic householders: $223,232Black or African American householders: $293,475American Indian or Alaska Native householders: $174,045Asian householders: $185,067Some other race householders: $233,925Two or more races householders: $219,777Hispanic or Latino householders: $229,648Estimated median house or condo value in 2022: $220,271
48328:
$220,271Michigan:
$224,400
Lower value quartile - upper value quartile: $168,178 - $315,508
Mean price in 2022: Detached houses: $274,390Here:
$274,390State:
$280,038
Townhouses or other attached units: $216,025Here:
$216,025State:
$239,520
In 3-to-4-unit structures: $99,748Here:
$99,748State:
$207,067
In 5-or-more-unit structures: $159,540Here:
$159,540State:
$192,733
Mobile homes: $16,848Here:
$16,848State:
$72,868
Housing units in structures:
One, detached: 7,597One, attached: 474Two: 2153 or 4: 5385 to 9: 68610 to 19: 1,19820 to 49: 40550 or more: 741Mobile homes: 132Unemployment : 4.1%
Means of transportation to work in zip code 48328 78.1% 10,108 Drove a car alone5.2% 677 Carpooled0.2% 31 Bus or trolley bus0.1% 12 Taxi0.2% 22 Bicycle0.5% 63 Walked2.3% 297 Other means13.7% 1,770 Worked at homeTravel time to work (commute) in zip code 48328 119 Less than 5 minutes1,219 5 to 9 minutes1,561 10 to 14 minutes1,352 15 to 19 minutes1,448 20 to 24 minutes886 25 to 29 minutes2,087 30 to 34 minutes672 35 to 39 minutes431 40 to 44 minutes811 45 to 59 minutes474 60 to 89 minutes99 90 or more minutes
Percentage of zip code residents living and working in this county: 90.1%
Household type by relationship:
Households: 25,656
Male householders: 5,834 (2,225 living alone ), Female householders: 5,738 (1,945 living alone )4,185 spouses (4,106 opposite-sex spouses ), 884 unmarried partners , (860 opposite-sex unmarried partners ), 6,548 children (5,896 natural , 233 adopted , 416 stepchildren ), 678 grandchildren , 203 brothers or sisters , 340 parents , 0 foster children , 286 other relatives , 716 non-relatives In group quarters: 296 (-1 institutionalized population )
Size of family households: 3,190 2-persons , 1,779 3-persons , 881 4-persons , 434 5-persons , 234 6-persons , 71 7-or-more-persons
Size of nonfamily households: 4,166 1-person , 802 2-persons , 11 3-persons , 30 4-persons
2,980 married couples with children. single-parent households (398 men , 1,079 women ).
86.8% of residents of 48328 zip code speak English at home. of residents speak Spanish at home (62% very well, 16% well, 12% not well, 9% not at all ).of residents speak other Indo-European language at home (67% very well, 11% well, 17% not well, 5% not at all ).of residents speak Asian or Pacific Island language at home (35% very well, 48% well, 17% not well ).of residents speak other language at home (91% very well, 9% well ).
Foreign born population: 1,940 (7.6%)
(44.8%
of them are naturalized citizens )
This zip code:
7.6%Whole state:
6.9%
33% Honduras 7% Serbia 4% Indonesia 4% North Macedonia (Macedonia) 3% Georgia 3% Sweden 3% Malaysia 10% English 9% German 7% American 6% Irish 5% Polish 4% Italian 2% Scottish
Year of entry for the foreign-born population
521 2010 or later 694 2000 to 2009 449 1990 to 1999 477 Before 1990
There are
190 Medical Specialists in Zip Code 48328 .
Major facilities with environmental interests located in this zip code:
DONELSON HILLS ELEMENTARY SCHOOL (2690 WEWOKA STREET in WATERFORD, MI)
(National Center for Education Statistics) - STATE ID-00933 Organizations: WATERFORD SCHOOL DISTRICT (SCHOOL DISTRICT)
ELIZA SEAMAN LEGGETT SCHOOL (3621 PONTIAC LAKE ROAD in WATERFORD, MI)
(National Center for Education Statistics) - STATE ID-01106 Organizations: WATERFORD SCHOOL DISTRICT (SCHOOL DISTRICT)
MI DEPT/TRANSPORTATION (2300 DIXIE HWY in WATERFORD, MI)
(Resource Conservation and Recovery Act (tracking hazardous waste)) Organizations: MICH DEPT OF TRANSPORTATION (CONTACT/OPERATOR)
Alternative names: MI DEPT/DOT
AMOCO OIL CO 9752 (205 N TELEGRAPH RD in WATERFORD TOWNSHIP, MI)
(Resource Conservation and Recovery Act (tracking hazardous waste)) Organizations: AMOCO OIL COMPANY (CONTACT/OWNER)
ARCHAMBEAU DISTRIBUTING (1131 SYLVERTIS RD in WATERFORD, MI)
(Resource Conservation and Recovery Act (tracking hazardous waste)) Organizations: ARCAMBEAU WILLIAM (CONTACT/OWNER)
DIVISION PRINTING (1179 SYLVERTIS in WATERFORD, MI)
(Resource Conservation and Recovery Act (tracking hazardous waste)) Organizations: SKELLENGER RICK (CONTACT/OWNER)
ELIZABETH LAKE CLEANERS (3685 ELIZABETH LAKE RD in WATERFORD, MI)
(Resource Conservation and Recovery Act (tracking hazardous waste)) Organizations: MCDOWELL ESTHER M (CONTACT/OWNER)
EXXONMOBIL OIL CORP (3480 ELIZABETH LAKE RD in WATERFORD, MI)
(Resource Conservation and Recovery Act (tracking hazardous waste)) Organizations: EXXONMOBIL OIL CORPORATION (CONTACT/OPERATOR)
Alternative names: MOBIL OIL CORPORATION, MOBIL OIL CORP SS C9F
BELLE TIRE DISTRIBUTORS (39 N TELEGRAPH in WATERFORD, MI)
(Resource Conservation and Recovery Act (tracking hazardous waste))
BILL ANDERSON BUICK, HUMMER INC (2225 DIXIE HWY in WATERFORD, MI)
(Resource Conservation and Recovery Act (tracking hazardous waste)) Alternative names: B AND B AUTO
BLOOMFIELD BEACH AND BOAT FACILITY (4365 CASS ELIZABETH RD in WATERFORD TOWNSHIP, MI)
(Resource Conservation and Recovery Act (tracking hazardous waste)) Organizations: RECREATION INC (CONTACT/OWNER)
METROSWEEP ENVIRONMENTAL INC (4557 HIGHLAND ROAD in WATERFORD, MI)
(Resource Conservation and Recovery Act (tracking hazardous waste)) Organizations: KELLY & RUSSELL BARKER (CONTACT/OPERATOR)
Housing units lacking complete plumbing facilities: 0.5%
Housing units lacking complete kitchen facilities: 1.8%
83.1% Utility gas 14.2% Electricity 1.5% Bottled, tank, or LP gas 0.6% No fuel used
Population in 1990: 24,330. Population change in the 1990s: +2,113 (+8.7%).
Place of birth for U.S.-born residents:
This state: 20,203Northeast: 477Midwest: 1,273South: 1,113West: 368
52% of the 48328 zip code residents lived in the same house 5 years ago.
Out of people who lived in different houses, 72% lived in this county.
Out of people who lived in different counties, 50% lived in Michigan.
91% of the 48328 zip code residents lived in the same house 1 year ago.
Out of people who lived in different houses, 70% moved from this county.
Out of people who lived in different houses, 18% moved from different county within same state.
Out of people who lived in different houses, 9% moved from different state.
Out of people who lived in different houses, 1% moved from abroad.
Private vs. public school enrollment:
Students in private schools in grades 1 to 8 (elementary and middle school): 153
Students in private schools in grades 9 to 12 (high school): 280
Students in private undergraduate colleges: 177
Occupation by median earnings in the past 12 months ($)
98,669 Architecture and engineering occupations 90,039 Law enforcement workers including supervisors 81,991 Life, physical, and social science occupations 74,911 Computer and mathematical occupations 73,680 Business and financial operations occupations 71,241 Health diagnosing and treating practitioners and other technical occupations
Companies with federal contracts located in this zip code:
TRAILER DEPOT INC (3645 HIGHLAND RD in WATERFORD, MI; small business) in 3 contracts from 2002 to 2004
$19,294 with Army for Trailers. Signed on 2004-09-25. Completion date: 2005-01-14.
, same as above. Signed on 2002-09-29. Completion date: 2002-11-25.
, same as above. Signed on 2003-09-30. Completion date: 2003-11-29.
JETT PUMP & VALVE LLC (4770 PONTIAC LAKE RD in WATERFORD, MI; small business)
$4,317 with Defense Logistics Agency for Sewage Treatment Equipment. Signed on 2005-11-10. Completion date: 2005-11-25.
Top industries in this zip code by the number of employees in 2005:
Accommodation and Food Services: Full-Service Restaurants (50-99 employees: 4 establishments, 20-49 employees: 5 establishments, 10-19 employees: 6 establishments, 5-9 employees: 4 establishments, 1-4 employees: 8 establishments)Administrative and Support and Waste Management and Remediation Services: Remediation Services (250-499: 1, 1-4: 1)Accommodation and Food Services: Limited-Service Restaurants (20-49: 7, 10-19: 5, 5-9: 4, 1-4: 7)Health Care and Social Assistance: Offices of Dentists (20-49: 3, 10-19: 6, 5-9: 8, 1-4: 5)Health Care and Social Assistance: Offices of Physicians (except Mental Health Specialists) (20-49: 3, 10-19: 4, 5-9: 5, 1-4: 11)Health Care and Social Assistance: Nursing Care Facilities (100-249: 1, 10-19: 1)
People in group quarters in 2010:
200 people in correctional facilities intended for juveniles
114 people in nursing facilities/skilled-nursing facilities
21 people in group homes intended for adults
20 people in residential treatment centers for adults
14 people in emergency and transitional shelters (with sleeping facilities) for people experiencing homelessness
8 people in workers' group living quarters and job corps centers
People in group quarters in 2000:
1,348 people in local jails and other confinement facilities (including police lockups)
105 people in nursing homes
34 people in other group homes
6 people in homes for the physically handicapped
5 people in homes for the mentally ill
4 people in homes for the mentally retarded
Fatal accident statistics in 2014:
Fatal accident count: 2Vehicles involved in fatal accidents: 3Fatal accidents caused by drunken drivers: 0Fatalities: 2Persons involved in fatal accidents: 3Pedestrians involved in fatal accidents: 1
Fatal accident statistics in 2013:
Fatal accident count: 1Vehicles involved in fatal accidents: 2Fatal accidents caused by drunken drivers: 0Fatalities: 1Persons involved in fatal accidents: 4Pedestrians involved in fatal accidents: 0
Home Mortgage Disclosure Act Aggregated Statistics For Year 2009(Based on 6 full and 14 partial tracts) A) FHA, FSA/RHS & VA B) Conventional C) Refinancings D) Home Improvement Loans E) Loans on Dwellings For 5+ Families F) Non-occupant Loans on G) Loans On Manufactured Number Average Value Number Average Value Number Average Value Number Average Value Number Average Value Number Average Value Number Average Value
LOANS ORIGINATED 259 $89,410 100 $108,171 488 $156,817 29 $44,636 2 $36,000 37 $117,229 2 $55,000 APPLICATIONS APPROVED, NOT ACCEPTED 12 $70,512 10 $194,801 64 $155,600 4 $7,915 0 $0 5 $94,010 0 $0 APPLICATIONS DENIED 47 $79,936 28 $103,275 314 $152,833 60 $24,878 0 $0 21 $75,950 4 $14,782 APPLICATIONS WITHDRAWN 40 $97,056 10 $149,460 153 $149,786 11 $39,385 2 $232,300 2 $41,615 0 $0 FILES CLOSED FOR INCOMPLETENESS 5 $124,564 5 $224,526 43 $150,005 1 $833,220 0 $0 7 $85,181 0 $0
Aggregated Statistics For Year 2008(Based on 6 full and 14 partial tracts) A) FHA, FSA/RHS & VA B) Conventional C) Refinancings D) Home Improvement Loans E) Loans on Dwellings For 5+ Families F) Non-occupant Loans on G) Loans On Manufactured Number Average Value Number Average Value Number Average Value Number Average Value Number Average Value Number Average Value Number Average Value
LOANS ORIGINATED 220 $101,957 166 $110,564 443 $159,221 87 $21,113 3 $1,031,180 62 $67,470 7 $18,997 APPLICATIONS APPROVED, NOT ACCEPTED 10 $124,708 17 $149,911 79 $187,308 15 $15,524 0 $0 8 $162,179 3 $25,720 APPLICATIONS DENIED 63 $95,227 75 $111,603 446 $144,253 47 $41,637 0 $0 47 $92,364 18 $32,919 APPLICATIONS WITHDRAWN 29 $114,445 29 $191,328 145 $147,135 13 $40,914 0 $0 5 $125,080 0 $0 FILES CLOSED FOR INCOMPLETENESS 1 $42,120 8 $170,096 32 $192,477 2 $20,920 0 $0 2 $128,580 0 $0
Aggregated Statistics For Year 2007(Based on 6 full and 14 partial tracts) A) FHA, FSA/RHS & VA B) Conventional C) Refinancings D) Home Improvement Loans E) Loans on Dwellings For 5+ Families F) Non-occupant Loans on G) Loans On Manufactured Number Average Value Number Average Value Number Average Value Number Average Value Number Average Value Number Average Value Number Average Value
LOANS ORIGINATED 74 $125,661 489 $135,309 942 $150,246 141 $32,380 0 $0 150 $114,808 2 $47,000 APPLICATIONS APPROVED, NOT ACCEPTED 4 $156,595 88 $119,036 221 $159,682 23 $139,273 0 $0 28 $108,948 4 $22,605 APPLICATIONS DENIED 8 $142,884 157 $124,210 898 $154,658 132 $44,139 0 $0 72 $115,529 31 $36,791 APPLICATIONS WITHDRAWN 4 $144,568 52 $183,729 267 $159,716 24 $55,931 2 $880,000 14 $102,361 0 $0 FILES CLOSED FOR INCOMPLETENESS 0 $0 22 $125,523 107 $184,146 7 $60,377 0 $0 14 $77,749 0 $0
Aggregated Statistics For Year 2006(Based on 6 full and 14 partial tracts) A) FHA, FSA/RHS & VA B) Conventional C) Refinancings D) Home Improvement Loans E) Loans on Dwellings For 5+ Families F) Non-occupant Loans on G) Loans On Manufactured Number Average Value Number Average Value Number Average Value Number Average Value Number Average Value Number Average Value Number Average Value
LOANS ORIGINATED 55 $136,355 728 $116,498 1,391 $130,513 169 $46,041 1 $405,450 181 $137,336 8 $38,674 APPLICATIONS APPROVED, NOT ACCEPTED 3 $133,520 126 $287,592 283 $135,899 35 $75,278 0 $0 29 $123,795 6 $21,123 APPLICATIONS DENIED 9 $151,381 230 $148,058 1,028 $140,627 168 $51,185 0 $0 69 $145,386 16 $39,416 APPLICATIONS WITHDRAWN 7 $146,480 93 $163,872 459 $150,522 55 $43,337 0 $0 29 $154,347 0 $0 FILES CLOSED FOR INCOMPLETENESS 1 $122,350 39 $119,674 165 $144,550 2 $42,860 0 $0 9 $172,374 0 $0
Aggregated Statistics For Year 2005(Based on 6 full and 14 partial tracts) A) FHA, FSA/RHS & VA B) Conventional C) Refinancings D) Home Improvement Loans E) Loans on Dwellings For 5+ Families F) Non-occupant Loans on G) Loans On Manufactured Number Average Value Number Average Value Number Average Value Number Average Value Number Average Value Number Average Value Number Average Value
LOANS ORIGINATED 79 $153,453 1,100 $125,730 1,926 $140,134 183 $47,741 0 $0 200 $128,874 3 $17,173 APPLICATIONS APPROVED, NOT ACCEPTED 12 $141,386 175 $127,626 396 $137,331 13 $85,120 0 $0 44 $125,266 9 $27,176 APPLICATIONS DENIED 9 $148,933 262 $141,327 1,064 $144,606 131 $58,970 2 $318,880 73 $157,156 32 $38,631 APPLICATIONS WITHDRAWN 6 $147,775 149 $137,146 542 $154,344 79 $101,389 3 $318,287 36 $117,943 0 $0 FILES CLOSED FOR INCOMPLETENESS 2 $132,865 39 $148,374 255 $149,086 9 $47,186 0 $0 9 $232,480 0 $0
Aggregated Statistics For Year 2004(Based on 6 full and 14 partial tracts) A) FHA, FSA/RHS & VA B) Conventional C) Refinancings D) Home Improvement Loans E) Loans on Dwellings For 5+ Families F) Non-occupant Loans on G) Loans On Manufactured Number Average Value Number Average Value Number Average Value Number Average Value Number Average Value Number Average Value Number Average Value
LOANS ORIGINATED 121 $138,973 1,024 $141,652 2,385 $141,152 217 $59,610 2 $6,193,945 209 $121,880 8 $105,108 APPLICATIONS APPROVED, NOT ACCEPTED 16 $151,494 130 $129,798 383 $145,962 33 $57,153 0 $0 38 $111,873 3 $25,873 APPLICATIONS DENIED 28 $135,196 187 $122,537 1,007 $138,687 137 $45,604 2 $308,590 44 $132,110 21 $45,086 APPLICATIONS WITHDRAWN 9 $142,110 73 $158,970 593 $145,187 58 $71,794 0 $0 23 $99,817 0 $0 FILES CLOSED FOR INCOMPLETENESS 5 $135,436 31 $156,351 241 $148,561 15 $119,748 0 $0 9 $121,836 0 $0
Aggregated Statistics For Year 2002(Based on 4 full and 14 partial tracts) A) FHA, FSA/RHS & VA B) Conventional C) Refinancings D) Home Improvement Loans F) Non-occupant Loans on Number Average Value Number Average Value Number Average Value Number Average Value Number Average Value
LOANS ORIGINATED 225 $130,426 894 $140,351 3,814 $137,073 155 $19,679 165 $108,354 APPLICATIONS APPROVED, NOT ACCEPTED 6 $129,128 111 $105,277 455 $136,876 53 $17,559 27 $67,990 APPLICATIONS DENIED 25 $126,734 154 $90,585 782 $117,580 116 $17,844 45 $95,325 APPLICATIONS WITHDRAWN 13 $129,527 60 $122,473 596 $130,563 12 $36,349 12 $113,852 FILES CLOSED FOR INCOMPLETENESS 10 $138,883 19 $176,255 219 $138,341 4 $122,025 9 $97,492
Aggregated Statistics For Year 2001(Based on 4 full and 14 partial tracts) A) FHA, FSA/RHS & VA B) Conventional C) Refinancings D) Home Improvement Loans E) Loans on Dwellings For 5+ Families F) Non-occupant Loans on Number Average Value Number Average Value Number Average Value Number Average Value Number Average Value Number Average Value
LOANS ORIGINATED 250 $132,088 837 $128,850 3,258 $128,685 309 $24,680 2 $402,485 141 $118,602 APPLICATIONS APPROVED, NOT ACCEPTED 5 $148,742 86 $113,596 325 $116,538 96 $19,615 0 $0 19 $75,312 APPLICATIONS DENIED 17 $120,378 172 $79,961 658 $109,333 146 $15,673 0 $0 28 $71,391 APPLICATIONS WITHDRAWN 16 $121,901 44 $129,381 500 $114,651 21 $39,222 0 $0 14 $123,122 FILES CLOSED FOR INCOMPLETENESS 2 $126,145 13 $202,436 188 $124,376 1 $24,650 0 $0 3 $127,287
Aggregated Statistics For Year 2000(Based on 4 full and 14 partial tracts) A) FHA, FSA/RHS & VA B) Conventional C) Refinancings D) Home Improvement Loans F) Non-occupant Loans on Number Average Value Number Average Value Number Average Value Number Average Value Number Average Value
LOANS ORIGINATED 277 $121,412 883 $124,936 905 $108,996 318 $15,701 95 $98,189 APPLICATIONS APPROVED, NOT ACCEPTED 11 $105,956 83 $107,829 206 $93,492 103 $21,858 12 $72,935 APPLICATIONS DENIED 21 $111,766 251 $63,858 426 $96,946 182 $21,185 25 $34,369 APPLICATIONS WITHDRAWN 7 $122,137 67 $115,864 265 $92,075 29 $39,730 9 $124,642 FILES CLOSED FOR INCOMPLETENESS 2 $117,325 27 $157,193 90 $108,313 5 $24,604 2 $91,000
Aggregated Statistics For Year 1999(Based on 2 full and 8 partial tracts) A) FHA, FSA/RHS & VA B) Conventional C) Refinancings D) Home Improvement Loans F) Non-occupant Loans on Number Average Value Number Average Value Number Average Value Number Average Value Number Average Value
LOANS ORIGINATED 160 $113,437 522 $129,566 882 $112,021 145 $19,609 47 $81,755 APPLICATIONS APPROVED, NOT ACCEPTED 3 $119,660 63 $97,037 136 $97,899 40 $19,387 7 $85,583 APPLICATIONS DENIED 9 $116,298 122 $59,698 225 $110,480 98 $14,834 14 $56,117 APPLICATIONS WITHDRAWN 7 $105,971 49 $115,434 152 $97,524 25 $69,587 3 $74,607 FILES CLOSED FOR INCOMPLETENESS 1 $37,430 7 $165,153 50 $112,803 0 $0 1 $33,840
Private Mortgage Insurance Companies Aggregated Statistics For Year 2009(Based on 4 full and 12 partial tracts) A) Conventional B) Refinancings C) Non-occupant Loans on Number Average Value Number Average Value Number Average Value
LOANS ORIGINATED 14 $114,231 3 $150,137 1 $27,030 APPLICATIONS APPROVED, NOT ACCEPTED 5 $202,282 4 $179,068 1 $28,830 APPLICATIONS DENIED 4 $255,155 3 $118,070 0 $0 APPLICATIONS WITHDRAWN 5 $200,038 4 $191,080 0 $0 FILES CLOSED FOR INCOMPLETENESS 9 $196,584 0 $0 0 $0
Aggregated Statistics For Year 2008(Based on 6 full and 14 partial tracts) A) Conventional B) Refinancings C) Non-occupant Loans on Number Average Value Number Average Value Number Average Value
LOANS ORIGINATED 73 $125,280 32 $184,739 10 $51,682 APPLICATIONS APPROVED, NOT ACCEPTED 37 $161,985 42 $148,327 8 $116,434 APPLICATIONS DENIED 13 $103,742 8 $186,972 10 $98,415 APPLICATIONS WITHDRAWN 4 $218,875 4 $197,700 0 $0 FILES CLOSED FOR INCOMPLETENESS 5 $82,812 4 $149,720 6 $107,147
Aggregated Statistics For Year 2007(Based on 6 full and 14 partial tracts) A) Conventional B) Refinancings C) Non-occupant Loans on Number Average Value Number Average Value Number Average Value
LOANS ORIGINATED 213 $133,972 77 $149,266 27 $93,330 APPLICATIONS APPROVED, NOT ACCEPTED 21 $156,130 37 $173,406 2 $74,415 APPLICATIONS DENIED 6 $246,537 1 $63,880 0 $0 APPLICATIONS WITHDRAWN 11 $192,974 6 $203,703 2 $179,400 FILES CLOSED FOR INCOMPLETENESS 0 $0 0 $0 0 $0
Aggregated Statistics For Year 2006(Based on 6 full and 14 partial tracts) A) Conventional B) Refinancings C) Non-occupant Loans on Number Average Value Number Average Value Number Average Value
LOANS ORIGINATED 118 $136,526 68 $144,090 8 $90,822 APPLICATIONS APPROVED, NOT ACCEPTED 25 $171,848 25 $154,764 4 $189,455 APPLICATIONS DENIED 2 $85,720 0 $0 0 $0 APPLICATIONS WITHDRAWN 13 $148,629 5 $247,764 1 $122,160 FILES CLOSED FOR INCOMPLETENESS 2 $194,805 0 $0 0 $0
Aggregated Statistics For Year 2005(Based on 6 full and 14 partial tracts) A) Conventional B) Refinancings C) Non-occupant Loans on Number Average Value Number Average Value Number Average Value
LOANS ORIGINATED 160 $143,887 138 $159,811 14 $128,206 APPLICATIONS APPROVED, NOT ACCEPTED 21 $136,017 44 $165,707 5 $132,994 APPLICATIONS DENIED 0 $0 0 $0 0 $0 APPLICATIONS WITHDRAWN 5 $168,380 12 $153,210 0 $0 FILES CLOSED FOR INCOMPLETENESS 1 $40,610 2 $185,815 1 $40,610
Aggregated Statistics For Year 2004(Based on 6 full and 14 partial tracts) A) Conventional B) Refinancings C) Non-occupant Loans on Number Average Value Number Average Value Number Average Value
LOANS ORIGINATED 215 $138,042 178 $154,510 28 $114,914 APPLICATIONS APPROVED, NOT ACCEPTED 34 $135,110 58 $154,249 4 $96,552 APPLICATIONS DENIED 1 $66,180 0 $0 1 $32,090 APPLICATIONS WITHDRAWN 9 $100,190 14 $156,013 1 $38,610 FILES CLOSED FOR INCOMPLETENESS 0 $0 3 $163,807 0 $0
Aggregated Statistics For Year 2003(Based on 6 full and 14 partial tracts) A) Conventional B) Refinancings C) Non-occupant Loans on Number Average Value Number Average Value Number Average Value
LOANS ORIGINATED 328 $141,284 434 $145,126 36 $109,836 APPLICATIONS APPROVED, NOT ACCEPTED 47 $130,685 115 $153,486 8 $63,481 APPLICATIONS DENIED 4 $130,192 5 $110,716 1 $34,600 APPLICATIONS WITHDRAWN 15 $125,635 20 $162,120 2 $122,875 FILES CLOSED FOR INCOMPLETENESS 1 $187,940 0 $0 0 $0
Aggregated Statistics For Year 2002(Based on 4 full and 14 partial tracts) A) Conventional B) Refinancings C) Non-occupant Loans on Number Average Value Number Average Value Number Average Value
LOANS ORIGINATED 328 $144,666 414 $149,576 31 $125,742 APPLICATIONS APPROVED, NOT ACCEPTED 38 $149,823 99 $139,109 5 $82,050 APPLICATIONS DENIED 1 $249,230 12 $124,172 0 $0 APPLICATIONS WITHDRAWN 13 $127,742 35 $148,675 3 $161,237 FILES CLOSED FOR INCOMPLETENESS 2 $140,000 5 $137,248 0 $0
Aggregated Statistics For Year 2001(Based on 4 full and 14 partial tracts) A) Conventional B) Refinancings C) Non-occupant Loans on Number Average Value Number Average Value Number Average Value
LOANS ORIGINATED 368 $139,984 405 $140,771 17 $132,252 APPLICATIONS APPROVED, NOT ACCEPTED 63 $142,022 80 $163,694 7 $134,519 APPLICATIONS DENIED 3 $133,333 18 $159,700 3 $157,843 APPLICATIONS WITHDRAWN 10 $118,972 9 $137,104 1 $217,300 FILES CLOSED FOR INCOMPLETENESS 1 $198,560 0 $0 0 $0
Aggregated Statistics For Year 2000(Based on 4 full and 14 partial tracts) A) Conventional B) Refinancings C) Non-occupant Loans on Number Average Value Number Average Value Number Average Value
LOANS ORIGINATED 354 $127,098 106 $127,993 23 $91,709 APPLICATIONS APPROVED, NOT ACCEPTED 43 $167,857 18 $167,059 1 $54,760 APPLICATIONS DENIED 8 $150,196 7 $129,479 0 $0 APPLICATIONS WITHDRAWN 5 $135,564 2 $184,640 0 $0 FILES CLOSED FOR INCOMPLETENESS 3 $137,480 0 $0 0 $0
Aggregated Statistics For Year 1999(Based on 2 full and 7 partial tracts) A) Conventional B) Refinancings C) Non-occupant Loans on Number Average Value Number Average Value Number Average Value
LOANS ORIGINATED 205 $128,268 65 $125,183 8 $106,206 APPLICATIONS APPROVED, NOT ACCEPTED 9 $133,711 14 $109,014 4 $83,262 APPLICATIONS DENIED 3 $137,807 3 $190,543 0 $0 APPLICATIONS WITHDRAWN 4 $147,718 3 $102,273 0 $0 FILES CLOSED FOR INCOMPLETENESS 1 $121,000 1 $58,530 0 $0
2002 - 2018 National Fire Incident Reporting System (NFIRS) incidents See full 2006 National Fire Incident Reporting System statistics for zip code 48328, Michigan
Most common first names in zip code 48328 among deceased individuals Name Count Lived (average)
Mary 82 80.3 years William 62 75.8 years Robert 60 74.6 years John 54 74.4 years James 54 72.9 years Dorothy 53 81.0 years Helen 49 84.4 years Margaret 44 85.5 years Charles 40 78.8 years Ruth 31 81.0 years
Most common last names in zip code 48328 among deceased individuals Last name Count Lived (average)
Smith 20 76.8 years Brown 19 78.3 years Johnson 14 81.4 years Miller 13 79.5 years Davis 12 67.6 years Jones 10 82.8 years Wright 10 79.5 years White 9 76.1 years Moore 9 72.7 years Young 9 84.2 years
Businesses in zip code 48328
Name Count Name Count
7-Eleven 2 Kmart 1 ALDI 1 Little Caesars Pizza 1 AT&T 1 McDonald's 3 Applebee's 1 Meijer 1 Arby's 1 New Balance 1 AutoZone 1 Nike 2 Baskin-Robbins 1 OfficeMax 1 Blockbuster 1 Pizza Hut 1 Budget Car Rental 1 Red Lobster 1 Burger King 1 Rite Aid 1 CVS 1 SAS Shoes 1 Chevrolet 1 Sam's Club 1 ColorTyme 1 Sears 2 Discount Tire 1 Sprint Nextel 1 Dunkin Donuts 1 Target 1 FedEx 1 Tim Hortons 1 Firestone Complete Auto Care 1 Toyota 1 GameStop 1 U-Haul 2 H&R Block 2 UPS 2 Holiday Inn 1 Walgreens 2 Jones New York 2 Wendy's 2 KFC 1 White Castle 1
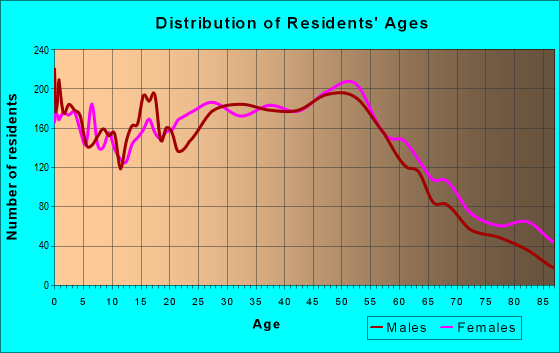
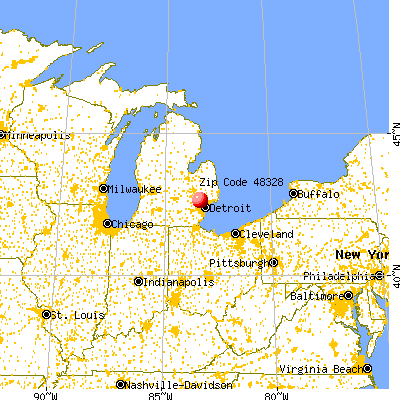


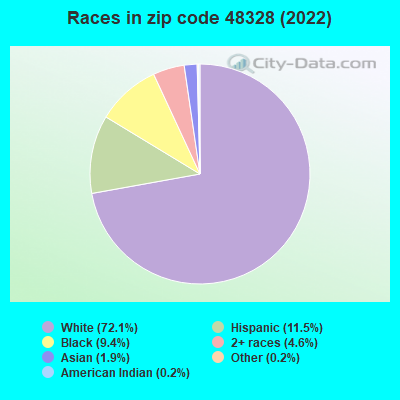


 Nearest zip codes: 48320, 48329, 48327, 48324, 48341, 48340.
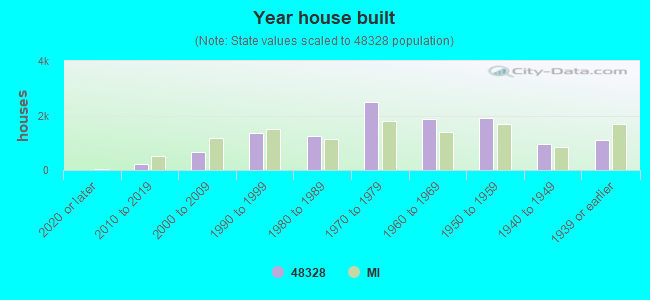
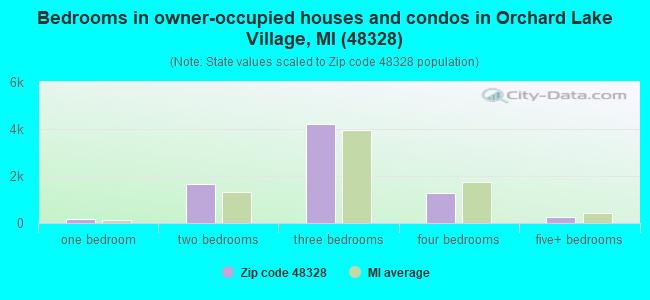
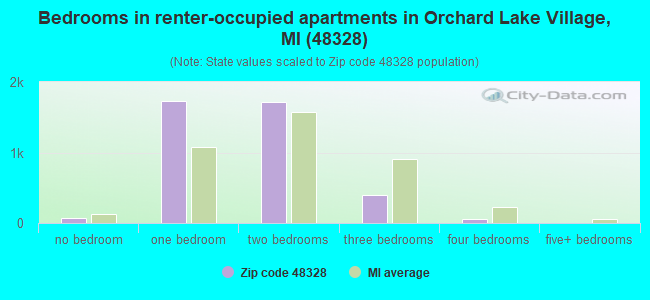
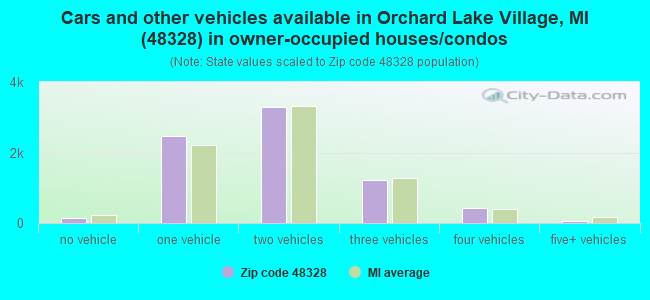
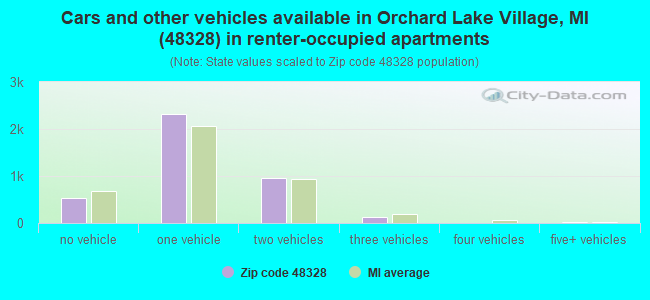


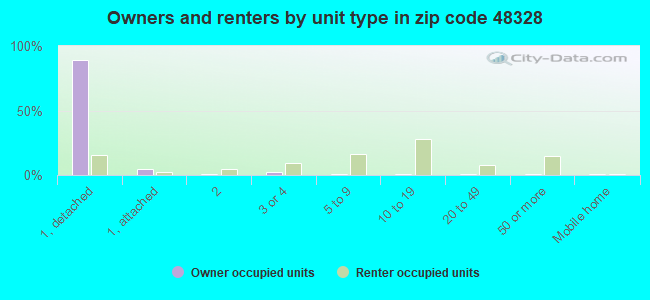
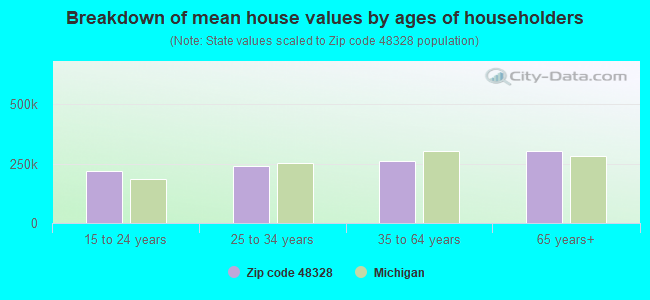


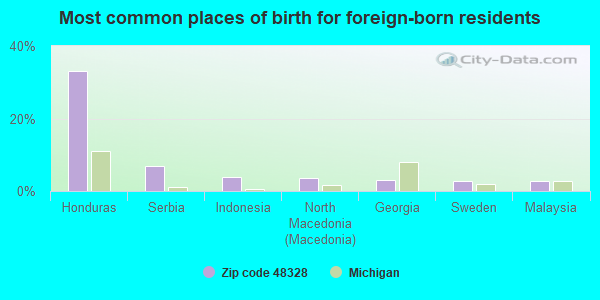
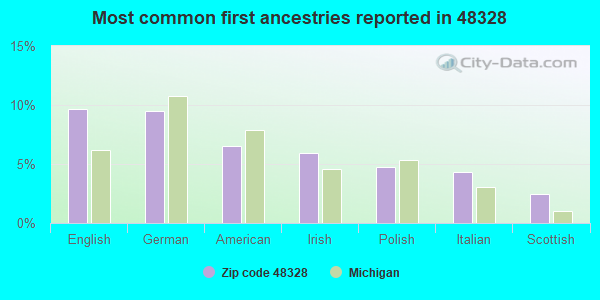
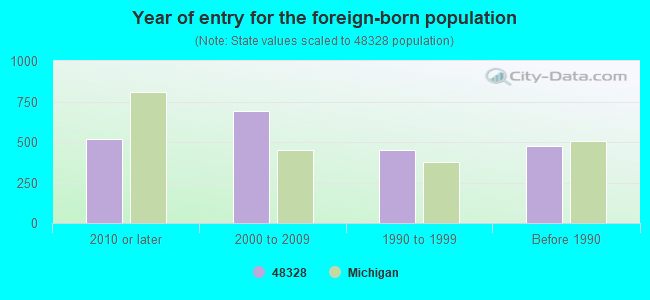
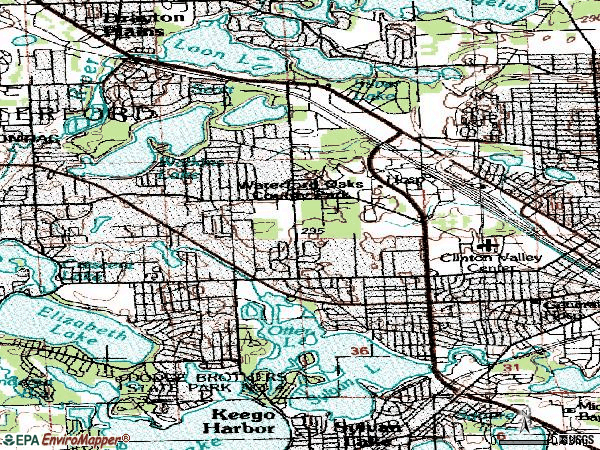

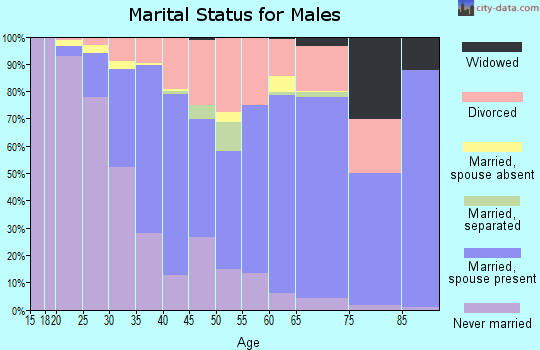
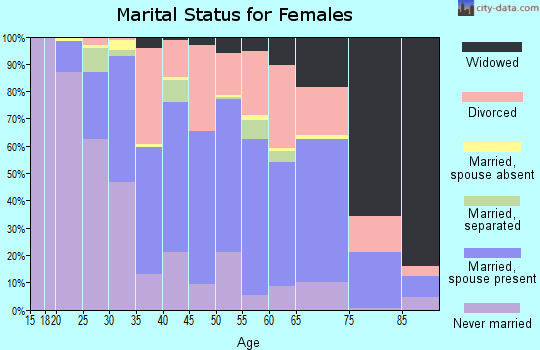
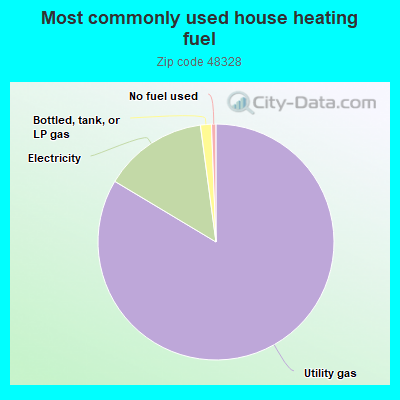
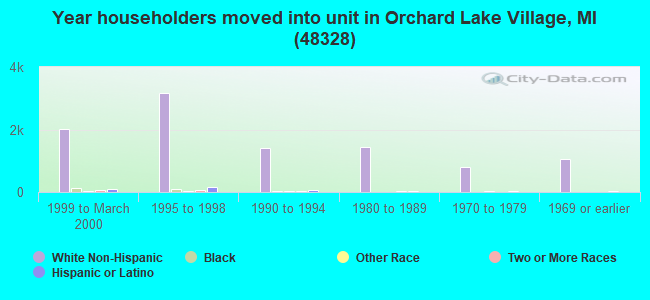
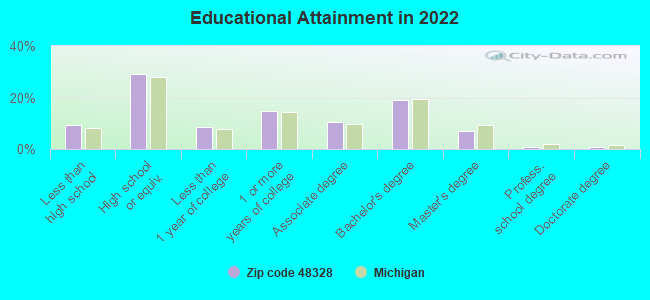
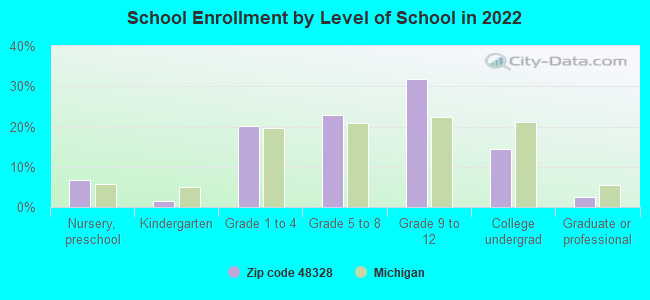
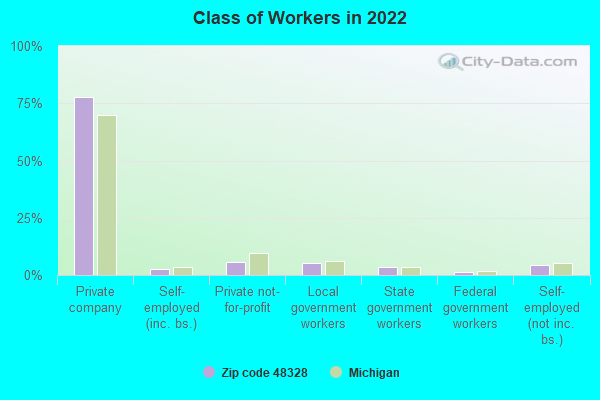
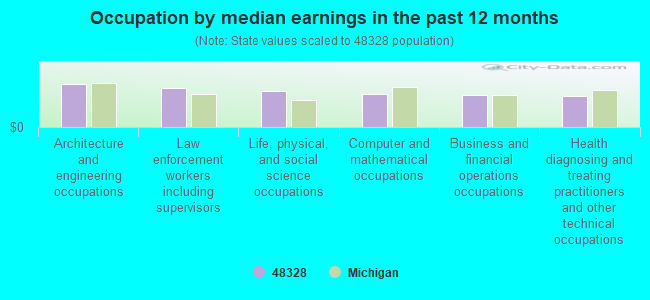
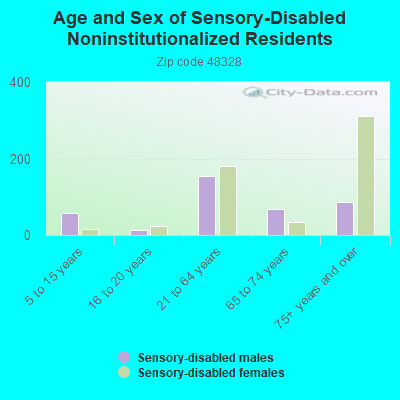
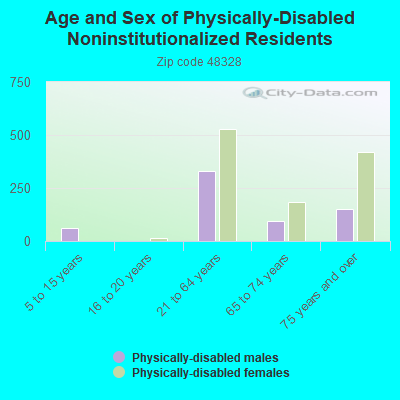
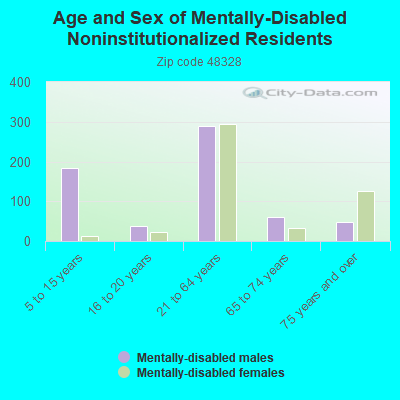
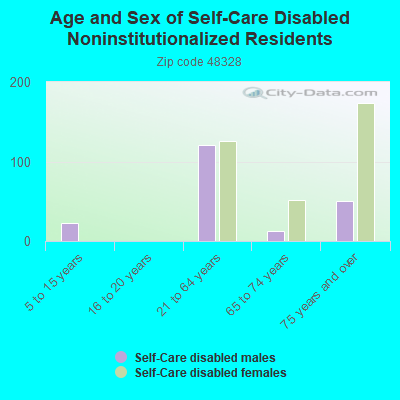
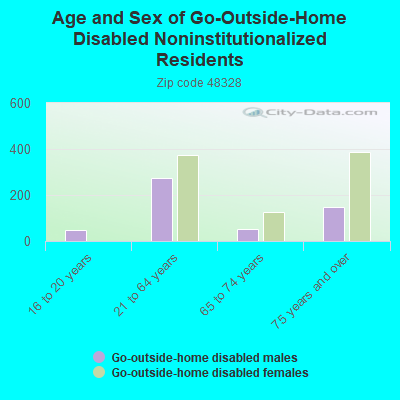
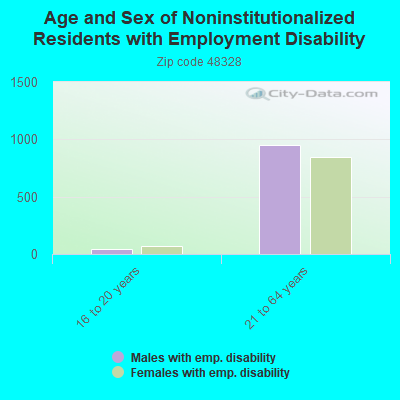
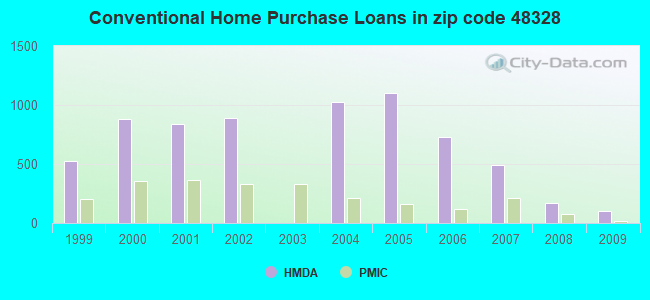
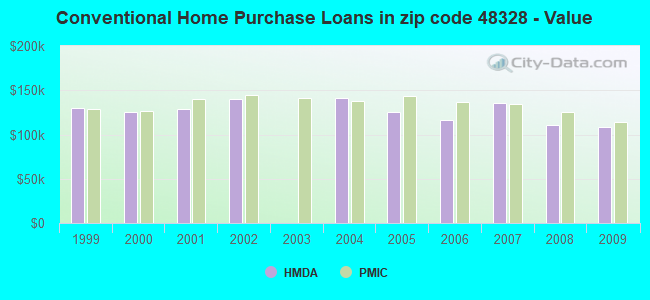
 According to the data from the years 2002 - 2018 the average number of fires per year is 52. The highest number of fires - 78 took place in 2003, and the least - 30 in 2015. The data has a declining trend.
 When looking into fire subcategories, the most reports belonged to: Structure Fires (52.4%), and Outside Fires (22.2%).