Estimated zip code population in 2022: 7,069 Zip code population in 2010: 6,481 Zip code population in 2000: 6,118
Houses and condos: 2,909 Renter-occupied apartments: 219
% of renters here:
7%
State:
27%
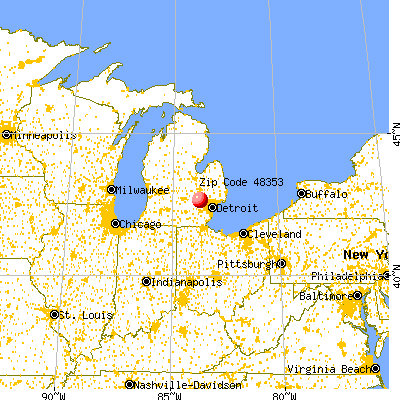
March 2022 cost of living index in zip code 48353: 98.0 (near average, U.S. average is 100)
Land area: 13.4 sq. mi. Water area: 0.7 sq. mi.
Population density: 528 people per square mile
(low).
OSM Map
General Map
Google Map
MSN Map
OSM Map
General Map
Google Map
MSN Map
OSM Map
General Map
Google Map
MSN Map
OSM Map
General Map
Google Map
MSN Map
Please wait while loading the map...
Real estate property taxes paid for housing units in 2022:
This zip code:
1.0% ($3,021)
Michigan:
1.2% ($2,746)
Median real estate property taxes paid for housing units with mortgages in 2022: $3,176 (1.0%) Median real estate property taxes paid for housing units with no mortgage in 2022: $2,724 (1.1%)
Business Search- 14 Million verified businesses
Males: 3,448
(48.8%)
Females: 3,620
(51.2%)
For population 25 years and over in 48353:
High school or higher: 96.8%
Bachelor's degree or higher: 31.9%
Graduate or professional degree: 12.0%
Unemployed: 2.4%
Mean travel time to work (commute): 29.7 minutes
For population 15 years and over in 48353:
Never married: 32.1%
Now married: 51.0%
Separated: 0.0%
Widowed: 5.6%
Divorced: 11.3%
Zip code 48353 compared to state average:
Unemployed percentage below state average.
Black race population percentage significantly below state average.
Median age above state average.
Renting percentage significantly below state average.
Length of stay since moving in above state average.
Estimated median house/condo value in 2022: $306,862
48353:
$306,862
Michigan:
$224,400
According to our research of Michigan and other state lists, there were 6 registered sex offenders living in 48353 zip code as of May 28, 2024. The ratio of all residents to sex offenders in zip code 48353 is 1,077 to 1. The ratio of registered sex offenders to all residents in this zip code is much lower than the state average.
Median resident age:
This zip code:
44.9 years
Michigan median age:
40.3 years
Average household size:
This zip code:
2.4 people
Michigan:
2.4 people
Averages for the 2020 tax year for zip code 48353, filed in 2021:
Average Adjusted Gross Income (AGI) in 2020: $79,543 (Individual Income Tax Returns)
Here:
$79,543
State:
$68,945
Salary/wage: $62,681 (reported on 77.4% of returns)
Here:
$62,681
State:
$57,142
(% of AGI for various income ranges: 1084.7% for AGIs below $25k, 3054.2% for AGIs $25k-50k, 5046.1% for AGIs $50k-75k, 8704.1% for AGIs $75k-100k, 17173.0% for AGIs $100k-200k, 55920.0% for AGIs over 200k)
Taxable interest for individuals: $1,319 (reported on 36.4% of returns)
This zip code:
$1,319
Michigan:
$1,630
(% of AGI for various income ranges: 24.7% for AGIs below $25k, 33.4% for AGIs $25k-50k, 57.3% for AGIs $50k-75k, 53.0% for AGIs $75k-100k, 98.2% for AGIs $100k-200k, 943.3% for AGIs over 200k)
Ordinary dividends: $4,532 (reported on 24.6% of returns)
Here:
$4,532
State:
$6,972
(% of AGI for various income ranges: 32.4% for AGIs below $25k, 57.0% for AGIs $25k-50k, 113.0% for AGIs $50k-75k, 156.3% for AGIs $75k-100k, 316.5% for AGIs $100k-200k, 2046.7% for AGIs over 200k)
Net capital gain/loss in AGI: +$15,776 (reported on 22.9% of returns)
Here:
+$15,776
State:
+$20,064
(% of AGI for various income ranges: 16.8% for AGIs below $25k, 47.4% for AGIs $25k-50k, 107.3% for AGIs $50k-75k, 153.7% for AGIs $75k-100k, 473.2% for AGIs $100k-200k, 15475.0% for AGIs over 200k)
Profit/loss from business: +$10,249 (reported on 14.4% of returns)
Here:
+$10,249
State:
+$11,172
(% of AGI for various income ranges: 78.6% for AGIs below $25k, 96.4% for AGIs $25k-50k, 197.0% for AGIs $50k-75k, 197.4% for AGIs $75k-100k, 444.5% for AGIs $100k-200k, 1688.3% for AGIs over 200k)
Taxable individual retirement arrangement distribution: $17,352 (reported on 13.5% of returns)
48353:
$17,352
Michigan:
$19,803
(% of AGI for various income ranges: 90.0% for AGIs below $25k, 166.4% for AGIs $25k-50k, 473.6% for AGIs $50k-75k, 527.4% for AGIs $75k-100k, 878.8% for AGIs $100k-200k)
Total itemized deductions: $29,719 (reported on 7.6% of returns)
Here:
$29,719
State:
$34,117
(% of AGI for various income ranges: 182.8% for AGIs $25k-50k, 327.9% for AGIs $50k-75k, 358.5% for AGIs $75k-100k, 725.5% for AGIs $100k-200k, 3101.7% for AGIs over 200k)
Charity contributions: $8,609 (reported on 6.5% of returns)
Here:
$8,609
State:
$13,548
(% of AGI for various income ranges: 9.6% for AGIs below $25k, 48.2% for AGIs $50k-75k, 31.9% for AGIs $75k-100k, 163.8% for AGIs $100k-200k, 1541.7% for AGIs over 200k)
Taxes paid: $7,762 (reported on 7.6% of returns)
48353:
$7,762
State:
$7,972
(% of AGI for various income ranges: 43.6% for AGIs $25k-50k, 71.8% for AGIs $50k-75k, 105.6% for AGIs $75k-100k, 214.5% for AGIs $100k-200k, 700.0% for AGIs over 200k)
Earned income credit: $1,939 (reported on 8.2% of returns)
Here:
$1,939
State:
$2,251
(% of AGI for various income ranges: 44.9% for AGIs below $25k, 44.0% for AGIs $25k-50k)
Percentage of individuals using paid preparers for their 2020 taxes: 91.5%
Here:
91%
State:
93%
(% for various income ranges: 89.0% for AGIs below $25k, 93.8% for AGIs $25k-50k, 91.1% for AGIs $50k-75k, 92.3% for AGIs $75k-100k, 92.5% for AGIs $100k-200k, 93.8% for AGIs over 200k)
Averages for the 2012 tax year for zip code 48353, filed in 2013:
Average Adjusted Gross Income (AGI) in 2012: $64,628 (Individual Income Tax Returns)
Here:
$64,628
State:
$55,609
Salary/wage: $53,849 (reported on 82.5% of returns)
Here:
$53,849
State:
$46,782
(% of AGI for various income ranges: 67.5% for AGIs below $25k, 69.1% for AGIs $25k-50k, 71.7% for AGIs $50k-75k, 73.0% for AGIs $75k-100k, 79.6% for AGIs $100k-200k, 41.9% for AGIs over 200k)
Taxable interest for individuals: $921 (reported on 37.3% of returns)
This zip code:
$921
Michigan:
$1,491
(% of AGI for various income ranges: 1.9% for AGIs below $25k, 0.9% for AGIs $25k-50k, 0.3% for AGIs $50k-75k, 0.5% for AGIs $75k-100k, 0.3% for AGIs $100k-200k, 0.5% for AGIs over 200k)
Ordinary dividends: $3,091 (reported on 23.6% of returns)
Here:
$3,091
State:
$6,225
(% of AGI for various income ranges: 2.0% for AGIs below $25k, 1.0% for AGIs $25k-50k, 0.9% for AGIs $50k-75k, 0.9% for AGIs $75k-100k, 0.8% for AGIs $100k-200k, 1.9% for AGIs over 200k)
Net capital gain/loss in AGI: +$2,300 (reported on 19.1% of returns)
Here:
+$2,300
State:
+$9,326
(% of AGI for various income ranges: 0.7% for AGIs $100k-200k, 2.6% for AGIs over 200k)
Profit/loss from business: +$13,160 (reported on 13.4% of returns)
Here:
+$13,160
State:
+$11,523
(% of AGI for various income ranges: 5.0% for AGIs below $25k, 2.8% for AGIs $25k-50k, 2.0% for AGIs $50k-75k, 2.0% for AGIs $75k-100k, 4.3% for AGIs $100k-200k)
Taxable individual retirement arrangement distribution: $16,414 (reported on 13.7% of returns)
48353:
$16,414
Michigan:
$15,298
(% of AGI for various income ranges: 4.6% for AGIs below $25k, 3.7% for AGIs $25k-50k, 3.9% for AGIs $50k-75k, 4.9% for AGIs $75k-100k, 4.2% for AGIs $100k-200k)
Total itemized deductions: $21,164 (19% of AGI, reported on 39.5% of returns)
Here:
$21,164
State:
$21,628
Here:
18.8% of AGI
State:
18.4% of AGI
(% of AGI for various income ranges: 11.4% for AGIs below $25k, 10.5% for AGIs $25k-50k, 12.6% for AGIs $50k-75k, 14.3% for AGIs $75k-100k, 14.3% for AGIs $100k-200k, 11.3% for AGIs over 200k)
Charity contributions: $3,001 (reported on 33.8% of returns)
Here:
$3,001
State:
$4,225
(% of AGI for various income ranges: 0.6% for AGIs below $25k, 1.3% for AGIs $25k-50k, 1.4% for AGIs $50k-75k, 1.7% for AGIs $75k-100k, 2.0% for AGIs $100k-200k, 1.2% for AGIs over 200k)
Taxes paid: $8,209 (reported on 39.5% of returns)
48353:
$8,209
State:
$8,327
(% of AGI for various income ranges: 2.2% for AGIs below $25k, 2.7% for AGIs $25k-50k, 3.7% for AGIs $50k-75k, 4.7% for AGIs $75k-100k, 5.6% for AGIs $100k-200k, 7.4% for AGIs over 200k)
Earned income credit: $1,984 (reported on 10.2% of returns)
Here:
$1,984
State:
$2,306
(% of AGI for various income ranges: 3.7% for AGIs below $25k, 0.8% for AGIs $25k-50k)
Percentage of individuals using paid preparers for their 2012 taxes: 52.9%
Here:
53%
State:
57%
(% for various income ranges: 47.3% for AGIs below $25k, 54.4% for AGIs $25k-50k, 60.0% for AGIs $50k-75k, 52.8% for AGIs $75k-100k, 52.7% for AGIs $100k-200k, 77.8% for AGIs over 200k)
Averages for the 2004 tax year for zip code 48353, filed in 2005:
Average Adjusted Gross Income (AGI) in 2004: $57,022 (Individual Income Tax Returns)
Here:
$57,022
State:
$48,204
Salary/wage: $52,289 (reported on 85.6% of returns)
Here:
$52,289
State:
$42,791
(% of AGI for various income ranges: 114.7% for AGIs below $10k, 63.6% for AGIs $10k-25k, 72.5% for AGIs $25k-50k, 81.4% for AGIs $50k-75k, 84.5% for AGIs $75k-100k, 76.9% for AGIs over 100k)
Taxable interest for individuals: $1,242 (reported on 55.8% of returns)
This zip code:
$1,242
Michigan:
$1,725
(% of AGI for various income ranges: 5.7% for AGIs below $10k, 2.3% for AGIs $10k-25k, 2.0% for AGIs $25k-50k, 1.1% for AGIs $50k-75k, 0.9% for AGIs $75k-100k, 1.0% for AGIs over 100k)
Taxable dividends: $1,696 (reported on 32.0% of returns)
Here:
$1,696
State:
$3,420
(% of AGI for various income ranges: 4.5% for AGIs below $10k, 2.0% for AGIs $10k-25k, 1.3% for AGIs $25k-50k, 0.8% for AGIs $50k-75k, 0.6% for AGIs $75k-100k, 0.9% for AGIs over 100k)
Net capital gain/loss: +$4,781 (reported on 23.2% of returns)
Here:
+$4,781
State:
+$8,532
(% of AGI for various income ranges: -0.5% for AGIs below $10k, 0.9% for AGIs $10k-25k, 0.2% for AGIs $25k-50k, 0.4% for AGIs $50k-75k, 0.9% for AGIs $75k-100k, 3.7% for AGIs over 100k)
Profit/loss from business: +$9,998 (reported on 14.9% of returns)
Here:
+$9,998
State:
+$9,547
(% of AGI for various income ranges: 4.9% for AGIs below $10k, 7.1% for AGIs $10k-25k, 3.9% for AGIs $25k-50k, 1.9% for AGIs $50k-75k, 1.2% for AGIs $75k-100k, 2.7% for AGIs over 100k)
IRA payment deduction: $3,068 (reported on 2.5% of returns)
48353:
$3,068
Michigan:
$2,875
(% of AGI for various income ranges: 0.3% for AGIs $25k-50k, 0.2% for AGIs $50k-75k, 0.1% for AGIs $75k-100k, 0.1% for AGIs over 100k)
Self-employed pension: $7,579 (reported on 0.6% of returns)
Here:
$7,579
Michigan:
$13,826
Total itemized deductions: $18,816 (21% of AGI, reported on 51.6% of returns)
Here:
$18,816
State:
$18,509
Here:
21.4% of AGI
State:
20.7% of AGI
(% of AGI for various income ranges: 27.3% for AGIs below $10k, 15.2% for AGIs $10k-25k, 17.1% for AGIs $25k-50k, 19.3% for AGIs $50k-75k, 20.0% for AGIs $75k-100k, 14.6% for AGIs over 100k)
Charity contributions deductions: $2,599 (3% of AGI, reported on 47.0% of returns)
Here:
$2,599
State:
$3,365
Here:
2.9% of AGI
State:
3.6% of AGI
(% of AGI for various income ranges: 0.9% for AGIs below $10k, 1.5% for AGIs $10k-25k, 1.9% for AGIs $25k-50k, 2.2% for AGIs $50k-75k, 2.7% for AGIs $75k-100k, 2.1% for AGIs over 100k)
Total tax: $8,380 (reported on 80.4% of returns)
48353:
$8,380
State:
$7,691
(% of AGI for various income ranges: 4.0% for AGIs below $10k, 4.5% for AGIs $10k-25k, 7.0% for AGIs $25k-50k, 8.2% for AGIs $50k-75k, 9.4% for AGIs $75k-100k, 16.8% for AGIs over 100k)
Earned income credit: $1,526 (reported on 7.2% of returns)
Here:
$1,526
State:
$1,737
Percentage of individuals using paid preparers for their 2004 taxes: 56.3%
Here:
56%
State:
60%
(% for various income ranges: 46.2% for AGIs below $10k, 56.2% for AGIs $10k-25k, 58.1% for AGIs $25k-50k, 61.6% for AGIs $50k-75k, 56.6% for AGIs $75k-100k, 61.2% for AGIs over 100k)
Likely homosexual households (counted as self-reported same-sex unmarried-partner households)
Lesbian couples: 0.7% of all households
Gay men: 0.0% of all households
Household received Food Stamps/SNAP in the past 12 months: 56 Household did not receive Food Stamps/SNAP in the past 12 months: 2,834
Women who had a birth in the past 12 months: 48 (39 now married, 10 unmarried) Women who did not have a birth in the past 12 months: 1,698 (538 now married, 1,163 unmarried)
Housing units in zip code 48353 with a mortgage: 1,668 (92 second mortgage, 85 both second mortgage and home equity loan) Houses without a mortgage: 67
Median monthly owner costs for units with a mortgage: $1,596 Median monthly owner costs for units without a mortgage: $673
Residents with income below the poverty level in 2022:
This zip code:
6.7%
Whole state:
13.4%
Residents with income below 50% of the poverty level in 2022:
This zip code:
0.8%
Whole state:
6.9%
Median number of rooms in houses and condos:
Here:
6.5
State:
6.5
Median number of rooms in apartments:
Here:
7.3
State:
4.3
Notable locations in this zip code not listed on our city pages
Notable locations in zip code 48353: Fair Haven Camp (A), Salem Lutheran Church Campground (B), Dunham Hills Golf Club (C), Hartland Glen Golf Club (D), Hartland Deerfield Fire Authority Station 61 Main Station (E), Cromaine Library (F). Display/hide their locations on the map
Churches in zip code 48353 include: Our Savior Church (A), Ore Creek Community Church (B), Hartland United Methodist Church (C), Victory Baptist Church (D), Fellowship Bible Church (E), All Saints Lutheran Church (F). Display/hide their locations on the map
Lakes and reservoirs: Dollar Lake (A), Handy Lake (B), Maxfield Lake (C), Hartland Millpond (D), Silver Lake (E), Round Lake (F), Bullard Lake (G). Display/hide their locations on the map
Parks in zip code 48353 include: Florence B Deering Museum Historical Marker (1), Hartland Burying Ground Historical Marker (2), Hartland Music Hall Historical Marker (3). Display/hide their locations on the map
1,026 married couples with children.
87 single-parent households (41 men, 46 women).
93.8% of residents of 48353 zip code speak English at home.
3.7% of residents speak Spanish at home (43% very well, 37% well, 21% not well).
1.4% of residents speak other Indo-European language at home (100% very well).
0.6% of residents speak Asian or Pacific Island language at home (61% very well, 16% not well, 24% not at all).
0.7% of residents speak other language at home (100% very well).
Foreign born population: 549 (7.8%) (81.8% of them are naturalized citizens)
This zip code:
7.8%
Whole state:
6.9%
23%Poland
16%Honduras
11%Japan
10%Serbia
9%Georgia
8%Chile
2%Norway
13%American
10%German
9%European
9%English
7%Polish
4%Romanian
4%Irish
Year of entry for the foreign-born population
542010 or later
962000 to 2009
2021990 to 1999
183Before 1990
Facilities with environmental interests located in this zip code:
ALTERNATIVE EDUCATION (10235 SCHOOL STREET in HARTLAND, MI)
(National Center for Education Statistics) - STATE ID-05150 Organizations: HARTLAND CONSOLIDATED SCHOOLS (SCHOOL DISTRICT)
BOGLE INVESTMENTS INC (10972 HIGHLAND RD in HARTLAND, MI)
(Resource Conservation and Recovery Act (tracking hazardous waste)) Business NAICS classification: CAR WASHES. Organizations: BOGLE INVESTMENTS IND (CONTACT/OWNER)
MI DEPT/TRANSPORTATION BRIDGE B03B04-470 (US-23 AT ORE CREEK B03&4-47014 in HARTLAND, MI)
(Resource Conservation and Recovery Act (tracking hazardous waste)) Organizations: MICH DEPT OF TRANSPORTATION (CONTACT/OPERATOR)
Alternative names: MIDOT BRIDGE US-23 OVER ORE CREEK
AMOCO OIL CO 5827 (US 23 AND M59 in HARTLAND, MI)
(Resource Conservation and Recovery Act (tracking hazardous waste))
DOZING & EXCAVATING CO (CULLEN RD SOUTH OF PARSHALLVIL in HARTLAND, MI)
(Resource Conservation and Recovery Act (tracking hazardous waste))
Housing units lacking complete plumbing facilities: 1.4% Housing units lacking complete kitchen facilities: 1.2%
91.5%Utility gas
3.5%Bottled, tank, or LP gas
3.0%Electricity
1.0%Other fuel
0.6%Wood
Population in 1990: 4,584. Population change in the 1990s: +1,534 (+33.5%).
Place of birth for U.S.-born residents:
This state: 5,308
Northeast: 318
Midwest: 538
South: 280
West: 56
53% of the 48353 zip code residents lived in the same house 5 years ago. Out of people who lived in different houses, 25% lived in this county. Out of people who lived in different counties, 50% lived in Michigan.
94% of the 48353 zip code residents lived in the same house 1 year ago. Out of people who lived in different houses, 20% moved from this county. Out of people who lived in different houses, 69% moved from different county within same state. Out of people who lived in different houses, 15% moved from different state.
Private vs. public school enrollment:
Students in private schools in grades 1 to 8 (elementary and middle school): 26
Here:
6.5%
Michigan:
12.4%
Students in private schools in grades 9 to 12 (high school): 55
Here:
15.1%
Michigan:
9.8%
Students in private undergraduate colleges:
Here:
0.0%
Michigan:
14.9%
Occupation by median earnings in the past 12 months ($)
231,499Health diagnosing and treating practitioners and other technical occupations
127,792Management occupations
106,951Architecture and engineering occupations
82,529Computer and mathematical occupations
74,652Production occupations
66,025Construction and extraction occupations
Companies with federal contracts located in this zip code:
HECK INDUSTRIES INCORPORATED (1480 OLD US 23 HWY in HARTLAND, MI; small business)
$3,895 with Army for Hand Tools, Power Driven. Signed on 2004-09-13. Completion date: 2004-09-30.
Top industries in this zip code by the number of employees in 2005:
Detailed PMIC statistics for the following Tracts:7131.00
, 7135.00
2002 - 2018 National Fire Incident Reporting System (NFIRS) incidents
According to the data from the years 2002 - 2018 the average number of fires per year is 28. The highest number of fires - 44 took place in 2002, and the least - 12 in 2016. The data has a declining trend.
When looking into fire subcategories, the most reports belonged to: Structure Fires (43.8%), and Mobile Property/Vehicle Fires (28.7%).
Fire incident types reported to NFIRS in Zip Code 48353


 Nearest zip codes: 48357, 48380, 48114, 48430, 48356, 48381.


 According to the data from the years 2002 - 2018 the average number of fires per year is 28. The highest number of fires - 44 took place in 2002, and the least - 12 in 2016. The data has a declining trend.
 When looking into fire subcategories, the most reports belonged to: Structure Fires (43.8%), and Mobile Property/Vehicle Fires (28.7%).