Estimated zip code population in 2022: 20,969
Zip code population in 2010: 22,078
Zip code population in 2000: 22,303
Houses and condos: 9,082
Renter-occupied apartments: 1,637
% of renters here:
18%State:
27%
March 2022 cost of living index in zip code 48420: 80.9
(low, U.S. average is 100)
Land area: 64.6
sq. mi.
Water area: 0.2
sq. mi.
Population density: 325 people per square mile (very low).
OSM Map
General Map
Google Map
MSN Map
OSM Map
General Map
Google Map
MSN Map
OSM Map
General Map
Google Map
MSN Map
OSM Map
General Map
Google Map
MSN Map
Please wait while loading the map...
Real estate property taxes paid for housing units in 2022:
This zip code:
1.2% ($2,147)Michigan:
1.2% ($2,746)
Median real estate property taxes paid for housing units with mortgages in 2022: $2,178 (1.2%)
Median real estate property taxes paid for housing units with no mortgage in 2022: $2,120 (1.2%)
Profiles of local businesses
Business Search - 14 Million verified businesses
Males: 10,232 Females: 10,736
For population 25 years and over in 48420:
High school or higher: 90.5%Bachelor's degree or higher: 19.0%Graduate or professional degree: 5.5%Unemployed: 5.4%Mean travel time to work (commute): 28.4 minutes
For population 15 years and over in 48420:
Never married: 26.6%Now married: 51.9%Separated: 1.2%Widowed: 8.0%Divorced: 12.4%
Zip code 48420 compared to state average:
Black race population percentage significantly below state average. Median age above state average. Foreign-born population percentage significantly below state average. Length of stay since moving in significantly above state average. Number of college students below state average. Percentage of population with a bachelor's degree or higher below state average. 18,503 88.2% White 824 3.9% Hispanic or Latino 799 3.8% Two or more races 645 3.1% Black 143 0.7% Asian 53 0.3% American Indian
Data:
Median household income ($)
Median household income (% change since 2000)
Household income diversity
Ratio of average income to average house value (%)
Ratio of average income to average rent
Median household income ($) - White
Median household income ($) - Black or African American
Median household income ($) - Asian
Median household income ($) - Hispanic or Latino
Median household income ($) - American Indian and Alaska Native
Median household income ($) - Multirace
Median household income ($) - Other Race
Median household income for houses/condos with a mortgage ($)
Median household income for apartments without a mortgage ($)
Races - White alone (%)
Races - White alone (% change since 2000)
Races - Black alone (%)
Races - Black alone (% change since 2000)
Races - American Indian alone (%)
Races - American Indian alone (% change since 2000)
Races - Asian alone (%)
Races - Asian alone (% change since 2000)
Races - Hispanic (%)
Races - Hispanic (% change since 2000)
Races - Native Hawaiian and Other Pacific Islander alone (%)
Races - Native Hawaiian and Other Pacific Islander alone (% change since 2000)
Races - Two or more races (%)
Races - Two or more races (% change since 2000)
Races - Other race alone (%)
Races - Other race alone (% change since 2000)
Racial diversity
Unemployment (%)
Unemployment (% change since 2000)
Unemployment (%) - White
Unemployment (%) - Black or African American
Unemployment (%) - Asian
Unemployment (%) - Hispanic or Latino
Unemployment (%) - American Indian and Alaska Native
Unemployment (%) - Multirace
Unemployment (%) - Other Race
Population density (people per square mile)
Population - Males (%)
Population - Females (%)
Population - Males (%) - White
Population - Males (%) - Black or African American
Population - Males (%) - Asian
Population - Males (%) - Hispanic or Latino
Population - Males (%) - American Indian and Alaska Native
Population - Males (%) - Multirace
Population - Males (%) - Other Race
Population - Females (%) - White
Population - Females (%) - Black or African American
Population - Females (%) - Asian
Population - Females (%) - Hispanic or Latino
Population - Females (%) - American Indian and Alaska Native
Population - Females (%) - Multirace
Population - Females (%) - Other Race
Coronavirus confirmed cases (May 23, 2024)
Deaths caused by coronavirus (May 23, 2024)
Coronavirus confirmed cases (per 100k population) (May 23, 2024)
Deaths caused by coronavirus (per 100k population) (May 23, 2024)
Daily increase in number of cases (May 23, 2024)
Weekly increase in number of cases (May 23, 2024)
Cases doubled (in days) (May 23, 2024)
Hospitalized patients (Apr 18, 2022)
Negative test results (Apr 18, 2022)
Total test results (Apr 18, 2022)
COVID Vaccine doses distributed (per 100k population) (Sep 19, 2023)
COVID Vaccine doses administered (per 100k population) (Sep 19, 2023)
COVID Vaccine doses distributed (Sep 19, 2023)
COVID Vaccine doses administered (Sep 19, 2023)
Likely homosexual households (%)
Likely homosexual households (% change since 2000)
Likely homosexual households - Lesbian couples (%)
Likely homosexual households - Lesbian couples (% change since 2000)
Likely homosexual households - Gay men (%)
Likely homosexual households - Gay men (% change since 2000)
Cost of living index
Median gross rent ($)
Median contract rent ($)
Median monthly housing costs ($)
Median house or condo value ($)
Median house or condo value ($ change since 2000)
Mean house or condo value by units in structure - 1, detached ($)
Mean house or condo value by units in structure - 1, attached ($)
Mean house or condo value by units in structure - 2 ($)
Mean house or condo value by units in structure by units in structure - 3 or 4 ($)
Mean house or condo value by units in structure - 5 or more ($)
Mean house or condo value by units in structure - Boat, RV, van, etc. ($)
Mean house or condo value by units in structure - Mobile home ($)
Median house or condo value ($) - White
Median house or condo value ($) - Black or African American
Median house or condo value ($) - Asian
Median house or condo value ($) - Hispanic or Latino
Median house or condo value ($) - American Indian and Alaska Native
Median house or condo value ($) - Multirace
Median house or condo value ($) - Other Race
Median resident age
Resident age diversity
Median resident age - Males
Median resident age - Females
Median resident age - White
Median resident age - Black or African American
Median resident age - Asian
Median resident age - Hispanic or Latino
Median resident age - American Indian and Alaska Native
Median resident age - Multirace
Median resident age - Other Race
Median resident age - Males - White
Median resident age - Males - Black or African American
Median resident age - Males - Asian
Median resident age - Males - Hispanic or Latino
Median resident age - Males - American Indian and Alaska Native
Median resident age - Males - Multirace
Median resident age - Males - Other Race
Median resident age - Females - White
Median resident age - Females - Black or African American
Median resident age - Females - Asian
Median resident age - Females - Hispanic or Latino
Median resident age - Females - American Indian and Alaska Native
Median resident age - Females - Multirace
Median resident age - Females - Other Race
Commute - mean travel time to work (minutes)
Travel time to work - Less than 5 minutes (%)
Travel time to work - Less than 5 minutes (% change since 2000)
Travel time to work - 5 to 9 minutes (%)
Travel time to work - 5 to 9 minutes (% change since 2000)
Travel time to work - 10 to 19 minutes (%)
Travel time to work - 10 to 19 minutes (% change since 2000)
Travel time to work - 20 to 29 minutes (%)
Travel time to work - 20 to 29 minutes (% change since 2000)
Travel time to work - 30 to 39 minutes (%)
Travel time to work - 30 to 39 minutes (% change since 2000)
Travel time to work - 40 to 59 minutes (%)
Travel time to work - 40 to 59 minutes (% change since 2000)
Travel time to work - 60 to 89 minutes (%)
Travel time to work - 60 to 89 minutes (% change since 2000)
Travel time to work - 90 or more minutes (%)
Travel time to work - 90 or more minutes (% change since 2000)
Marital status - Never married (%)
Marital status - Now married (%)
Marital status - Separated (%)
Marital status - Widowed (%)
Marital status - Divorced (%)
Median family income ($)
Median family income (% change since 2000)
Median non-family income ($)
Median non-family income (% change since 2000)
Median per capita income ($)
Median per capita income (% change since 2000)
Median family income ($) - White
Median family income ($) - Black or African American
Median family income ($) - Asian
Median family income ($) - Hispanic or Latino
Median family income ($) - American Indian and Alaska Native
Median family income ($) - Multirace
Median family income ($) - Other Race
Median year house/condo built
Median year apartment built
Year house built - Built 2005 or later (%)
Year house built - Built 2000 to 2004 (%)
Year house built - Built 1990 to 1999 (%)
Year house built - Built 1980 to 1989 (%)
Year house built - Built 1970 to 1979 (%)
Year house built - Built 1960 to 1969 (%)
Year house built - Built 1950 to 1959 (%)
Year house built - Built 1940 to 1949 (%)
Year house built - Built 1939 or earlier (%)
Average household size
Household density (households per square mile)
Average household size - White
Average household size - Black or African American
Average household size - Asian
Average household size - Hispanic or Latino
Average household size - American Indian and Alaska Native
Average household size - Multirace
Average household size - Other Race
Occupied housing units (%)
Vacant housing units (%)
Owner occupied housing units (%)
Renter occupied housing units (%)
Vacancy status - For rent (%)
Vacancy status - For sale only (%)
Vacancy status - Rented or sold, not occupied (%)
Vacancy status - For seasonal, recreational, or occasional use (%)
Vacancy status - For migrant workers (%)
Vacancy status - Other vacant (%)
Residents with income below the poverty level (%)
Residents with income below 50% of the poverty level (%)
Children below poverty level (%)
Poor families by family type - Married-couple family (%)
Poor families by family type - Male, no wife present (%)
Poor families by family type - Female, no husband present (%)
Poverty status for native-born residents (%)
Poverty status for foreign-born residents (%)
Poverty among high school graduates not in families (%)
Poverty among people who did not graduate high school not in families (%)
Residents with income below the poverty level (%) - White
Residents with income below the poverty level (%) - Black or African American
Residents with income below the poverty level (%) - Asian
Residents with income below the poverty level (%) - Hispanic or Latino
Residents with income below the poverty level (%) - American Indian and Alaska Native
Residents with income below the poverty level (%) - Multirace
Residents with income below the poverty level (%) - Other Race
Air pollution - Air Quality Index (AQI)
Air pollution - CO
Air pollution - NO2
Air pollution - SO2
Air pollution - Ozone
Air pollution - PM10
Air pollution - PM25
Air pollution - Pb
Crime - Murders per 100,000 population
Crime - Rapes per 100,000 population
Crime - Robberies per 100,000 population
Crime - Assaults per 100,000 population
Crime - Burglaries per 100,000 population
Crime - Thefts per 100,000 population
Crime - Auto thefts per 100,000 population
Crime - Arson per 100,000 population
Crime - City-data.com crime index
Crime - Violent crime index
Crime - Property crime index
Crime - Murders per 100,000 population (5 year average)
Crime - Rapes per 100,000 population (5 year average)
Crime - Robberies per 100,000 population (5 year average)
Crime - Assaults per 100,000 population (5 year average)
Crime - Burglaries per 100,000 population (5 year average)
Crime - Thefts per 100,000 population (5 year average)
Crime - Auto thefts per 100,000 population (5 year average)
Crime - Arson per 100,000 population (5 year average)
Crime - City-data.com crime index (5 year average)
Crime - Violent crime index (5 year average)
Crime - Property crime index (5 year average)
1996 Presidential Elections Results (%) - Democratic Party (Clinton)
1996 Presidential Elections Results (%) - Republican Party (Dole)
1996 Presidential Elections Results (%) - Other
2000 Presidential Elections Results (%) - Democratic Party (Gore)
2000 Presidential Elections Results (%) - Republican Party (Bush)
2000 Presidential Elections Results (%) - Other
2004 Presidential Elections Results (%) - Democratic Party (Kerry)
2004 Presidential Elections Results (%) - Republican Party (Bush)
2004 Presidential Elections Results (%) - Other
2008 Presidential Elections Results (%) - Democratic Party (Obama)
2008 Presidential Elections Results (%) - Republican Party (McCain)
2008 Presidential Elections Results (%) - Other
2012 Presidential Elections Results (%) - Democratic Party (Obama)
2012 Presidential Elections Results (%) - Republican Party (Romney)
2012 Presidential Elections Results (%) - Other
2016 Presidential Elections Results (%) - Democratic Party (Clinton)
2016 Presidential Elections Results (%) - Republican Party (Trump)
2016 Presidential Elections Results (%) - Other
2020 Presidential Elections Results (%) - Democratic Party (Biden)
2020 Presidential Elections Results (%) - Republican Party (Trump)
2020 Presidential Elections Results (%) - Other
Ancestries Reported - Arab (%)
Ancestries Reported - Czech (%)
Ancestries Reported - Danish (%)
Ancestries Reported - Dutch (%)
Ancestries Reported - English (%)
Ancestries Reported - French (%)
Ancestries Reported - French Canadian (%)
Ancestries Reported - German (%)
Ancestries Reported - Greek (%)
Ancestries Reported - Hungarian (%)
Ancestries Reported - Irish (%)
Ancestries Reported - Italian (%)
Ancestries Reported - Lithuanian (%)
Ancestries Reported - Norwegian (%)
Ancestries Reported - Polish (%)
Ancestries Reported - Portuguese (%)
Ancestries Reported - Russian (%)
Ancestries Reported - Scotch-Irish (%)
Ancestries Reported - Scottish (%)
Ancestries Reported - Slovak (%)
Ancestries Reported - Subsaharan African (%)
Ancestries Reported - Swedish (%)
Ancestries Reported - Swiss (%)
Ancestries Reported - Ukrainian (%)
Ancestries Reported - United States (%)
Ancestries Reported - Welsh (%)
Ancestries Reported - West Indian (%)
Ancestries Reported - Other (%)
Educational Attainment - No schooling completed (%)
Educational Attainment - Less than high school (%)
Educational Attainment - High school or equivalent (%)
Educational Attainment - Less than 1 year of college (%)
Educational Attainment - 1 or more years of college (%)
Educational Attainment - Associate degree (%)
Educational Attainment - Bachelor's degree (%)
Educational Attainment - Master's degree (%)
Educational Attainment - Professional school degree (%)
Educational Attainment - Doctorate degree (%)
School Enrollment - Nursery, preschool (%)
School Enrollment - Kindergarten (%)
School Enrollment - Grade 1 to 4 (%)
School Enrollment - Grade 5 to 8 (%)
School Enrollment - Grade 9 to 12 (%)
School Enrollment - College undergrad (%)
School Enrollment - Graduate or professional (%)
School Enrollment - Not enrolled in school (%)
School enrollment - Public schools (%)
School enrollment - Private schools (%)
School enrollment - Not enrolled (%)
Median number of rooms in houses and condos
Median number of rooms in apartments
Housing units lacking complete plumbing facilities (%)
Housing units lacking complete kitchen facilities (%)
Density of houses
Urban houses (%)
Rural houses (%)
Households with people 60 years and over (%)
Households with people 65 years and over (%)
Households with people 75 years and over (%)
Households with one or more nonrelatives (%)
Households with no nonrelatives (%)
Population in households (%)
Family households (%)
Nonfamily households (%)
Population in families (%)
Family households with own children (%)
Median number of bedrooms in owner occupied houses
Mean number of bedrooms in owner occupied houses
Median number of bedrooms in renter occupied houses
Mean number of bedrooms in renter occupied houses
Median number of vehichles in owner occupied houses
Mean number of vehichles in owner occupied houses
Median number of vehichles in renter occupied houses
Mean number of vehichles in renter occupied houses
Mortgage status - with mortgage (%)
Mortgage status - with second mortgage (%)
Mortgage status - with home equity loan (%)
Mortgage status - with both second mortgage and home equity loan (%)
Mortgage status - without a mortgage (%)
Average family size
Average family size - White
Average family size - Black or African American
Average family size - Asian
Average family size - Hispanic or Latino
Average family size - American Indian and Alaska Native
Average family size - Multirace
Average family size - Other Race
Geographical mobility - Same house 1 year ago (%)
Geographical mobility - Moved within same county (%)
Geographical mobility - Moved from different county within same state (%)
Geographical mobility - Moved from different state (%)
Geographical mobility - Moved from abroad (%)
Place of birth - Born in state of residence (%)
Place of birth - Born in other state (%)
Place of birth - Native, outside of US (%)
Place of birth - Foreign born (%)
Housing units in structures - 1, detached (%)
Housing units in structures - 1, attached (%)
Housing units in structures - 2 (%)
Housing units in structures - 3 or 4 (%)
Housing units in structures - 5 to 9 (%)
Housing units in structures - 10 to 19 (%)
Housing units in structures - 20 to 49 (%)
Housing units in structures - 50 or more (%)
Housing units in structures - Mobile home (%)
Housing units in structures - Boat, RV, van, etc. (%)
House/condo owner moved in on average (years ago)
Renter moved in on average (years ago)
Year householder moved into unit - Moved in 1999 to March 2000 (%)
Year householder moved into unit - Moved in 1995 to 1998 (%)
Year householder moved into unit - Moved in 1990 to 1994 (%)
Year householder moved into unit - Moved in 1980 to 1989 (%)
Year householder moved into unit - Moved in 1970 to 1979 (%)
Year householder moved into unit - Moved in 1969 or earlier (%)
Means of transportation to work - Drove car alone (%)
Means of transportation to work - Carpooled (%)
Means of transportation to work - Public transportation (%)
Means of transportation to work - Bus or trolley bus (%)
Means of transportation to work - Streetcar or trolley car (%)
Means of transportation to work - Subway or elevated (%)
Means of transportation to work - Railroad (%)
Means of transportation to work - Ferryboat (%)
Means of transportation to work - Taxicab (%)
Means of transportation to work - Motorcycle (%)
Means of transportation to work - Bicycle (%)
Means of transportation to work - Walked (%)
Means of transportation to work - Other means (%)
Working at home (%)
Industry diversity
Most Common Industries - Agriculture, forestry, fishing and hunting, and mining (%)
Most Common Industries - Agriculture, forestry, fishing and hunting (%)
Most Common Industries - Mining, quarrying, and oil and gas extraction (%)
Most Common Industries - Construction (%)
Most Common Industries - Manufacturing (%)
Most Common Industries - Wholesale trade (%)
Most Common Industries - Retail trade (%)
Most Common Industries - Transportation and warehousing, and utilities (%)
Most Common Industries - Transportation and warehousing (%)
Most Common Industries - Utilities (%)
Most Common Industries - Information (%)
Most Common Industries - Finance and insurance, and real estate and rental and leasing (%)
Most Common Industries - Finance and insurance (%)
Most Common Industries - Real estate and rental and leasing (%)
Most Common Industries - Professional, scientific, and management, and administrative and waste management services (%)
Most Common Industries - Professional, scientific, and technical services (%)
Most Common Industries - Management of companies and enterprises (%)
Most Common Industries - Administrative and support and waste management services (%)
Most Common Industries - Educational services, and health care and social assistance (%)
Most Common Industries - Educational services (%)
Most Common Industries - Health care and social assistance (%)
Most Common Industries - Arts, entertainment, and recreation, and accommodation and food services (%)
Most Common Industries - Arts, entertainment, and recreation (%)
Most Common Industries - Accommodation and food services (%)
Most Common Industries - Other services, except public administration (%)
Most Common Industries - Public administration (%)
Occupation diversity
Most Common Occupations - Management, business, science, and arts occupations (%)
Most Common Occupations - Management, business, and financial occupations (%)
Most Common Occupations - Management occupations (%)
Most Common Occupations - Business and financial operations occupations (%)
Most Common Occupations - Computer, engineering, and science occupations (%)
Most Common Occupations - Computer and mathematical occupations (%)
Most Common Occupations - Architecture and engineering occupations (%)
Most Common Occupations - Life, physical, and social science occupations (%)
Most Common Occupations - Education, legal, community service, arts, and media occupations (%)
Most Common Occupations - Community and social service occupations (%)
Most Common Occupations - Legal occupations (%)
Most Common Occupations - Education, training, and library occupations (%)
Most Common Occupations - Arts, design, entertainment, sports, and media occupations (%)
Most Common Occupations - Healthcare practitioners and technical occupations (%)
Most Common Occupations - Health diagnosing and treating practitioners and other technical occupations (%)
Most Common Occupations - Health technologists and technicians (%)
Most Common Occupations - Service occupations (%)
Most Common Occupations - Healthcare support occupations (%)
Most Common Occupations - Protective service occupations (%)
Most Common Occupations - Fire fighting and prevention, and other protective service workers including supervisors (%)
Most Common Occupations - Law enforcement workers including supervisors (%)
Most Common Occupations - Food preparation and serving related occupations (%)
Most Common Occupations - Building and grounds cleaning and maintenance occupations (%)
Most Common Occupations - Personal care and service occupations (%)
Most Common Occupations - Sales and office occupations (%)
Most Common Occupations - Sales and related occupations (%)
Most Common Occupations - Office and administrative support occupations (%)
Most Common Occupations - Natural resources, construction, and maintenance occupations (%)
Most Common Occupations - Farming, fishing, and forestry occupations (%)
Most Common Occupations - Construction and extraction occupations (%)
Most Common Occupations - Installation, maintenance, and repair occupations (%)
Most Common Occupations - Production, transportation, and material moving occupations (%)
Most Common Occupations - Production occupations (%)
Most Common Occupations - Transportation occupations (%)
Most Common Occupations - Material moving occupations (%)
People in Group quarters - Institutionalized population (%)
People in Group quarters - Correctional institutions (%)
People in Group quarters - Federal prisons and detention centers (%)
People in Group quarters - Halfway houses (%)
People in Group quarters - Local jails and other confinement facilities (including police lockups) (%)
People in Group quarters - Military disciplinary barracks (%)
People in Group quarters - State prisons (%)
People in Group quarters - Other types of correctional institutions (%)
People in Group quarters - Nursing homes (%)
People in Group quarters - Hospitals/wards, hospices, and schools for the handicapped (%)
People in Group quarters - Hospitals/wards and hospices for chronically ill (%)
People in Group quarters - Hospices or homes for chronically ill (%)
People in Group quarters - Military hospitals or wards for chronically ill (%)
People in Group quarters - Other hospitals or wards for chronically ill (%)
People in Group quarters - Hospitals or wards for drug/alcohol abuse (%)
People in Group quarters - Mental (Psychiatric) hospitals or wards (%)
People in Group quarters - Schools, hospitals, or wards for the mentally retarded (%)
People in Group quarters - Schools, hospitals, or wards for the physically handicapped (%)
People in Group quarters - Institutions for the deaf (%)
People in Group quarters - Institutions for the blind (%)
People in Group quarters - Orthopedic wards and institutions for the physically handicapped (%)
People in Group quarters - Wards in general hospitals for patients who have no usual home elsewhere (%)
People in Group quarters - Wards in military hospitals for patients who have no usual home elsewhere (%)
People in Group quarters - Juvenile institutions (%)
People in Group quarters - Long-term care (%)
People in Group quarters - Homes for abused, dependent, and neglected children (%)
People in Group quarters - Residential treatment centers for emotionally disturbed children (%)
People in Group quarters - Training schools for juvenile delinquents (%)
People in Group quarters - Short-term care, detention or diagnostic centers for delinquent children (%)
People in Group quarters - Type of juvenile institution unknown (%)
People in Group quarters - Noninstitutionalized population (%)
People in Group quarters - College dormitories (includes college quarters off campus) (%)
People in Group quarters - Military quarters (%)
People in Group quarters - On base (%)
People in Group quarters - Barracks, unaccompanied personnel housing (UPH), (Enlisted/Officer), ;and similar group living quarters for military personnel (%)
People in Group quarters - Transient quarters for temporary residents (%)
People in Group quarters - Military ships (%)
People in Group quarters - Group homes (%)
People in Group quarters - Homes or halfway houses for drug/alcohol abuse (%)
People in Group quarters - Homes for the mentally ill (%)
People in Group quarters - Homes for the mentally retarded (%)
People in Group quarters - Homes for the physically handicapped (%)
People in Group quarters - Other group homes (%)
People in Group quarters - Religious group quarters (%)
People in Group quarters - Dormitories (%)
People in Group quarters - Agriculture workers' dormitories on farms (%)
People in Group quarters - Job Corps and vocational training facilities (%)
People in Group quarters - Other workers' dormitories (%)
People in Group quarters - Crews of maritime vessels (%)
People in Group quarters - Other nonhousehold living situations (%)
People in Group quarters - Other noninstitutional group quarters (%)
Residents speaking English at home (%)
Residents speaking English at home - Born in the United States (%)
Residents speaking English at home - Native, born elsewhere (%)
Residents speaking English at home - Foreign born (%)
Residents speaking Spanish at home (%)
Residents speaking Spanish at home - Born in the United States (%)
Residents speaking Spanish at home - Native, born elsewhere (%)
Residents speaking Spanish at home - Foreign born (%)
Residents speaking other language at home (%)
Residents speaking other language at home - Born in the United States (%)
Residents speaking other language at home - Native, born elsewhere (%)
Residents speaking other language at home - Foreign born (%)
Class of Workers - Employee of private company (%)
Class of Workers - Self-employed in own incorporated business (%)
Class of Workers - Private not-for-profit wage and salary workers (%)
Class of Workers - Local government workers (%)
Class of Workers - State government workers (%)
Class of Workers - Federal government workers (%)
Class of Workers - Self-employed workers in own not incorporated business and Unpaid family workers (%)
House heating fuel used in houses and condos - Utility gas (%)
House heating fuel used in houses and condos - Bottled, tank, or LP gas (%)
House heating fuel used in houses and condos - Electricity (%)
House heating fuel used in houses and condos - Fuel oil, kerosene, etc. (%)
House heating fuel used in houses and condos - Coal or coke (%)
House heating fuel used in houses and condos - Wood (%)
House heating fuel used in houses and condos - Solar energy (%)
House heating fuel used in houses and condos - Other fuel (%)
House heating fuel used in houses and condos - No fuel used (%)
House heating fuel used in apartments - Utility gas (%)
House heating fuel used in apartments - Bottled, tank, or LP gas (%)
House heating fuel used in apartments - Electricity (%)
House heating fuel used in apartments - Fuel oil, kerosene, etc. (%)
House heating fuel used in apartments - Coal or coke (%)
House heating fuel used in apartments - Wood (%)
House heating fuel used in apartments - Solar energy (%)
House heating fuel used in apartments - Other fuel (%)
House heating fuel used in apartments - No fuel used (%)
Armed forces status - In Armed Forces (%)
Armed forces status - Civilian (%)
Armed forces status - Civilian - Veteran (%)
Armed forces status - Civilian - Nonveteran (%)
Fatal accidents locations in years 2005-2021
Fatal accidents locations in 2005
Fatal accidents locations in 2006
Fatal accidents locations in 2007
Fatal accidents locations in 2008
Fatal accidents locations in 2009
Fatal accidents locations in 2010
Fatal accidents locations in 2011
Fatal accidents locations in 2012
Fatal accidents locations in 2013
Fatal accidents locations in 2014
Fatal accidents locations in 2015
Fatal accidents locations in 2016
Fatal accidents locations in 2017
Fatal accidents locations in 2018
Fatal accidents locations in 2019
Fatal accidents locations in 2020
Fatal accidents locations in 2021
Alcohol use - People drinking some alcohol every month (%)
Alcohol use - People not drinking at all (%)
Alcohol use - Average days/month drinking alcohol
Alcohol use - Average drinks/week
Alcohol use - Average days/year people drink much
Audiometry - Average condition of hearing (%)
Audiometry - People that can hear a whisper from across a quiet room (%)
Audiometry - People that can hear normal voice from across a quiet room (%)
Audiometry - Ears ringing, roaring, buzzing (%)
Audiometry - Had a job exposure to loud noise (%)
Audiometry - Had off-work exposure to loud noise (%)
Blood Pressure & Cholesterol - Has high blood pressure (%)
Blood Pressure & Cholesterol - Checking blood pressure at home (%)
Blood Pressure & Cholesterol - Frequently checking blood cholesterol (%)
Blood Pressure & Cholesterol - Has high cholesterol level (%)
Consumer Behavior - Money monthly spent on food at supermarket/grocery store
Consumer Behavior - Money monthly spent on food at other stores
Consumer Behavior - Money monthly spent on eating out
Consumer Behavior - Money monthly spent on carryout/delivered foods
Consumer Behavior - Income spent on food at supermarket/grocery store (%)
Consumer Behavior - Income spent on food at other stores (%)
Consumer Behavior - Income spent on eating out (%)
Consumer Behavior - Income spent on carryout/delivered foods (%)
Current Health Status - General health condition (%)
Current Health Status - Blood donors (%)
Current Health Status - Has blood ever tested for HIV virus (%)
Current Health Status - Left-handed people (%)
Dermatology - People using sunscreen (%)
Diabetes - Diabetics (%)
Diabetes - Had a blood test for high blood sugar (%)
Diabetes - People taking insulin (%)
Diet Behavior & Nutrition - Diet health (%)
Diet Behavior & Nutrition - Milk product consumption (# of products/month)
Diet Behavior & Nutrition - Meals not home prepared (#/week)
Diet Behavior & Nutrition - Meals from fast food or pizza place (#/week)
Diet Behavior & Nutrition - Ready-to-eat foods (#/month)
Diet Behavior & Nutrition - Frozen meals/pizza (#/month)
Drug Use - People that ever used marijuana or hashish (%)
Drug Use - Ever used hard drugs (%)
Drug Use - Ever used any form of cocaine (%)
Drug Use - Ever used heroin (%)
Drug Use - Ever used methamphetamine (%)
Health Insurance - People covered by health insurance (%)
Kidney Conditions-Urology - Avg. # of times urinating at night
Medical Conditions - People with asthma (%)
Medical Conditions - People with anemia (%)
Medical Conditions - People with psoriasis (%)
Medical Conditions - People with overweight (%)
Medical Conditions - Elderly people having difficulties in thinking or remembering (%)
Medical Conditions - People who ever received blood transfusion (%)
Medical Conditions - People having trouble seeing even with glass/contacts (%)
Medical Conditions - People with arthritis (%)
Medical Conditions - People with gout (%)
Medical Conditions - People with congestive heart failure (%)
Medical Conditions - People with coronary heart disease (%)
Medical Conditions - People with angina pectoris (%)
Medical Conditions - People who ever had heart attack (%)
Medical Conditions - People who ever had stroke (%)
Medical Conditions - People with emphysema (%)
Medical Conditions - People with thyroid problem (%)
Medical Conditions - People with chronic bronchitis (%)
Medical Conditions - People with any liver condition (%)
Medical Conditions - People who ever had cancer or malignancy (%)
Mental Health - People who have little interest in doing things (%)
Mental Health - People feeling down, depressed, or hopeless (%)
Mental Health - People who have trouble sleeping or sleeping too much (%)
Mental Health - People feeling tired or having little energy (%)
Mental Health - People with poor appetite or overeating (%)
Mental Health - People feeling bad about themself (%)
Mental Health - People who have trouble concentrating on things (%)
Mental Health - People moving or speaking slowly or too fast (%)
Mental Health - People having thoughts they would be better off dead (%)
Oral Health - Average years since last visit a dentist
Oral Health - People embarrassed because of mouth (%)
Oral Health - People with gum disease (%)
Oral Health - General health of teeth and gums (%)
Oral Health - Average days a week using dental floss/device
Oral Health - Average days a week using mouthwash for dental problem
Oral Health - Average number of teeth
Pesticide Use - Households using pesticides to control insects (%)
Pesticide Use - Households using pesticides to kill weeds (%)
Physical Activity - People doing vigorous-intensity work activities (%)
Physical Activity - People doing moderate-intensity work activities (%)
Physical Activity - People walking or bicycling (%)
Physical Activity - People doing vigorous-intensity recreational activities (%)
Physical Activity - People doing moderate-intensity recreational activities (%)
Physical Activity - Average hours a day doing sedentary activities
Physical Activity - Average hours a day watching TV or videos
Physical Activity - Average hours a day using computer
Physical Functioning - People having limitations keeping them from working (%)
Physical Functioning - People limited in amount of work they can do (%)
Physical Functioning - People that need special equipment to walk (%)
Physical Functioning - People experiencing confusion/memory problems (%)
Physical Functioning - People requiring special healthcare equipment (%)
Prescription Medications - Average number of prescription medicines taking
Preventive Aspirin Use - Adults 40+ taking low-dose aspirin (%)
Reproductive Health - Vaginal deliveries (%)
Reproductive Health - Cesarean deliveries (%)
Reproductive Health - Deliveries resulted in a live birth (%)
Reproductive Health - Pregnancies resulted in a delivery (%)
Reproductive Health - Women breastfeeding newborns (%)
Reproductive Health - Women that had a hysterectomy (%)
Reproductive Health - Women that had both ovaries removed (%)
Reproductive Health - Women that have ever taken birth control pills (%)
Reproductive Health - Women taking birth control pills (%)
Reproductive Health - Women that have ever used Depo-Provera or injectables (%)
Reproductive Health - Women that have ever used female hormones (%)
Sexual Behavior - People 18+ that ever had sex (vaginal, anal, or oral) (%)
Sexual Behavior - Males 18+ that ever had vaginal sex with a woman (%)
Sexual Behavior - Males 18+ that ever performed oral sex on a woman (%)
Sexual Behavior - Males 18+ that ever had anal sex with a woman (%)
Sexual Behavior - Males 18+ that ever had any sex with a man (%)
Sexual Behavior - Females 18+ that ever had vaginal sex with a man (%)
Sexual Behavior - Females 18+ that ever performed oral sex on a man (%)
Sexual Behavior - Females 18+ that ever had anal sex with a man (%)
Sexual Behavior - Females 18+ that ever had any kind of sex with a woman (%)
Sexual Behavior - Average age people first had sex
Sexual Behavior - Average number of female sex partners in lifetime (males 18+)
Sexual Behavior - Average number of female vaginal sex partners in lifetime (males 18+)
Sexual Behavior - Average age people first performed oral sex on a woman (18+)
Sexual Behavior - Average number of woman performed oral sex on in lifetime (18+)
Sexual Behavior - Average number of male sex partners in lifetime (males 18+)
Sexual Behavior - Average number of male anal sex partners in lifetime (males 18+)
Sexual Behavior - Average age people first performed oral sex on a man (18+)
Sexual Behavior - Average number of male oral sex partners in lifetime (18+)
Sexual Behavior - People using protection when performing oral sex (%)
Sexual Behavior - Average number of times people have vaginal or anal sex a year
Sexual Behavior - People having sex without condom (%)
Sexual Behavior - Average number of male sex partners in lifetime (females 18+)
Sexual Behavior - Average number of male vaginal sex partners in lifetime (females 18+)
Sexual Behavior - Average number of female sex partners in lifetime (females 18+)
Sexual Behavior - Circumcised males 18+ (%)
Sleep Disorders - Average hours sleeping at night
Sleep Disorders - People that has trouble sleeping (%)
Smoking-Cigarette Use - People smoking cigarettes (%)
Taste & Smell - People 40+ having problems with smell (%)
Taste & Smell - People 40+ having problems with taste (%)
Taste & Smell - People 40+ that ever had wisdom teeth removed (%)
Taste & Smell - People 40+ that ever had tonsils teeth removed (%)
Taste & Smell - People 40+ that ever had a loss of consciousness because of a head injury (%)
Taste & Smell - People 40+ that ever had a broken nose or other serious injury to face or skull (%)
Taste & Smell - People 40+ that ever had two or more sinus infections (%)
Weight - Average height (inches)
Weight - Average weight (pounds)
Weight - Average BMI
Weight - People that are obese (%)
Weight - People that ever were obese (%)
Weight - People trying to lose weight (%)
Urban population: 8,997
Rural population: 11,971
Estimated median house/condo value in 2022: $178,203
48420:
$178,203Michigan:
$224,400
According to our research of Michigan and other state lists, there were 40 registered sex offenders living in 48420 zip code as of May 23, 2024 . The ratio of all residents to sex offenders in zip code 48420 is 547 to 1.The ratio of registered sex offenders to all residents in this zip code is lower than the state average.
Median resident age: This zip code:
44.3 yearsMichigan median age:
40.3 years
Average household size: This zip code:
2.3 peopleMichigan:
2.4 people
Averages for the 2020 tax year for zip code 48420, filed in 2021:
Average Adjusted Gross Income (AGI) in 2020: $50,581 (Individual Income Tax Returns) Here:
$50,581State:
$68,945
Salary/wage: $45,286 (reported on 73.0% of returns )Here:
$45,286State:
$57,142
(% of AGI for various income ranges: 825.1% for AGIs below $25k , 2681.2% for AGIs $25k-50k , 5459.1% for AGIs $50k-75k , 7953.2% for AGIs $75k-100k , 14752.5% for AGIs $100k-200k , 52474.0% for AGIs over 200k ) Taxable interest for individuals: $859 (reported on 30.6% of returns )This zip code:
$859Michigan:
$1,630
(% of AGI for various income ranges: 13.9% for AGIs below $25k , 22.5% for AGIs $25k-50k , 29.6% for AGIs $50k-75k , 53.0% for AGIs $75k-100k , 83.9% for AGIs $100k-200k , 994.0% for AGIs over 200k ) Ordinary dividends: $3,014 (reported on 13.3% of returns )(% of AGI for various income ranges: 16.8% for AGIs below $25k , 22.2% for AGIs $25k-50k , 60.6% for AGIs $50k-75k , 83.8% for AGIs $75k-100k , 138.9% for AGIs $100k-200k , 1768.0% for AGIs over 200k ) Net capital gain/loss in AGI: +$4,917 (reported on 12.0% of returns )Here:
+$4,917State:
+$20,064
(% of AGI for various income ranges: 4.5% for AGIs below $25k , 17.4% for AGIs $25k-50k , 61.2% for AGIs $50k-75k , 93.1% for AGIs $75k-100k , 302.0% for AGIs $100k-200k , 4074.0% for AGIs over 200k ) Profit/loss from business: +$6,199 (reported on 12.7% of returns )Here:
+$6,199State:
+$11,172
(% of AGI for various income ranges: 72.9% for AGIs below $25k , 86.5% for AGIs $25k-50k , 65.7% for AGIs $50k-75k , 137.3% for AGIs $75k-100k , 268.4% for AGIs $100k-200k , 1020.0% for AGIs over 200k ) Taxable individual retirement arrangement distribution: $14,128 (reported on 9.2% of returns )48420:
$14,128Michigan:
$19,803
(% of AGI for various income ranges: 36.0% for AGIs below $25k , 95.9% for AGIs $25k-50k , 209.5% for AGIs $50k-75k , 304.9% for AGIs $75k-100k , 577.6% for AGIs $100k-200k , 2596.0% for AGIs over 200k ) Total itemized deductions: $28,450 (reported on 2.9% of returns )Here:
$28,450State:
$34,117
(% of AGI for various income ranges: 19.1% for AGIs below $25k , 41.9% for AGIs $25k-50k , 118.7% for AGIs $50k-75k , 179.3% for AGIs $75k-100k , 356.0% for AGIs $100k-200k , 3456.0% for AGIs over 200k ) Charity contributions: $8,544 (reported on 2.4% of returns )(% of AGI for various income ranges: 6.9% for AGIs $25k-50k , 29.3% for AGIs $50k-75k , 43.0% for AGIs $75k-100k , 110.8% for AGIs $100k-200k , 1058.0% for AGIs over 200k ) Taxes paid: $7,184 (reported on 2.9% of returns )(% of AGI for various income ranges: 2.0% for AGIs below $25k , 8.1% for AGIs $25k-50k , 33.2% for AGIs $50k-75k , 49.4% for AGIs $75k-100k , 110.0% for AGIs $100k-200k , 676.0% for AGIs over 200k ) Earned income credit: $2,095 (reported on 13.6% of returns )(% of AGI for various income ranges: 66.6% for AGIs below $25k , 53.2% for AGIs $25k-50k , 1.2% for AGIs $50k-75k ) Percentage of individuals using paid preparers for their 2020 taxes: 94.7%(% for various income ranges: 93.3% for AGIs below $25k , 95.9% for AGIs $25k-50k , 95.2% for AGIs $50k-75k , 96.3% for AGIs $75k-100k , 94.4% for AGIs $100k-200k , 92.9% for AGIs over 200k )
Averages for the 2012 tax year for zip code 48420, filed in 2013:
Average Adjusted Gross Income (AGI) in 2012: $43,519 (Individual Income Tax Returns) Here:
$43,519State:
$55,609
Salary/wage: $35,107 (reported on 82.9% of returns )Here:
$35,107State:
$46,782
(% of AGI for various income ranges: 57.1% for AGIs below $25k , 61.0% for AGIs $25k-50k , 67.6% for AGIs $50k-75k , 71.5% for AGIs $75k-100k , 75.6% for AGIs $100k-200k , 56.7% for AGIs over 200k ) Taxable interest for individuals: $1,002 (reported on 32.5% of returns )This zip code:
$1,002Michigan:
$1,491
(% of AGI for various income ranges: 1.0% for AGIs below $25k , 0.6% for AGIs $25k-50k , 0.7% for AGIs $50k-75k , 0.5% for AGIs $75k-100k , 0.6% for AGIs $100k-200k , 2.1% for AGIs over 200k ) Ordinary dividends: $2,639 (reported on 15.2% of returns )(% of AGI for various income ranges: 1.2% for AGIs below $25k , 0.7% for AGIs $25k-50k , 0.9% for AGIs $50k-75k , 0.7% for AGIs $75k-100k , 0.6% for AGIs $100k-200k , 3.0% for AGIs over 200k ) Net capital gain/loss in AGI: +$1,463 (reported on 11.5% of returns )Here:
+$1,463State:
+$9,326
(% of AGI for various income ranges: 0.3% for AGIs $50k-75k , 0.3% for AGIs $75k-100k , 0.6% for AGIs $100k-200k , 3.5% for AGIs over 200k ) Profit/loss from business: +$7,955 (reported on 12.7% of returns )Here:
+$7,955State:
+$11,523
(% of AGI for various income ranges: 6.0% for AGIs below $25k , 2.3% for AGIs $25k-50k , 1.5% for AGIs $50k-75k , 1.2% for AGIs $75k-100k , 2.5% for AGIs $100k-200k ) Taxable individual retirement arrangement distribution: $10,696 (reported on 10.3% of returns )48420:
$10,696Michigan:
$15,298
(% of AGI for various income ranges: 2.3% for AGIs below $25k , 2.5% for AGIs $25k-50k , 2.8% for AGIs $50k-75k , 2.6% for AGIs $75k-100k , 3.0% for AGIs $100k-200k ) Total itemized deductions: $17,602 (21% of AGI, reported on 25.0% of returns )Here:
$17,602State:
$21,628
Here:
21.5% of AGIState:
18.4% of AGI
(% of AGI for various income ranges: 5.9% for AGIs below $25k , 8.3% for AGIs $25k-50k , 10.5% for AGIs $50k-75k , 11.1% for AGIs $75k-100k , 12.4% for AGIs $100k-200k , 11.4% for AGIs over 200k ) Charity contributions: $3,004 (reported on 20.8% of returns )(% of AGI for various income ranges: 0.7% for AGIs below $25k , 0.9% for AGIs $25k-50k , 1.5% for AGIs $50k-75k , 1.6% for AGIs $75k-100k , 1.9% for AGIs $100k-200k , 2.2% for AGIs over 200k ) Taxes paid: $5,797 (reported on 25.0% of returns )(% of AGI for various income ranges: 1.2% for AGIs below $25k , 2.0% for AGIs $25k-50k , 2.9% for AGIs $50k-75k , 3.8% for AGIs $75k-100k , 4.9% for AGIs $100k-200k , 5.7% for AGIs over 200k ) Earned income credit: $2,063 (reported on 17.8% of returns )(% of AGI for various income ranges: 5.2% for AGIs below $25k , 1.0% for AGIs $25k-50k ) Percentage of individuals using paid preparers for their 2012 taxes: 62.4%(% for various income ranges: 57.7% for AGIs below $25k , 62.7% for AGIs $25k-50k , 66.7% for AGIs $50k-75k , 69.2% for AGIs $75k-100k , 69.9% for AGIs $100k-200k , 85.7% for AGIs over 200k )
Averages for the 2004 tax year for zip code 48420, filed in 2005:
Average Adjusted Gross Income (AGI) in 2004: $41,336 (Individual Income Tax Returns) Here:
$41,336State:
$48,204
Salary/wage: $36,827 (reported on 87.5% of returns )Here:
$36,827State:
$42,791
(% of AGI for various income ranges: 109.8% for AGIs below $10k , 59.6% for AGIs $10k-25k , 70.6% for AGIs $25k-50k , 80.6% for AGIs $50k-75k , 85.2% for AGIs $75k-100k , 80.6% for AGIs over 100k ) Taxable interest for individuals: $1,164 (reported on 46.7% of returns )This zip code:
$1,164Michigan:
$1,725
(% of AGI for various income ranges: 4.2% for AGIs below $10k , 2.7% for AGIs $10k-25k , 1.4% for AGIs $25k-50k , 0.8% for AGIs $50k-75k , 0.7% for AGIs $75k-100k , 1.5% for AGIs over 100k ) Taxable dividends: $1,104 (reported on 21.8% of returns )(% of AGI for various income ranges: 2.3% for AGIs below $10k , 1.0% for AGIs $10k-25k , 0.8% for AGIs $25k-50k , 0.4% for AGIs $50k-75k , 0.4% for AGIs $75k-100k , 0.5% for AGIs over 100k ) Net capital gain/loss: +$2,925 (reported on 14.1% of returns )Here:
+$2,925State:
+$8,532
(% of AGI for various income ranges: -1.5% for AGIs below $10k , -0.2% for AGIs $10k-25k , 0.4% for AGIs $25k-50k , 0.4% for AGIs $50k-75k , 0.6% for AGIs $75k-100k , 3.0% for AGIs over 100k ) Profit/loss from business: +$5,526 (reported on 13.0% of returns )Here:
+$5,526State:
+$9,547
(% of AGI for various income ranges: 10.2% for AGIs below $10k , 3.7% for AGIs $10k-25k , 1.1% for AGIs $25k-50k , 1.2% for AGIs $50k-75k , 1.0% for AGIs $75k-100k , 2.0% for AGIs over 100k ) IRA payment deduction: $2,708 (reported on 1.4% of returns )48420:
$2,708Michigan:
$2,875
(% of AGI for various income ranges: 0.1% for AGIs $10k-25k , 0.2% for AGIs $25k-50k , 0.1% for AGIs $50k-75k , 0.0% for AGIs $75k-100k , 0.0% for AGIs over 100k ) Self-employed pension: $12,875 (reported on 0.2% of returns )Here:
$12,875Michigan:
$13,826
Total itemized deductions: $15,748 (22% of AGI, reported on 35.2% of returns )Here:
$15,748State:
$18,509
Here:
22.0% of AGIState:
20.7% of AGI
(% of AGI for various income ranges: 11.0% for AGIs below $10k , 8.0% for AGIs $10k-25k , 12.8% for AGIs $25k-50k , 13.9% for AGIs $50k-75k , 14.4% for AGIs $75k-100k , 14.9% for AGIs over 100k ) Charity contributions deductions: $2,422 (3% of AGI, reported on 31.6% of returns )Here:
3.3% of AGIState:
3.6% of AGI
(% of AGI for various income ranges: 0.6% for AGIs below $10k , 0.9% for AGIs $10k-25k , 1.5% for AGIs $25k-50k , 1.7% for AGIs $50k-75k , 1.9% for AGIs $75k-100k , 2.6% for AGIs over 100k ) Total tax: $5,162 (reported on 77.0% of returns )(% of AGI for various income ranges: 3.3% for AGIs below $10k , 3.9% for AGIs $10k-25k , 6.3% for AGIs $25k-50k , 8.8% for AGIs $50k-75k , 10.5% for AGIs $75k-100k , 15.0% for AGIs over 100k ) Earned income credit: $1,585 (reported on 12.7% of returns )Percentage of individuals using paid preparers for their 2004 taxes: 65.7%(% for various income ranges: 56.3% for AGIs below $10k , 65.2% for AGIs $10k-25k , 68.0% for AGIs $25k-50k , 70.5% for AGIs $50k-75k , 68.6% for AGIs $75k-100k , 71.5% for AGIs over 100k )
Estimated median household income in 2022: This zip code:
$61,539Michigan:
$66,986
Nearest zip codes: 48458 ,
48437 ,
48505 ,
48504 ,
48506 ,
48415 .
Percentage of family households: This zip code:
42.9%Michigan:
43.3%
Percentage of households with unmarried partners: This zip code:
9.9%Michigan:
45.7%
Likely homosexual households (counted as self-reported same-sex unmarried-partner households)
Lesbian couples: 0.2% of all households Gay men: 0.0% of all households
Household received Food Stamps/SNAP in the past 12 months: 1,130Household did not receive Food Stamps/SNAP in the past 12 months: 7,718
Women who had a birth in the past 12 months: 215 (97 now married , 114 unmarried) Women who did not have a birth in the past 12 months: 4,175 (1,962 now married , 2,206 unmarried)
Housing units in zip code 48420 with a mortgage: 4,424 (355
second mortgage , 263
both second mortgage and home equity loan )
Houses without a mortgage: 180
Median monthly owner costs for units with a mortgage: $1,205
Median monthly owner costs for units without a mortgage: $512
Residents with income below the poverty level in 2022:
This zip code:
11.7%Whole state:
13.4%
Residents with income below 50% of the poverty level in 2022:
This zip code:
5.5%Whole state:
6.9%
Median number of rooms in houses and condos: Median number of rooms in apartments: Notable locations in this zip code not listed on our city pages
Click to draw/clear zip code borders Notable locations in zip code 48420: (A) , Auto City Speedway (B) , Vienna Greens Country Club (C) , Dodge Road Rest Area (D) , Clio Rest Area (E) , Clio Station (F) , C M Ambulance (G) , Clio Area Library (H) , Clio City Hall (I) , Clio Area Fire Department Station 2 (J) , Clio Area Fire Department Training Tower (K) , Clio Area Fire Department Station 1 (L) . Display/hide their locations on the map
Churches in zip code 48420 include: (A) , Landmark Baptist Church (B) , Praise Temple Church of God (C) , Lake Road Baptist Church (D) , Kingdom Hall of Jehovah's Witnesses (E) , Victory Tabernacle Pentecostal Church (F) , Clio Seventh-Day Adventist Church (G) , Clio Church of Christ (H) , First Baptist Church of Clio (I) . Display/hide their locations on the map
Cemeteries: (1) , West Vienna Cemetery (2) , Pine Run Cemetery (3) , Woodlawn Cemetery (4) , Pine Grove Cemetery (5) . Display/hide their locations on the map
Lake: (A) . Display/hide its location on the map
Streams, rivers, and creeks: (A) , Parker Creek (B) , Carpenter Branch (C) . Display/hide their locations on the map
Parks in zip code 48420 include: (1) , Clio City Park (2) , Buell Lake County Park (3) . Display/hide their locations on the map
Year house built (houses)
16 2020 or later216 2010 to 2019755 2000 to 2009935 1990 to 1999776 1980 to 19892,348 1970 to 19791,222 1960 to 19691,446 1950 to 1959419 1940 to 1949820 1939 or earlier
Zip code 48420 household income distribution in 2022 486 Less than $10,000293 $10,000 to $14,999345 $15,000 to $19,999346 $20,000 to $24,999283 $25,000 to $29,999299 $30,000 to $34,999290 $35,000 to $39,999648 $40,000 to $44,999342 $45,000 to $49,9991,004 $50,000 to $59,999932 $60,000 to $74,9991,324 $75,000 to $99,999927 $100,000 to $124,999504 $125,000 to $149,999449 $150,000 to $199,999405 $200,000 or moreEstimate of home value of owner-occupied houses/condos in 2022 in zip code 48420 57 Less than $10,00044 $10,000 to $14,99949 $15,000 to $19,99938 $20,000 to $24,99937 $25,000 to $29,99942 $30,000 to $34,99937 $35,000 to $39,99964 $40,000 to $49,99961 $50,000 to $59,999132 $60,000 to $69,999102 $70,000 to $79,999187 $80,000 to $89,999231 $90,000 to $99,999776 $100,000 to $124,999835 $125,000 to $149,999925 $150,000 to $174,999836 $175,000 to $199,9991,021 $200,000 to $249,999432 $250,000 to $299,999510 $300,000 to $399,99999 $400,000 to $499,999131 $500,000 to $749,99912 $750,000 to $999,99915 $1,500,000 to $1,999,999Rent paid by renters in 2022 in zip code 48420 7 $250 to $2998 $350 to $39933 $400 to $449141 $450 to $499354 $500 to $549159 $550 to $599194 $600 to $64972 $650 to $69991 $700 to $749134 $750 to $79983 $800 to $89976 $900 to $99939 $1,000 to $1,24932 $1,250 to $1,49926 $1,500 to $1,999154 No cash rent
Median gross rent in 2022: $775.
Estimated median house (or condo) value in 2022 for: White Non-Hispanic householders: $179,390Black or African American householders: $233,139American Indian or Alaska Native householders: $145,309Asian householders: $265,015Some other race householders: $166,673Two or more races householders: $196,854Hispanic or Latino householders: $163,960Estimated median house or condo value in 2022: $178,203
48420:
$178,203Michigan:
$224,400
Lower value quartile - upper value quartile: $128,152 - $237,493
Mean price in 2022: Detached houses: $136,075Here:
$136,075State:
$280,038
Mobile homes: $31,876Here:
$31,876State:
$72,868
Housing units in structures:
One, detached: 7,343One, attached: 342Two: 1123 or 4: 2155 to 9: 15110 to 19: 31620 to 49: 8550 or more: 146Mobile homes: 358Unemployment : 5.4%
Means of transportation to work in zip code 48420 79.9% 7,385 Drove a car alone9.1% 837 Carpooled0.3% 28 Bus or trolley bus0.2% 21 Taxi0.2% 15 Motorcycle0.1% 9 Bicycle0.9% 82 Walked0.5% 49 Other means6.9% 636 Worked at homeTravel time to work (commute) in zip code 48420 207 Less than 5 minutes856 5 to 9 minutes744 10 to 14 minutes941 15 to 19 minutes1,573 20 to 24 minutes982 25 to 29 minutes1,120 30 to 34 minutes238 35 to 39 minutes253 40 to 44 minutes482 45 to 59 minutes634 60 to 89 minutes392 90 or more minutes
Percentage of zip code residents living and working in this county: 71.4%
Household type by relationship:
Households: 20,969
Male householders: 4,224 (1,347 living alone ), Female householders: 4,636 (1,365 living alone )4,240 spouses (4,181 opposite-sex spouses ), 789 unmarried partners , (789 opposite-sex unmarried partners ), 5,065 children (4,754 natural , 115 adopted , 196 stepchildren ), 541 grandchildren , 145 brothers or sisters , 205 parents , 3 foster children , 425 other relatives , 463 non-relatives In group quarters: 285 (-1 institutionalized population )
Size of family households: 2,684 2-persons , 1,171 3-persons , 985 4-persons , 523 5-persons , 145 6-persons , 36 7-or-more-persons
Size of nonfamily households: 2,711 1-person , 530 2-persons , 59 3-persons
2,479 married couples with children. single-parent households (252 men , 789 women ).
96.9% of residents of 48420 zip code speak English at home. of residents speak Spanish at home (91% very well, 5% well, 4% not well ).of residents speak other Indo-European language at home (74% very well, 26% well ).of residents speak Asian or Pacific Island language at home (36% very well, 27% well, 37% not well ).
Foreign born population: 413 (2.0%)
(43.8%
of them are naturalized citizens )
This zip code:
2.0%Whole state:
6.9%
27% Ireland 24% Laos 12% Sweden 8% United Kingdom, excluding England and Scotland 8% France 3% Ukraine 2% Japan 14% German 13% English 12% American 8% European 7% Irish 5% Polish 3% French Canadian
Year of entry for the foreign-born population
122 2010 or later 90 2000 to 2009 68 1990 to 1999 163 Before 1990
Major facilities with environmental interests located in this zip code:
A.C. EDGERTON ELEMENTARY SCHOOL (11218 N. LINDEN ROAD in CLIO, MI)
(National Center for Education Statistics) - STATE ID-00002 Organizations: CLIO AREA SCHOOL DISTRICT (SCHOOL DISTRICT)
GEORGE A. LACURE ELEM. SCHOOL (12167 N. LEWIS ROAD in CLIO, MI)
(National Center for Education Statistics) - STATE ID-01383 Organizations: CLIO AREA SCHOOL DISTRICT (SCHOOL DISTRICT)
GEORGE R. CARTER MIDDLE SCHOOL (300 UPLAND DRIVE in CLIO, MI)
(National Center for Education Statistics) - STATE ID-01391 Organizations: CLIO AREA SCHOOL DISTRICT (SCHOOL DISTRICT)
GLEN GARNER ELEMENTARY SCHOOL (10271 CLIO ROAD in CLIO, MI)
(National Center for Education Statistics) - STATE ID-01416 Organizations: CLIO AREA SCHOOL DISTRICT (SCHOOL DISTRICT)
MARSH OIL AND GAS FIELD, INC. (KELLEN DUNCAN #2, NIAGARA/CASH CREEK FIELD (WELL NUMBER 2, NIAGARA/CASH CREEK FIELD in HENDERSON, KY)
(Integrated Compliance Information System) - ICIS-04-2003-1006, FORMAL ENFORCEMENT ACTION Business SIC classification: OIL AND GAS FIELD SERVICESAlternative names: MARSH OIL AND GAS FIELD, INC. (KELLEN DUNCAN #2, NIAGARA/CASH CREEK FIELD (UIC W
BLUE LAKES CHARTERS & TOURS (12145 N SAGINAW RD in CLIO, MI)
Small Quantity Generators, between 100 kg and 1000 kg of hazardous waste/month (Resource Conservation and Recovery Act (tracking hazardous waste)) - notification (Resource Conservation and Recovery Act (tracking hazardous waste)) Organizations: STANLEY CUPP (CONTACT/OWNER)
, JOSEPH ERHARDT JR (CONTACT/OWNER)
CHRISTENSEN POND-CLIO (RECREATIONAL POND in CLIO, MI)
National Pollutant Discharge Elimination System NON-MAJOR (Tracking pollutant discharge elimination systems) - permit Business SIC classification: CONSTRUCTION SAND AND GRAVELOrganizations: JIM CHRISTENSEN (CONTACT/OWNER)
AMOCO OIL CO (G4465 W VIENNA RD in CLIO, MI)
(Resource Conservation and Recovery Act (tracking hazardous waste)) Alternative names: AMOCO OIL CO 0137
AT&T (1123 LEWIS RD in CLIO, MI)
(Resource Conservation and Recovery Act (tracking hazardous waste))
MI DEPT/ENVIRONMENTAL QUALITY (12153 JENNINGS RD in CLIO, MI)
(Resource Conservation and Recovery Act (tracking hazardous waste)) Alternative names: MI DEPT/DEQ
MI DEPT/TRANSPORTATION (6527 1/2 W VIENNA RD in CLIO, MI)
(Resource Conservation and Recovery Act (tracking hazardous waste))
Housing units lacking complete plumbing facilities: 0.4%
Housing units lacking complete kitchen facilities: 0.9%
78.0% Utility gas 11.8% Electricity 6.3% Bottled, tank, or LP gas 2.6% Wood 0.6% Other fuel
Population in 1990: 21,345. Population change in the 1990s: +958 (+4.5%).
Place of birth for U.S.-born residents:
This state: 18,514Northeast: 256Midwest: 590South: 703West: 419
63% of the 48420 zip code residents lived in the same house 5 years ago.
Out of people who lived in different houses, 79% lived in this county.
Out of people who lived in different counties, 50% lived in Michigan.
92% of the 48420 zip code residents lived in the same house 1 year ago.
Out of people who lived in different houses, 57% moved from this county.
Out of people who lived in different houses, 36% moved from different county within same state.
Out of people who lived in different houses, 4% moved from different state.
Out of people who lived in different houses, 2% moved from abroad.
Private vs. public school enrollment:
Students in private schools in grades 1 to 8 (elementary and middle school): 343
Students in private schools in grades 9 to 12 (high school): 111
Students in private undergraduate colleges: 39
Occupation by median earnings in the past 12 months ($)
162,480 Legal occupations 84,216 Architecture and engineering occupations 78,961 Health diagnosing and treating practitioners and other technical occupations 68,189 Management occupations 66,205 Computer and mathematical occupations 57,745 Installation, maintenance, and repair occupations
Top industries in this zip code by the number of employees in 2005:
Accommodation and Food Services: Limited-Service Restaurants (50-99 employees: 1 establishment, 20-49 employees: 6 establishments, 10-19 employees: 2 establishments)Accommodation and Food Services: Full-Service Restaurants (20-49: 4, 10-19: 2, 5-9: 1, 1-4: 3)Health Care and Social Assistance: Nursing Care Facilities (100-249: 1)Health Care and Social Assistance: Residential Mental Retardation Facilities (10-19: 8, 5-9: 2, 1-4: 1)Other Services (except Public Administration): Religious Organizations (20-49: 2, 10-19: 3, 5-9: 2, 1-4: 4)Health Care and Social Assistance: Child Day Care Services (20-49: 1, 10-19: 2, 5-9: 2, 1-4: 5)Health Care and Social Assistance: Homes for the Elderly (50-99: 1, 5-9: 1, 1-4: 3)
People in group quarters in 2010:
140 people in nursing facilities/skilled-nursing facilities
109 people in group homes intended for adults
10 people in workers' group living quarters and job corps centers
People in group quarters in 2000:
144 people in nursing homes
76 people in homes for the mentally retarded
58 people in other group homes
20 people in homes for the physically handicapped
15 people in homes for the mentally ill
10 people in other noninstitutional group quarters
Fatal accident statistics in 2014:
Fatal accident count: 2Vehicles involved in fatal accidents: 4Fatal accidents caused by drunken drivers: 0Fatalities: 2Persons involved in fatal accidents: 6Pedestrians involved in fatal accidents: 0
Fatal accident statistics in 2012:
Fatal accident count: 2Vehicles involved in fatal accidents: 2Fatal accidents caused by drunken drivers: 1Fatalities: 2Persons involved in fatal accidents: 5Pedestrians involved in fatal accidents: 0
Home Mortgage Disclosure Act Aggregated Statistics For Year 2009(Based on 9 full and 12 partial tracts) A) FHA, FSA/RHS & VA B) Conventional C) Refinancings D) Home Improvement Loans E) Loans on Dwellings For 5+ Families F) Non-occupant Loans on G) Loans On Manufactured Number Average Value Number Average Value Number Average Value Number Average Value Number Average Value Number Average Value Number Average Value
LOANS ORIGINATED 160 $91,692 47 $87,268 426 $109,423 30 $39,053 2 $65,995 14 $47,426 11 $76,055 APPLICATIONS APPROVED, NOT ACCEPTED 4 $107,262 21 $36,051 48 $122,769 5 $16,660 0 $0 0 $0 17 $29,816 APPLICATIONS DENIED 28 $74,803 23 $63,092 189 $126,023 28 $26,501 0 $0 7 $69,690 10 $74,149 APPLICATIONS WITHDRAWN 29 $102,590 13 $52,490 117 $118,675 4 $30,252 0 $0 4 $45,712 9 $54,190 FILES CLOSED FOR INCOMPLETENESS 5 $80,818 5 $54,722 36 $112,758 0 $0 0 $0 2 $34,305 0 $0
Aggregated Statistics For Year 2008(Based on 9 full and 12 partial tracts) A) FHA, FSA/RHS & VA B) Conventional C) Refinancings D) Home Improvement Loans E) Loans on Dwellings For 5+ Families F) Non-occupant Loans on G) Loans On Manufactured Number Average Value Number Average Value Number Average Value Number Average Value Number Average Value Number Average Value Number Average Value
LOANS ORIGINATED 157 $99,909 99 $87,798 365 $110,513 71 $37,342 0 $0 14 $82,797 37 $73,065 APPLICATIONS APPROVED, NOT ACCEPTED 5 $92,804 29 $96,690 77 $113,425 6 $30,177 0 $0 6 $136,213 21 $48,474 APPLICATIONS DENIED 34 $92,028 44 $73,438 344 $121,876 85 $45,084 0 $0 18 $68,016 28 $62,075 APPLICATIONS WITHDRAWN 27 $90,309 14 $73,293 92 $122,053 7 $87,117 1 $2,125,000 13 $82,559 5 $81,226 FILES CLOSED FOR INCOMPLETENESS 6 $90,927 4 $126,632 40 $123,338 1 $11,020 0 $0 0 $0 0 $0
Aggregated Statistics For Year 2007(Based on 9 full and 12 partial tracts) A) FHA, FSA/RHS & VA B) Conventional C) Refinancings D) Home Improvement Loans F) Non-occupant Loans on G) Loans On Manufactured Number Average Value Number Average Value Number Average Value Number Average Value Number Average Value Number Average Value
LOANS ORIGINATED 66 $115,889 235 $92,425 593 $102,685 129 $29,165 36 $81,720 48 $64,548 APPLICATIONS APPROVED, NOT ACCEPTED 2 $106,000 57 $87,168 141 $112,110 16 $20,857 9 $154,990 22 $49,025 APPLICATIONS DENIED 6 $75,613 92 $90,501 561 $119,796 110 $42,106 26 $90,429 27 $54,363 APPLICATIONS WITHDRAWN 3 $112,847 25 $101,640 167 $121,976 11 $94,955 5 $131,272 10 $59,185 FILES CLOSED FOR INCOMPLETENESS 1 $111,000 8 $117,460 74 $107,894 3 $46,717 1 $155,000 0 $0
Aggregated Statistics For Year 2006(Based on 9 full and 12 partial tracts) A) FHA, FSA/RHS & VA B) Conventional C) Refinancings D) Home Improvement Loans E) Loans on Dwellings For 5+ Families F) Non-occupant Loans on G) Loans On Manufactured Number Average Value Number Average Value Number Average Value Number Average Value Number Average Value Number Average Value Number Average Value
LOANS ORIGINATED 50 $111,560 396 $97,005 860 $97,427 161 $31,009 2 $276,500 35 $82,933 27 $66,954 APPLICATIONS APPROVED, NOT ACCEPTED 1 $125,000 96 $81,079 185 $97,279 24 $30,475 0 $0 13 $117,206 6 $71,870 APPLICATIONS DENIED 3 $103,707 136 $91,832 653 $123,834 121 $43,534 2 $52,995 14 $114,109 31 $52,375 APPLICATIONS WITHDRAWN 8 $93,350 46 $121,113 354 $123,055 18 $68,259 0 $0 13 $104,239 4 $149,022 FILES CLOSED FOR INCOMPLETENESS 0 $0 7 $139,921 94 $122,485 3 $127,960 0 $0 6 $89,578 0 $0
Aggregated Statistics For Year 2005(Based on 9 full and 12 partial tracts) A) FHA, FSA/RHS & VA B) Conventional C) Refinancings D) Home Improvement Loans E) Loans on Dwellings For 5+ Families F) Non-occupant Loans on G) Loans On Manufactured Number Average Value Number Average Value Number Average Value Number Average Value Number Average Value Number Average Value Number Average Value
LOANS ORIGINATED 52 $119,310 481 $107,773 1,063 $105,998 163 $35,081 5 $94,200 61 $107,535 31 $68,708 APPLICATIONS APPROVED, NOT ACCEPTED 4 $96,715 68 $116,967 184 $133,193 23 $30,830 0 $0 15 $89,739 8 $75,219 APPLICATIONS DENIED 6 $94,357 174 $72,435 690 $129,699 115 $45,571 0 $0 31 $89,300 102 $46,846 APPLICATIONS WITHDRAWN 2 $88,465 76 $101,081 385 $126,308 25 $134,956 0 $0 12 $96,072 10 $66,574 FILES CLOSED FOR INCOMPLETENESS 2 $64,590 19 $68,311 203 $133,292 2 $18,055 0 $0 2 $105,805 3 $77,720
Aggregated Statistics For Year 2004(Based on 9 full and 12 partial tracts) A) FHA, FSA/RHS & VA B) Conventional C) Refinancings D) Home Improvement Loans F) Non-occupant Loans on G) Loans On Manufactured Number Average Value Number Average Value Number Average Value Number Average Value Number Average Value Number Average Value
LOANS ORIGINATED 70 $112,843 497 $105,008 1,238 $106,224 186 $35,346 44 $78,175 62 $77,848 APPLICATIONS APPROVED, NOT ACCEPTED 4 $76,962 84 $95,246 247 $110,568 32 $38,716 6 $96,218 17 $58,072 APPLICATIONS DENIED 16 $106,832 156 $81,063 672 $105,743 105 $36,779 20 $72,826 88 $52,400 APPLICATIONS WITHDRAWN 14 $116,272 28 $116,629 357 $116,719 19 $57,558 4 $76,460 8 $98,966 FILES CLOSED FOR INCOMPLETENESS 0 $0 30 $76,183 233 $112,200 9 $87,076 4 $68,118 15 $55,755
Aggregated Statistics For Year 2003(Based on 9 full and 12 partial tracts) A) FHA, FSA/RHS & VA B) Conventional C) Refinancings D) Home Improvement Loans F) Non-occupant Loans on Number Average Value Number Average Value Number Average Value Number Average Value Number Average Value
LOANS ORIGINATED 85 $109,468 465 $106,566 2,309 $101,203 172 $22,798 59 $77,312 APPLICATIONS APPROVED, NOT ACCEPTED 8 $104,748 50 $100,445 301 $98,110 24 $26,798 9 $69,261 APPLICATIONS DENIED 11 $101,085 106 $81,695 852 $99,231 118 $17,893 18 $78,524 APPLICATIONS WITHDRAWN 6 $117,555 51 $125,048 440 $106,903 14 $42,331 14 $99,206 FILES CLOSED FOR INCOMPLETENESS 6 $90,103 19 $103,027 108 $110,627 2 $20,015 1 $117,000
Aggregated Statistics For Year 2002(Based on 2 partial tracts) A) FHA, FSA/RHS & VA B) Conventional C) Refinancings D) Home Improvement Loans F) Non-occupant Loans on Number Average Value Number Average Value Number Average Value Number Average Value Number Average Value
LOANS ORIGINATED 3 $80,413 14 $97,378 137 $97,668 7 $19,837 1 $61,830 APPLICATIONS APPROVED, NOT ACCEPTED 0 $0 1 $202,720 10 $111,091 2 $38,010 1 $64,870 APPLICATIONS DENIED 0 $0 8 $47,386 36 $86,944 9 $18,582 1 $73,990 APPLICATIONS WITHDRAWN 0 $0 0 $0 47 $94,976 2 $8,110 0 $0 FILES CLOSED FOR INCOMPLETENESS 0 $0 0 $0 6 $91,393 0 $0 0 $0
Aggregated Statistics For Year 2001(Based on 2 partial tracts) A) FHA, FSA/RHS & VA B) Conventional C) Refinancings D) Home Improvement Loans F) Non-occupant Loans on Number Average Value Number Average Value Number Average Value Number Average Value Number Average Value
LOANS ORIGINATED 6 $115,720 22 $111,035 118 $90,348 35 $16,681 1 $52,710 APPLICATIONS APPROVED, NOT ACCEPTED 0 $0 3 $47,300 20 $65,782 2 $3,550 3 $41,897 APPLICATIONS DENIED 2 $113,525 5 $78,452 45 $81,696 8 $30,661 1 $50,680 APPLICATIONS WITHDRAWN 0 $0 1 $70,950 30 $101,056 1 $8,110 0 $0 FILES CLOSED FOR INCOMPLETENESS 0 $0 0 $0 7 $97,596 0 $0 0 $0
Aggregated Statistics For Year 2000(Based on 2 partial tracts) A) FHA, FSA/RHS & VA B) Conventional C) Refinancings D) Home Improvement Loans F) Non-occupant Loans on Number Average Value Number Average Value Number Average Value Number Average Value Number Average Value
LOANS ORIGINATED 6 $94,603 24 $101,318 51 $66,282 14 $13,973 2 $47,640 APPLICATIONS APPROVED, NOT ACCEPTED 1 $76,020 1 $91,220 13 $53,409 4 $12,922 1 $10,140 APPLICATIONS DENIED 1 $61,830 5 $46,422 26 $67,755 12 $20,525 1 $10,140 APPLICATIONS WITHDRAWN 0 $0 1 $92,240 19 $68,872 2 $55,750 2 $58,280 FILES CLOSED FOR INCOMPLETENESS 0 $0 0 $0 9 $80,074 0 $0 1 $91,220
Aggregated Statistics For Year 1999(Based on 2 full and 5 partial tracts) A) FHA, FSA/RHS & VA B) Conventional C) Refinancings D) Home Improvement Loans E) Loans on Dwellings For 5+ Families F) Non-occupant Loans on Number Average Value Number Average Value Number Average Value Number Average Value Number Average Value Number Average Value
LOANS ORIGINATED 88 $91,494 331 $86,944 561 $76,216 197 $13,151 1 $501,200 27 $75,523 APPLICATIONS APPROVED, NOT ACCEPTED 1 $113,450 100 $63,156 147 $80,512 43 $19,057 0 $0 5 $64,674 APPLICATIONS DENIED 6 $99,820 208 $51,129 227 $70,987 94 $12,410 0 $0 15 $73,309 APPLICATIONS WITHDRAWN 9 $90,512 31 $74,210 215 $80,311 12 $54,938 0 $0 5 $105,032 FILES CLOSED FOR INCOMPLETENESS 2 $90,810 9 $95,564 68 $89,779 1 $5,910 0 $0 1 $15,620
Private Mortgage Insurance Companies Aggregated Statistics For Year 2009(Based on 7 full and 8 partial tracts) A) Conventional B) Refinancings Number Average Value Number Average Value
LOANS ORIGINATED 0 $0 7 $108,291 APPLICATIONS APPROVED, NOT ACCEPTED 7 $127,273 6 $152,748 APPLICATIONS DENIED 0 $0 0 $0 APPLICATIONS WITHDRAWN 0 $0 0 $0 FILES CLOSED FOR INCOMPLETENESS 0 $0 2 $190,925
Aggregated Statistics For Year 2008(Based on 9 full and 12 partial tracts) A) Conventional B) Refinancings C) Non-occupant Loans on D) Loans On Manufactured Number Average Value Number Average Value Number Average Value Number Average Value
LOANS ORIGINATED 28 $112,719 39 $128,871 1 $88,000 0 $0 APPLICATIONS APPROVED, NOT ACCEPTED 22 $115,397 31 $142,386 5 $116,620 1 $103,940 APPLICATIONS DENIED 2 $58,955 5 $113,018 7 $92,849 0 $0 APPLICATIONS WITHDRAWN 0 $0 5 $160,558 1 $88,000 0 $0 FILES CLOSED FOR INCOMPLETENESS 3 $130,933 6 $135,113 5 $117,692 0 $0
Aggregated Statistics For Year 2007(Based on 9 full and 12 partial tracts) A) Conventional B) Refinancings C) Non-occupant Loans on Number Average Value Number Average Value Number Average Value
LOANS ORIGINATED 82 $116,934 49 $134,692 4 $84,602 APPLICATIONS APPROVED, NOT ACCEPTED 8 $114,700 25 $151,374 0 $0 APPLICATIONS DENIED 3 $109,577 3 $92,133 0 $0 APPLICATIONS WITHDRAWN 4 $125,395 3 $158,037 1 $128,000 FILES CLOSED FOR INCOMPLETENESS 0 $0 1 $289,000 0 $0
Aggregated Statistics For Year 2006(Based on 9 full and 12 partial tracts) A) Conventional B) Refinancings C) Non-occupant Loans on D) Loans On Manufactured Number Average Value Number Average Value Number Average Value Number Average Value
LOANS ORIGINATED 78 $118,599 54 $153,083 1 $99,000 0 $0 APPLICATIONS APPROVED, NOT ACCEPTED 14 $127,265 16 $176,161 1 $170,280 0 $0 APPLICATIONS DENIED 2 $49,230 4 $209,165 0 $0 0 $0 APPLICATIONS WITHDRAWN 0 $0 5 $105,310 0 $0 1 $113,520 FILES CLOSED FOR INCOMPLETENESS 0 $0 0 $0 0 $0 0 $0
Aggregated Statistics For Year 2005(Based on 9 full and 12 partial tracts) A) Conventional B) Refinancings C) Non-occupant Loans on D) Loans On Manufactured Number Average Value Number Average Value Number Average Value Number Average Value
LOANS ORIGINATED 80 $132,306 66 $142,400 3 $68,663 0 $0 APPLICATIONS APPROVED, NOT ACCEPTED 22 $176,047 28 $163,186 1 $49,160 0 $0 APPLICATIONS DENIED 2 $77,990 1 $128,000 0 $0 3 $94,660 APPLICATIONS WITHDRAWN 6 $141,663 6 $163,510 1 $174,000 0 $0 FILES CLOSED FOR INCOMPLETENESS 0 $0 0 $0 0 $0 0 $0
Aggregated Statistics For Year 2004(Based on 9 full and 12 partial tracts) A) Conventional B) Refinancings C) Non-occupant Loans on Number Average Value Number Average Value Number Average Value
LOANS ORIGINATED 109 $120,788 80 $131,432 3 $71,667 APPLICATIONS APPROVED, NOT ACCEPTED 27 $131,150 37 $129,712 0 $0 APPLICATIONS DENIED 0 $0 3 $93,333 0 $0 APPLICATIONS WITHDRAWN 3 $122,053 9 $147,740 2 $168,065 FILES CLOSED FOR INCOMPLETENESS 2 $94,785 1 $140,000 0 $0
Aggregated Statistics For Year 2003(Based on 9 full and 12 partial tracts) A) Conventional B) Refinancings C) Non-occupant Loans on Number Average Value Number Average Value Number Average Value
LOANS ORIGINATED 121 $117,450 172 $128,921 5 $88,394 APPLICATIONS APPROVED, NOT ACCEPTED 24 $174,193 56 $121,846 2 $103,990 APPLICATIONS DENIED 4 $161,720 6 $111,002 0 $0 APPLICATIONS WITHDRAWN 6 $153,637 24 $120,918 5 $101,196 FILES CLOSED FOR INCOMPLETENESS 0 $0 0 $0 0 $0
Aggregated Statistics For Year 2002(Based on 2 partial tracts) A) Conventional B) Refinancings C) Non-occupant Loans on Number Average Value Number Average Value Number Average Value
LOANS ORIGINATED 6 $100,515 8 $116,438 1 $61,830 APPLICATIONS APPROVED, NOT ACCEPTED 1 $150,010 4 $126,952 0 $0 APPLICATIONS DENIED 0 $0 0 $0 0 $0 APPLICATIONS WITHDRAWN 0 $0 2 $121,125 0 $0 FILES CLOSED FOR INCOMPLETENESS 0 $0 0 $0 0 $0
Aggregated Statistics For Year 2001(Based on 2 partial tracts) A) Conventional B) Refinancings Number Average Value Number Average Value
LOANS ORIGINATED 11 $111,496 10 $119,402 APPLICATIONS APPROVED, NOT ACCEPTED 0 $0 2 $162,685 APPLICATIONS DENIED 0 $0 2 $116,565 APPLICATIONS WITHDRAWN 1 $127,710 0 $0 FILES CLOSED FOR INCOMPLETENESS 0 $0 0 $0
Aggregated Statistics For Year 2000(Based on 2 partial tracts) A) Conventional B) Refinancings Number Average Value Number Average Value
LOANS ORIGINATED 8 $89,450 6 $126,193 APPLICATIONS APPROVED, NOT ACCEPTED 5 $123,456 1 $140,890 APPLICATIONS DENIED 0 $0 0 $0 APPLICATIONS WITHDRAWN 0 $0 0 $0 FILES CLOSED FOR INCOMPLETENESS 0 $0 0 $0
Aggregated Statistics For Year 1999(Based on 2 full and 5 partial tracts) A) Conventional B) Refinancings C) Non-occupant Loans on Number Average Value Number Average Value Number Average Value
LOANS ORIGINATED 92 $100,926 35 $102,812 5 $82,876 APPLICATIONS APPROVED, NOT ACCEPTED 4 $135,562 6 $91,250 0 $0 APPLICATIONS DENIED 2 $96,625 1 $88,330 0 $0 APPLICATIONS WITHDRAWN 0 $0 0 $0 0 $0 FILES CLOSED FOR INCOMPLETENESS 0 $0 0 $0 0 $0
2002 - 2018 National Fire Incident Reporting System (NFIRS) incidents See full 2006 National Fire Incident Reporting System statistics for zip code 48420, Michigan
Most common first names in zip code 48420 among deceased individuals Name Count Lived (average)
John 117 72.2 years William 98 72.1 years James 96 70.2 years Robert 90 70.1 years Mary 87 77.0 years Charles 66 72.4 years Joseph 55 72.9 years Donald 54 69.2 years George 54 75.1 years Helen 46 80.8 years
Most common last names in zip code 48420 among deceased individuals Last name Count Lived (average)
Smith 62 72.9 years Jones 29 73.0 years Johnson 24 79.6 years White 22 72.4 years Williams 22 75.4 years Taylor 22 72.4 years Moore 19 75.9 years Miller 18 76.8 years Wright 18 78.7 years Morgan 17 77.6 years
Businesses in zip code 48420
Name Count Name Count
Advance Auto Parts 1 MasterBrand Cabinets 2 Arby's 1 McDonald's 1 AutoZone 1 Menards 1 Burger King 1 RadioShack 1 Chevrolet 1 Rite Aid 1 Curves 1 Sears 1 Dairy Queen 1 Sprint Nextel 1 FedEx 1 Subway 2 GNC 1 T-Mobile 2 H&R Block 1 Taco Bell 1 Jones New York 1 Tim Hortons 1 KFC 1 U-Haul 3 Kmart 1 Walmart 1 Little Caesars Pizza 1 Wendy's 1

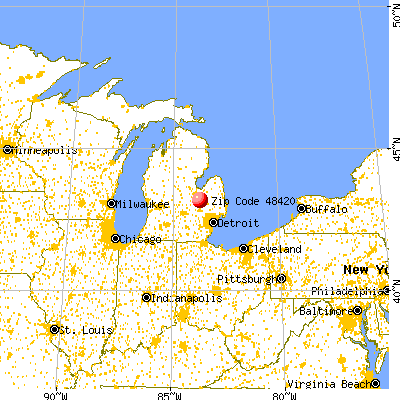


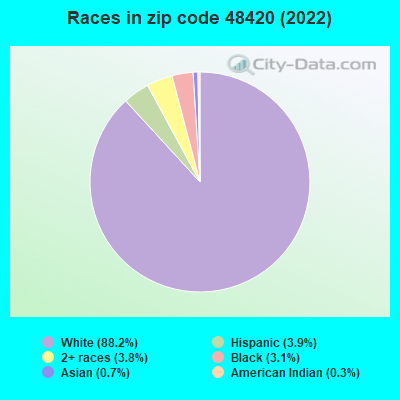


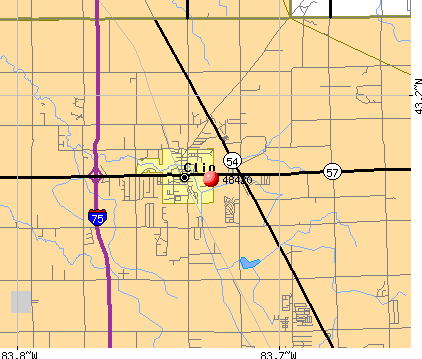 Nearest zip codes: 48458, 48437, 48505, 48504, 48506, 48415.
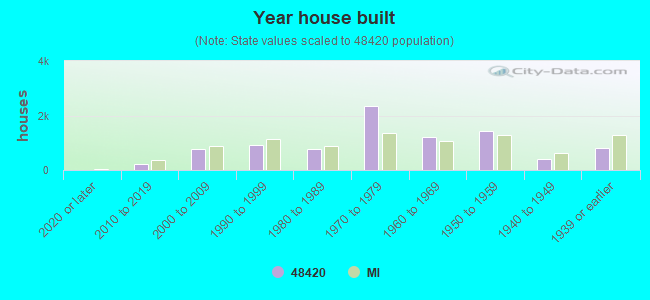

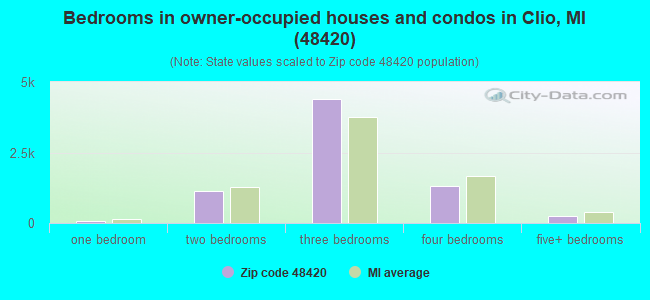
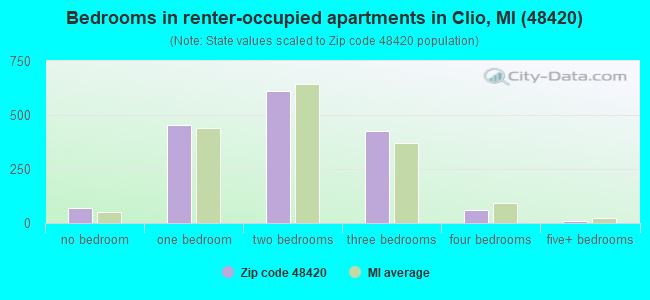
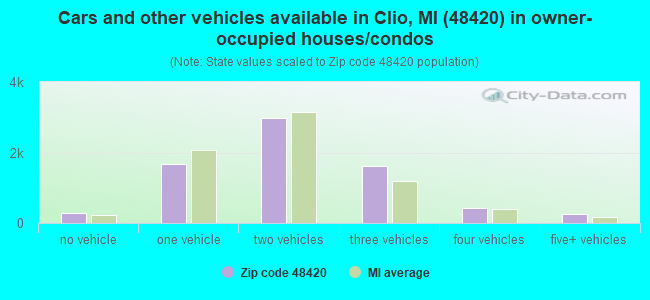
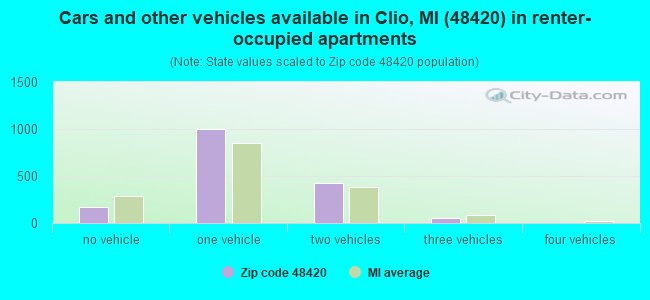


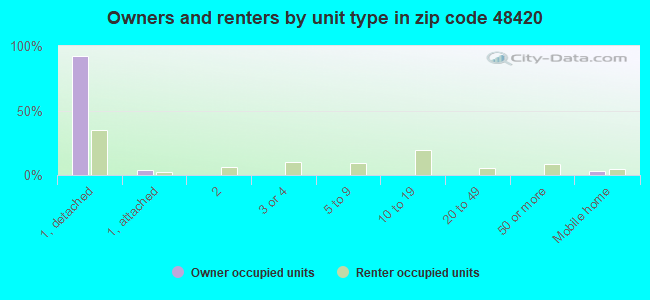
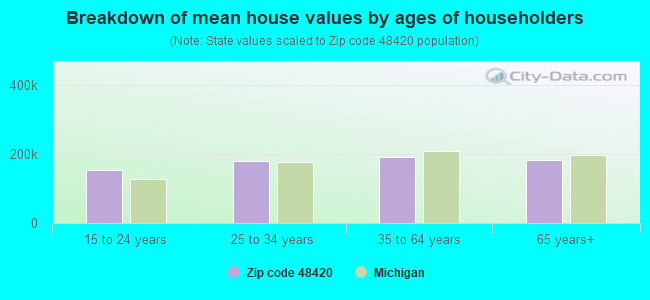


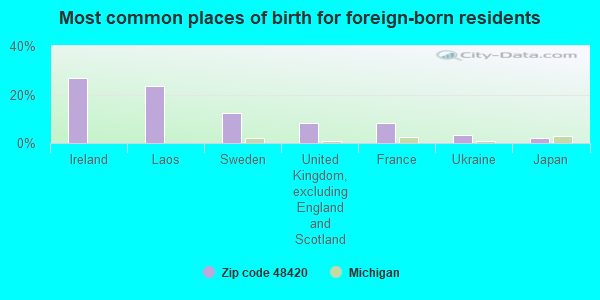
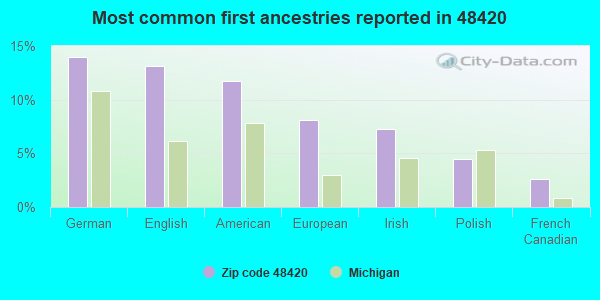
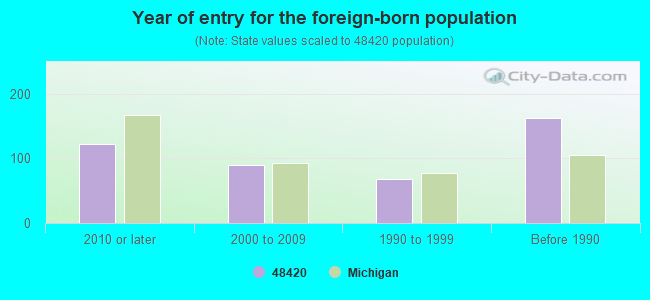
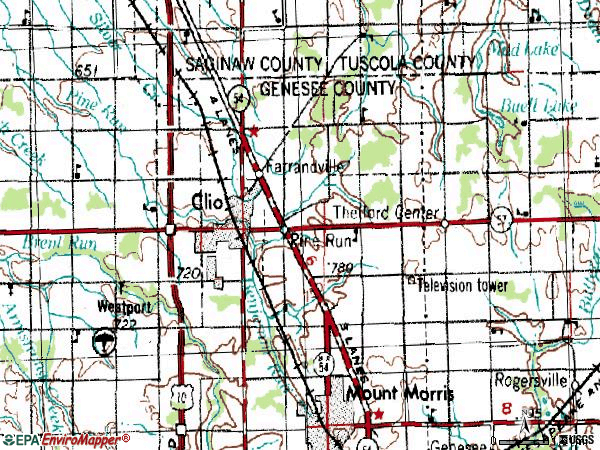


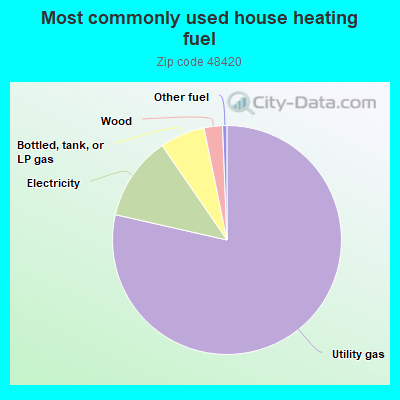
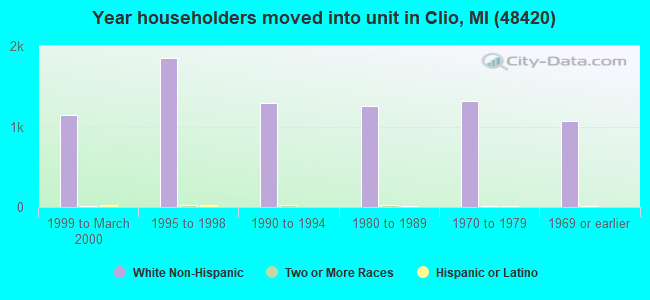
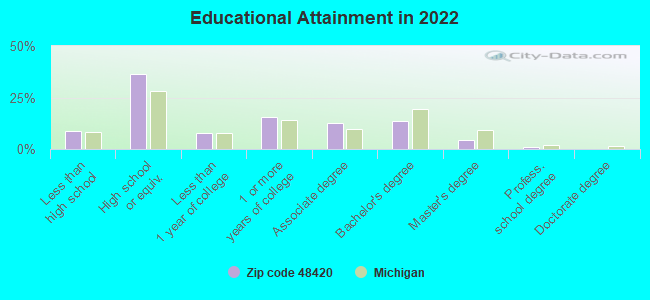
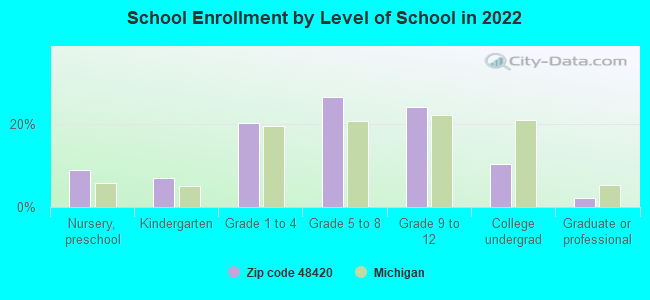
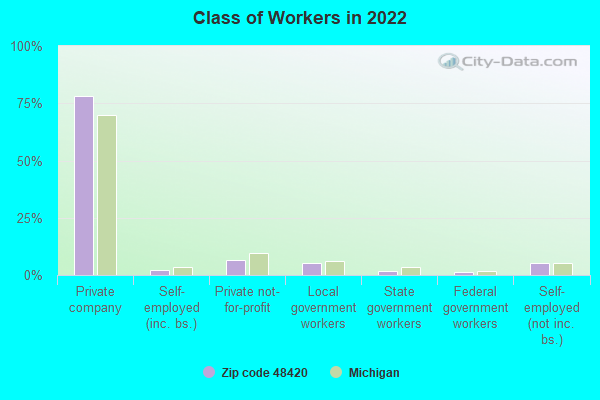
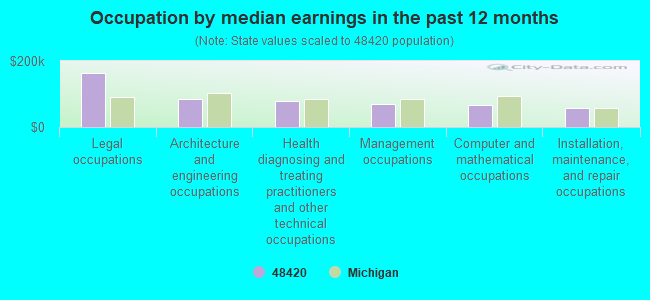
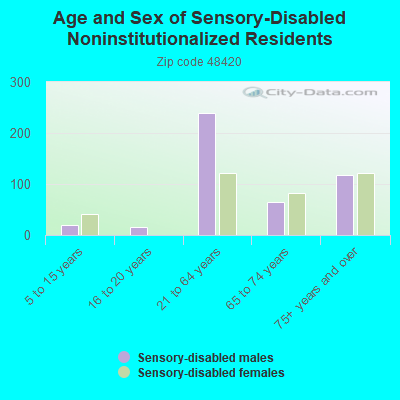
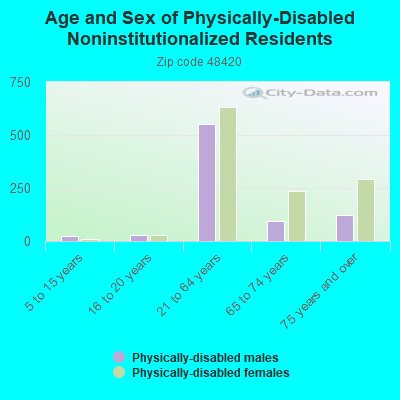
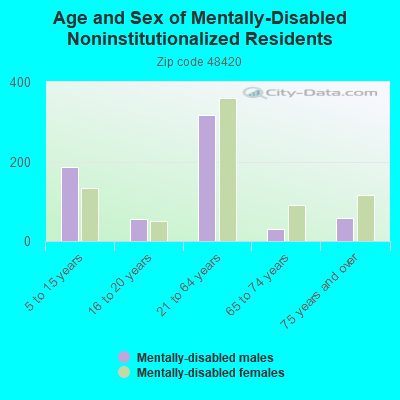
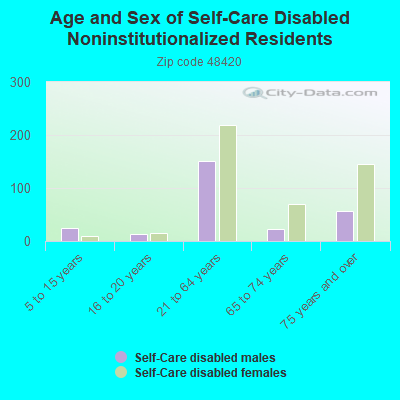
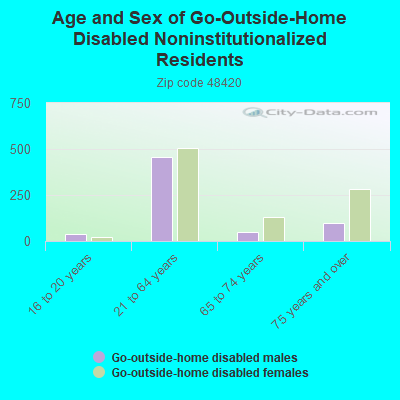
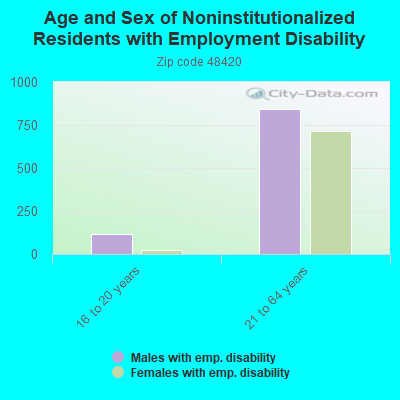
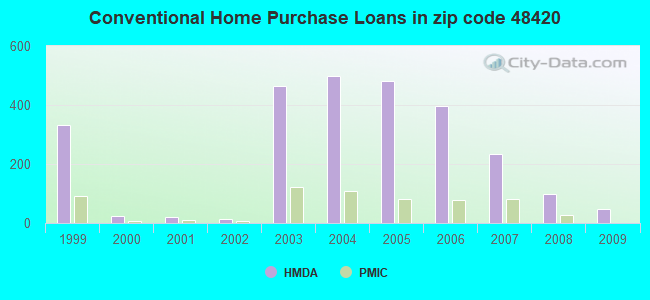
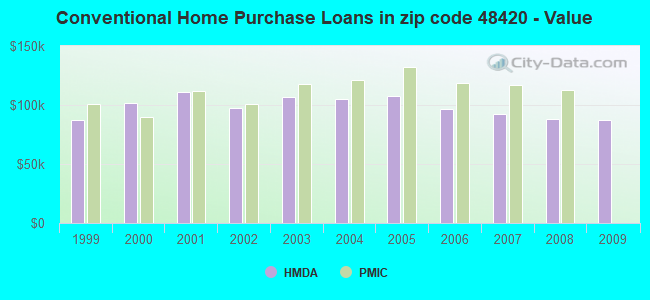
 According to the data from the years 2002 - 2018 the average number of fires per year is 97. The highest number of fires - 120 took place in 2016, and the least - 66 in 2010. The data has a dropping trend.
 When looking into fire subcategories, the most reports belonged to: Structure Fires (42.3%), and Outside Fires (35.7%).